Cities with the Highest Percentage of Ethiopian Population in Illinois
RELATED REPORTS & OPTIONS
Ethiopian
Illinois
Compare Cities
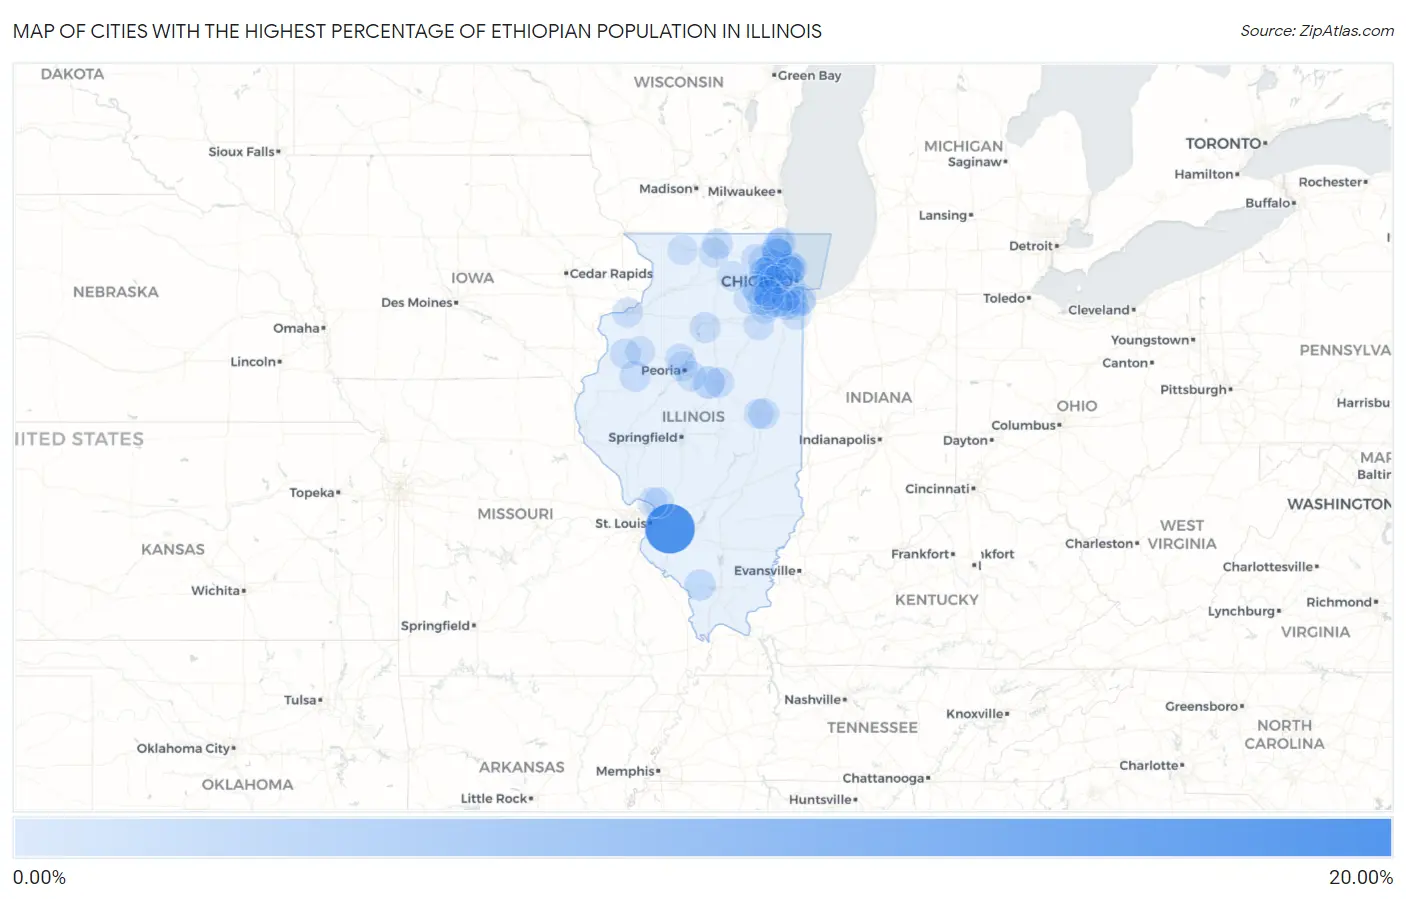
Map of Cities with the Highest Percentage of Ethiopian Population in Illinois
0.00%
20.00%
Cities with the Highest Percentage of Ethiopian Population in Illinois
| City | Ethiopian | vs State | vs National | |
| 1. | Scott Afb | 15.16% | 0.058%(+15.1)#1 | 0.11%(+15.1)#3 |
| 2. | Danvers | 1.73% | 0.058%(+1.67)#2 | 0.11%(+1.63)#128 |
| 3. | Indian Creek | 1.20% | 0.058%(+1.15)#3 | 0.11%(+1.10)#200 |
| 4. | Golf | 1.10% | 0.058%(+1.04)#4 | 0.11%(+0.992)#219 |
| 5. | Murphysboro | 0.77% | 0.058%(+0.717)#5 | 0.11%(+0.667)#294 |
| 6. | Granville | 0.61% | 0.058%(+0.553)#6 | 0.11%(+0.503)#349 |
| 7. | Urbana | 0.58% | 0.058%(+0.518)#7 | 0.11%(+0.468)#366 |
| 8. | Prairie City | 0.57% | 0.058%(+0.515)#8 | 0.11%(+0.466)#368 |
| 9. | Barrington Hills | 0.57% | 0.058%(+0.508)#9 | 0.11%(+0.458)#375 |
| 10. | Robbins | 0.50% | 0.058%(+0.442)#10 | 0.11%(+0.392)#411 |
| 11. | Wheaton | 0.36% | 0.058%(+0.302)#11 | 0.11%(+0.252)#504 |
| 12. | Machesney Park | 0.35% | 0.058%(+0.288)#12 | 0.11%(+0.239)#525 |
| 13. | Burnham | 0.30% | 0.058%(+0.240)#13 | 0.11%(+0.191)#571 |
| 14. | Skokie | 0.23% | 0.058%(+0.176)#14 | 0.11%(+0.127)#664 |
| 15. | Evanston | 0.23% | 0.058%(+0.172)#15 | 0.11%(+0.122)#670 |
| 16. | Monmouth | 0.23% | 0.058%(+0.170)#16 | 0.11%(+0.121)#674 |
| 17. | Rolling Meadows | 0.21% | 0.058%(+0.154)#17 | 0.11%(+0.105)#709 |
| 18. | Rock Island | 0.21% | 0.058%(+0.154)#18 | 0.11%(+0.105)#710 |
| 19. | Coal City | 0.21% | 0.058%(+0.153)#19 | 0.11%(+0.104)#713 |
| 20. | Morton Grove | 0.19% | 0.058%(+0.131)#20 | 0.11%(+0.081)#759 |
| 21. | Hanover Park | 0.19% | 0.058%(+0.130)#21 | 0.11%(+0.081)#760 |
| 22. | Romeoville | 0.17% | 0.058%(+0.109)#22 | 0.11%(+0.060)#798 |
| 23. | Chicago | 0.16% | 0.058%(+0.097)#23 | 0.11%(+0.048)#829 |
| 24. | Normal | 0.15% | 0.058%(+0.095)#24 | 0.11%(+0.046)#833 |
| 25. | Dunlap | 0.14% | 0.058%(+0.083)#25 | 0.11%(+0.034)#867 |
| 26. | Morton | 0.13% | 0.058%(+0.075)#26 | 0.11%(+0.025)#892 |
| 27. | Glendale Heights | 0.13% | 0.058%(+0.069)#27 | 0.11%(+0.020)#909 |
| 28. | Algonquin | 0.12% | 0.058%(+0.066)#28 | 0.11%(+0.017)#922 |
| 29. | Homewood | 0.11% | 0.058%(+0.053)#29 | 0.11%(+0.003)#958 |
| 30. | Bethalto | 0.11% | 0.058%(+0.050)#30 | 0.11%(+0.000)#969 |
| 31. | Crete | 0.11% | 0.058%(+0.049)#31 | 0.11%(-0.000)#971 |
| 32. | Alton | 0.11% | 0.058%(+0.047)#32 | 0.11%(-0.002)#978 |
| 33. | Downers Grove | 0.10% | 0.058%(+0.044)#33 | 0.11%(-0.005)#990 |
| 34. | Orland Park | 0.096% | 0.058%(+0.038)#34 | 0.11%(-0.011)#1,010 |
| 35. | Yorkville | 0.094% | 0.058%(+0.036)#35 | 0.11%(-0.013)#1,021 |
| 36. | Crest Hill | 0.091% | 0.058%(+0.033)#36 | 0.11%(-0.017)#1,035 |
| 37. | Schaumburg | 0.086% | 0.058%(+0.029)#37 | 0.11%(-0.021)#1,052 |
| 38. | Carol Stream | 0.086% | 0.058%(+0.028)#38 | 0.11%(-0.022)#1,057 |
| 39. | Gurnee | 0.082% | 0.058%(+0.024)#39 | 0.11%(-0.026)#1,072 |
| 40. | North Aurora | 0.073% | 0.058%(+0.015)#40 | 0.11%(-0.034)#1,110 |
| 41. | Calumet City | 0.064% | 0.058%(+0.007)#41 | 0.11%(-0.043)#1,135 |
| 42. | Rockford | 0.059% | 0.058%(+0.001)#42 | 0.11%(-0.049)#1,174 |
| 43. | Libertyville | 0.058% | 0.058%(+0.001)#43 | 0.11%(-0.049)#1,177 |
| 44. | Tinley Park | 0.058% | 0.058%(-0.000)#44 | 0.11%(-0.050)#1,180 |
| 45. | Vernon Hills | 0.049% | 0.058%(-0.009)#45 | 0.11%(-0.059)#1,235 |
| 46. | Galesburg | 0.037% | 0.058%(-0.021)#46 | 0.11%(-0.071)#1,306 |
| 47. | Bartlett | 0.037% | 0.058%(-0.021)#47 | 0.11%(-0.071)#1,307 |
| 48. | Joliet | 0.036% | 0.058%(-0.022)#48 | 0.11%(-0.071)#1,313 |
| 49. | Freeport | 0.033% | 0.058%(-0.024)#49 | 0.11%(-0.074)#1,334 |
| 50. | Plainfield | 0.033% | 0.058%(-0.024)#50 | 0.11%(-0.074)#1,335 |
| 51. | Peoria | 0.027% | 0.058%(-0.030)#51 | 0.11%(-0.080)#1,385 |
| 52. | Lombard | 0.027% | 0.058%(-0.031)#52 | 0.11%(-0.080)#1,388 |
| 53. | Dekalb | 0.027% | 0.058%(-0.031)#53 | 0.11%(-0.080)#1,392 |
| 54. | Naperville | 0.021% | 0.058%(-0.036)#54 | 0.11%(-0.086)#1,442 |
| 55. | Aurora | 0.019% | 0.058%(-0.039)#55 | 0.11%(-0.088)#1,456 |
| 56. | Palos Heights | 0.017% | 0.058%(-0.041)#56 | 0.11%(-0.091)#1,479 |
| 57. | Lincolnwood | 0.015% | 0.058%(-0.043)#57 | 0.11%(-0.092)#1,499 |
| 58. | Elmhurst | 0.013% | 0.058%(-0.045)#58 | 0.11%(-0.094)#1,527 |
| 59. | Homer Glen | 0.012% | 0.058%(-0.046)#59 | 0.11%(-0.095)#1,536 |
| 60. | Waukegan | 0.011% | 0.058%(-0.047)#60 | 0.11%(-0.096)#1,549 |
| 61. | Champaign | 0.010% | 0.058%(-0.048)#61 | 0.11%(-0.097)#1,559 |
| 62. | Bolingbrook | 0.0095% | 0.058%(-0.048)#62 | 0.11%(-0.098)#1,566 |
Common Questions
What are the Top 10 Cities with the Highest Percentage of Ethiopian Population in Illinois?
Top 10 Cities with the Highest Percentage of Ethiopian Population in Illinois are:
#1
15.16%
#2
1.73%
#3
1.20%
#4
1.10%
#5
0.77%
#6
0.61%
#7
0.58%
#8
0.57%
#9
0.57%
#10
0.50%
What city has the Highest Percentage of Ethiopian Population in Illinois?
Scott AFB has the Highest Percentage of Ethiopian Population in Illinois with 15.16%.
What is the Percentage of Ethiopian Population in the State of Illinois?
Percentage of Ethiopian Population in Illinois is 0.058%.
What is the Percentage of Ethiopian Population in the United States?
Percentage of Ethiopian Population in the United States is 0.11%.