Cities with the Highest Percentage of Ethiopian Population in the United States
RELATED REPORTS & OPTIONS
Ethiopian
United States
Compare Cities
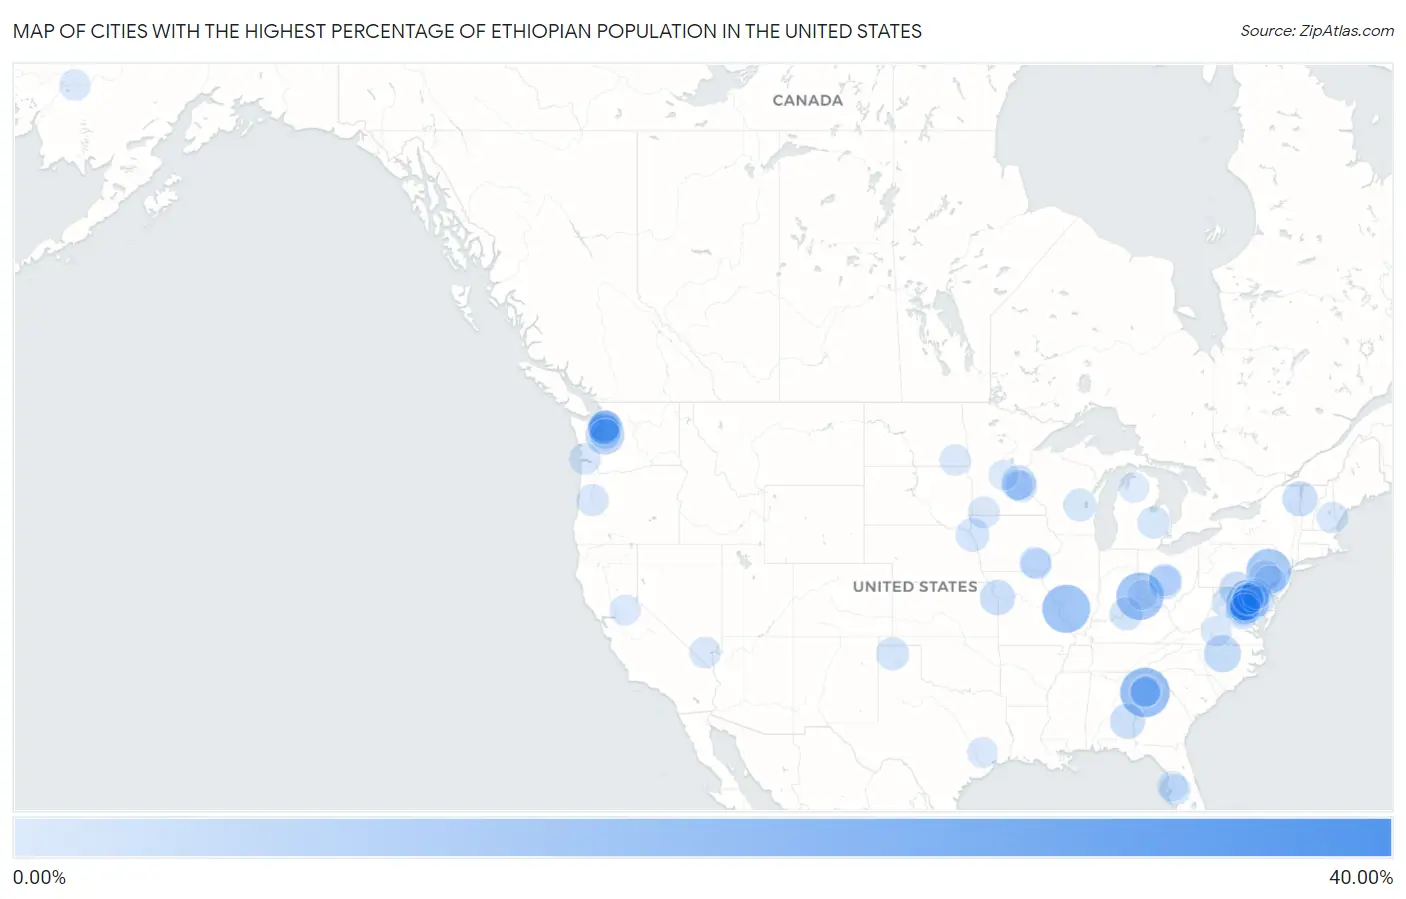
Map of Cities with the Highest Percentage of Ethiopian Population in the United States
0.00%
40.00%
Cities with the Highest Percentage of Ethiopian Population in the United States
| City | Ethiopian | vs State | vs National | |
| 1. | Scotts | 32.97% | 0.029%(+32.9)#1 | 0.11%(+32.9)#1 |
| 2. | Clarkston | 16.31% | 0.22%(+16.1)#1 | 0.11%(+16.2)#2 |
| 3. | Scott Afb | 15.16% | 0.058%(+15.1)#1 | 0.11%(+15.1)#3 |
| 4. | Dry Ridge | 14.66% | 0.097%(+14.6)#1 | 0.11%(+14.5)#4 |
| 5. | Trexlertown | 12.73% | 0.052%(+12.7)#1 | 0.11%(+12.6)#5 |
| 6. | White Oak | 9.88% | 0.62%(+9.27)#1 | 0.11%(+9.78)#6 |
| 7. | Takoma Park | 9.76% | 0.62%(+9.14)#2 | 0.11%(+9.65)#7 |
| 8. | Brook Forest | 8.97% | 0.22%(+8.76)#1 | 0.11%(+8.86)#8 |
| 9. | Seatac | 8.40% | 0.33%(+8.07)#1 | 0.11%(+8.29)#9 |
| 10. | Calverton | 7.74% | 0.62%(+7.12)#3 | 0.11%(+7.63)#10 |
| 11. | Lincolnia | 7.34% | 0.46%(+6.88)#1 | 0.11%(+7.24)#11 |
| 12. | Silver Spring | 7.27% | 0.62%(+6.65)#4 | 0.11%(+7.16)#12 |
| 13. | Gorman | 7.06% | 0.069%(+6.99)#1 | 0.11%(+6.95)#13 |
| 14. | Kemp Mill | 6.71% | 0.62%(+6.09)#5 | 0.11%(+6.60)#14 |
| 15. | Derwood | 6.38% | 0.62%(+5.76)#6 | 0.11%(+6.27)#15 |
| 16. | Kingstowne | 6.35% | 0.46%(+5.89)#2 | 0.11%(+6.24)#16 |
| 17. | Bailey S Crossroads | 6.31% | 0.46%(+5.85)#3 | 0.11%(+6.20)#17 |
| 18. | Riverside | 5.78% | 0.051%(+5.72)#1 | 0.11%(+5.67)#18 |
| 19. | Burtonsville | 5.72% | 0.62%(+5.10)#7 | 0.11%(+5.61)#19 |
| 20. | Willsboro | 5.58% | 0.043%(+5.53)#1 | 0.11%(+5.47)#20 |
| 21. | Midway | 5.52% | 0.0076%(+5.52)#1 | 0.11%(+5.42)#21 |
| 22. | Woodlawn Cdp Fairfax County | 5.50% | 0.46%(+5.03)#4 | 0.11%(+5.39)#22 |
| 23. | Chillum | 5.34% | 0.62%(+4.72)#8 | 0.11%(+5.23)#23 |
| 24. | Lexington | 5.15% | 0.47%(+4.68)#1 | 0.11%(+5.04)#24 |
| 25. | Alderwood Manor | 5.13% | 0.33%(+4.80)#2 | 0.11%(+5.02)#25 |
| 26. | Wilson Conococheague | 5.02% | 0.62%(+4.40)#9 | 0.11%(+4.91)#26 |
| 27. | Brier | 5.00% | 0.33%(+4.67)#3 | 0.11%(+4.89)#27 |
| 28. | Wheaton | 4.79% | 0.62%(+4.17)#10 | 0.11%(+4.68)#28 |
| 29. | Whitehall | 4.75% | 0.097%(+4.65)#2 | 0.11%(+4.64)#29 |
| 30. | Glenmont | 4.68% | 0.62%(+4.06)#11 | 0.11%(+4.57)#30 |
| 31. | Alexandria | 4.52% | 0.46%(+4.06)#5 | 0.11%(+4.41)#31 |
| 32. | Newington | 4.45% | 0.46%(+3.99)#6 | 0.11%(+4.35)#32 |
| 33. | Laurel Hill | 4.44% | 0.46%(+3.98)#7 | 0.11%(+4.34)#33 |
| 34. | South Sioux City | 4.42% | 0.057%(+4.37)#1 | 0.11%(+4.32)#34 |
| 35. | Woodbridge | 4.34% | 0.46%(+3.88)#8 | 0.11%(+4.23)#35 |
| 36. | Dumfries | 4.34% | 0.46%(+3.87)#9 | 0.11%(+4.23)#36 |
| 37. | Burnt Mills | 4.32% | 0.62%(+3.70)#12 | 0.11%(+4.21)#37 |
| 38. | Falmouth | 4.31% | 0.46%(+3.85)#10 | 0.11%(+4.20)#38 |
| 39. | Cactus | 4.12% | 0.099%(+4.03)#1 | 0.11%(+4.02)#39 |
| 40. | Creekside | 4.12% | 0.032%(+4.09)#1 | 0.11%(+4.01)#40 |
| 41. | Franconia | 4.03% | 0.46%(+3.57)#11 | 0.11%(+3.92)#41 |
| 42. | Laytonsville | 3.94% | 0.62%(+3.32)#13 | 0.11%(+3.83)#42 |
| 43. | Eureka | 3.93% | 0.015%(+3.91)#1 | 0.11%(+3.82)#43 |
| 44. | Cloverly | 3.85% | 0.62%(+3.23)#14 | 0.11%(+3.74)#44 |
| 45. | Accokeek | 3.84% | 0.62%(+3.23)#15 | 0.11%(+3.74)#45 |
| 46. | National Harbor | 3.73% | 0.62%(+3.11)#16 | 0.11%(+3.62)#46 |
| 47. | Mount Morris | 3.62% | 0.029%(+3.59)#2 | 0.11%(+3.52)#47 |
| 48. | Mcnair | 3.59% | 0.46%(+3.13)#12 | 0.11%(+3.48)#48 |
| 49. | Huber Ridge | 3.49% | 0.097%(+3.39)#3 | 0.11%(+3.38)#49 |
| 50. | Adelphi | 3.45% | 0.62%(+2.83)#17 | 0.11%(+3.35)#50 |
| 51. | Fairland | 3.37% | 0.62%(+2.75)#18 | 0.11%(+3.26)#51 |
| 52. | Harrisburg | 3.33% | 0.11%(+3.22)#1 | 0.11%(+3.22)#52 |
| 53. | Woodstock | 3.31% | 0.46%(+2.85)#13 | 0.11%(+3.20)#53 |
| 54. | Lynnwood | 3.30% | 0.33%(+2.97)#4 | 0.11%(+3.20)#54 |
| 55. | Worthington | 3.30% | 0.47%(+2.83)#2 | 0.11%(+3.20)#55 |
| 56. | Edwardsville Borough | 3.27% | 0.052%(+3.22)#2 | 0.11%(+3.16)#56 |
| 57. | Rosburg | 3.26% | 0.33%(+2.93)#5 | 0.11%(+3.16)#57 |
| 58. | Gibraltar | 3.24% | 0.052%(+3.19)#3 | 0.11%(+3.13)#58 |
| 59. | Green Valley | 3.18% | 0.62%(+2.56)#19 | 0.11%(+3.07)#59 |
| 60. | Oakdale | 3.18% | 0.47%(+2.71)#3 | 0.11%(+3.07)#60 |
| 61. | Chesterbrook | 3.17% | 0.052%(+3.12)#4 | 0.11%(+3.06)#61 |
| 62. | Aspen Hill | 3.10% | 0.62%(+2.48)#20 | 0.11%(+2.99)#62 |
| 63. | Layhill | 3.06% | 0.62%(+2.45)#21 | 0.11%(+2.96)#63 |
| 64. | Chalfont Borough | 3.03% | 0.052%(+2.98)#5 | 0.11%(+2.92)#64 |
| 65. | West Woodstock | 3.02% | 0.011%(+3.01)#1 | 0.11%(+2.92)#65 |
| 66. | Tukwila | 3.02% | 0.33%(+2.69)#6 | 0.11%(+2.91)#66 |
| 67. | Spring Valley | 2.97% | 0.41%(+2.56)#1 | 0.11%(+2.87)#67 |
| 68. | Farmington | 2.96% | 0.029%(+2.93)#1 | 0.11%(+2.85)#68 |
| 69. | Lorton | 2.95% | 0.46%(+2.49)#14 | 0.11%(+2.85)#69 |
| 70. | Lake Ridge | 2.94% | 0.46%(+2.48)#15 | 0.11%(+2.84)#70 |
| 71. | Springfield | 2.91% | 0.46%(+2.45)#16 | 0.11%(+2.80)#71 |
| 72. | Maharishi Vedic City | 2.91% | 0.067%(+2.84)#1 | 0.11%(+2.80)#72 |
| 73. | West Springfield | 2.86% | 0.46%(+2.40)#17 | 0.11%(+2.75)#73 |
| 74. | Bull Run | 2.84% | 0.46%(+2.38)#18 | 0.11%(+2.73)#74 |
| 75. | Gwinner | 2.82% | 0.013%(+2.80)#1 | 0.11%(+2.71)#75 |
| 76. | Valrico | 2.75% | 0.024%(+2.72)#1 | 0.11%(+2.64)#76 |
| 77. | Lake Stickney | 2.74% | 0.33%(+2.41)#7 | 0.11%(+2.63)#77 |
| 78. | Aniak | 2.72% | 0.018%(+2.70)#1 | 0.11%(+2.62)#78 |
| 79. | Fairfield | 2.69% | 0.067%(+2.62)#2 | 0.11%(+2.58)#79 |
| 80. | Chester | 2.65% | 0.62%(+2.03)#22 | 0.11%(+2.54)#80 |
| 81. | Chamblee | 2.61% | 0.22%(+2.39)#2 | 0.11%(+2.50)#81 |
| 82. | Magnolia | 2.52% | 0.099%(+2.42)#2 | 0.11%(+2.41)#82 |
| 83. | Timberlake | 2.52% | 0.46%(+2.05)#19 | 0.11%(+2.41)#83 |
| 84. | Colesville | 2.51% | 0.62%(+1.89)#23 | 0.11%(+2.40)#84 |
| 85. | Shoreline | 2.49% | 0.33%(+2.16)#8 | 0.11%(+2.39)#85 |
| 86. | Hilltop | 2.49% | 0.47%(+2.02)#4 | 0.11%(+2.38)#86 |
| 87. | Plymouth | 2.47% | 0.099%(+2.37)#1 | 0.11%(+2.36)#87 |
| 88. | Waite Park | 2.40% | 0.47%(+1.93)#5 | 0.11%(+2.29)#88 |
| 89. | Burke | 2.39% | 0.46%(+1.92)#20 | 0.11%(+2.28)#89 |
| 90. | Baltimore Highlands | 2.38% | 0.62%(+1.76)#24 | 0.11%(+2.27)#90 |
| 91. | Bryn Mawr Skyway | 2.36% | 0.33%(+2.03)#9 | 0.11%(+2.26)#91 |
| 92. | Pebble Creek | 2.32% | 0.024%(+2.30)#2 | 0.11%(+2.22)#92 |
| 93. | Forest Glen | 2.32% | 0.62%(+1.70)#25 | 0.11%(+2.21)#93 |
| 94. | Springdale | 2.30% | 0.097%(+2.20)#4 | 0.11%(+2.19)#94 |
| 95. | Rossville | 2.30% | 0.62%(+1.68)#26 | 0.11%(+2.19)#95 |
| 96. | Tucker | 2.26% | 0.22%(+2.04)#3 | 0.11%(+2.15)#96 |
| 97. | Scottdale | 2.25% | 0.22%(+2.03)#4 | 0.11%(+2.15)#97 |
| 98. | Mancelona | 2.22% | 0.029%(+2.19)#3 | 0.11%(+2.11)#98 |
| 99. | Four Square Mile | 2.16% | 0.22%(+1.94)#2 | 0.11%(+2.05)#99 |
| 100. | Cherry Hill | 2.16% | 0.46%(+1.69)#21 | 0.11%(+2.05)#100 |
Common Questions
What are the Top 10 Cities with the Highest Percentage of Ethiopian Population in the United States?
Top 10 Cities with the Highest Percentage of Ethiopian Population in the United States are:
What city has the Highest Percentage of Ethiopian Population in the United States?
Clarkston has the Highest Percentage of Ethiopian Population in the United States with 16.31%.
What is the Percentage of Ethiopian Population in the United States?
Percentage of Ethiopian Population in the United States is 0.11%.