Cities with the Highest Percentage of Ethiopian Population in Virginia
RELATED REPORTS & OPTIONS
Ethiopian
Virginia
Compare Cities
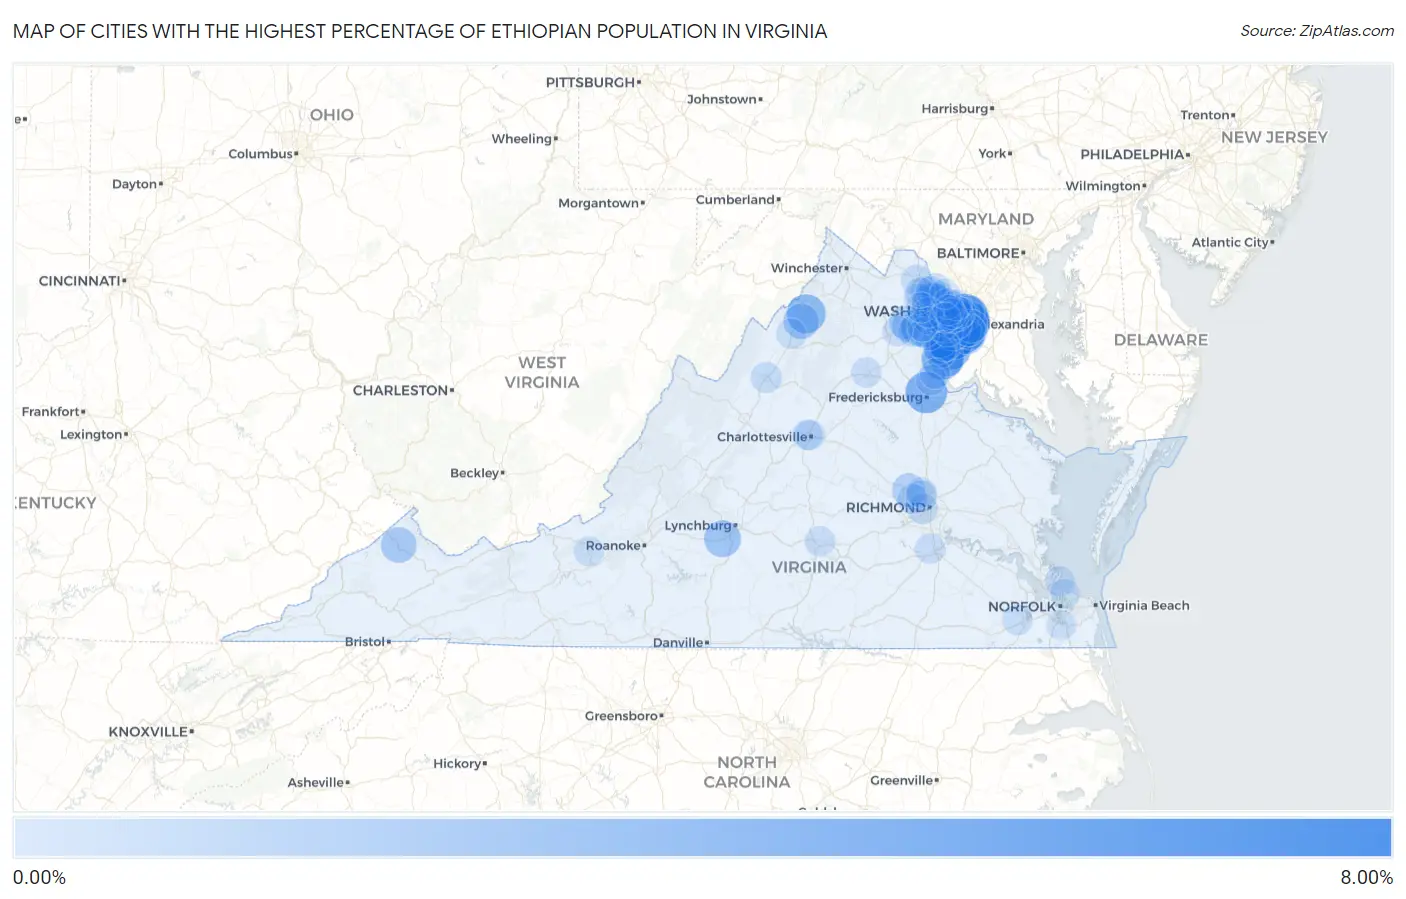
Map of Cities with the Highest Percentage of Ethiopian Population in Virginia
0.00%
8.00%
Cities with the Highest Percentage of Ethiopian Population in Virginia
| City | Ethiopian | vs State | vs National | |
| 1. | Lincolnia | 7.34% | 0.46%(+6.88)#1 | 0.11%(+7.24)#11 |
| 2. | Kingstowne | 6.35% | 0.46%(+5.89)#2 | 0.11%(+6.24)#16 |
| 3. | Bailey S Crossroads | 6.31% | 0.46%(+5.85)#3 | 0.11%(+6.20)#17 |
| 4. | Woodlawn Cdp Fairfax County | 5.50% | 0.46%(+5.03)#4 | 0.11%(+5.39)#22 |
| 5. | Alexandria | 4.52% | 0.46%(+4.06)#5 | 0.11%(+4.41)#31 |
| 6. | Newington | 4.45% | 0.46%(+3.99)#6 | 0.11%(+4.35)#32 |
| 7. | Laurel Hill | 4.44% | 0.46%(+3.98)#7 | 0.11%(+4.34)#33 |
| 8. | Woodbridge | 4.34% | 0.46%(+3.88)#8 | 0.11%(+4.23)#35 |
| 9. | Dumfries | 4.34% | 0.46%(+3.87)#9 | 0.11%(+4.23)#36 |
| 10. | Falmouth | 4.31% | 0.46%(+3.85)#10 | 0.11%(+4.20)#38 |
| 11. | Franconia | 4.03% | 0.46%(+3.57)#11 | 0.11%(+3.92)#41 |
| 12. | Mcnair | 3.59% | 0.46%(+3.13)#12 | 0.11%(+3.48)#48 |
| 13. | Woodstock | 3.31% | 0.46%(+2.85)#13 | 0.11%(+3.20)#53 |
| 14. | Lorton | 2.95% | 0.46%(+2.49)#14 | 0.11%(+2.85)#69 |
| 15. | Lake Ridge | 2.94% | 0.46%(+2.48)#15 | 0.11%(+2.84)#70 |
| 16. | Springfield | 2.91% | 0.46%(+2.45)#16 | 0.11%(+2.80)#71 |
| 17. | West Springfield | 2.86% | 0.46%(+2.40)#17 | 0.11%(+2.75)#73 |
| 18. | Bull Run | 2.84% | 0.46%(+2.38)#18 | 0.11%(+2.73)#74 |
| 19. | Timberlake | 2.52% | 0.46%(+2.05)#19 | 0.11%(+2.41)#83 |
| 20. | Burke | 2.39% | 0.46%(+1.92)#20 | 0.11%(+2.28)#89 |
| 21. | Cherry Hill | 2.16% | 0.46%(+1.69)#21 | 0.11%(+2.05)#100 |
| 22. | Annandale | 2.07% | 0.46%(+1.61)#22 | 0.11%(+1.96)#105 |
| 23. | Grundy | 2.06% | 0.46%(+1.60)#23 | 0.11%(+1.95)#106 |
| 24. | Edinburg | 1.97% | 0.46%(+1.51)#24 | 0.11%(+1.86)#109 |
| 25. | County Center | 1.94% | 0.46%(+1.48)#25 | 0.11%(+1.83)#110 |
| 26. | Seven Corners | 1.49% | 0.46%(+1.03)#26 | 0.11%(+1.38)#147 |
| 27. | Lake Barcroft | 1.44% | 0.46%(+0.974)#27 | 0.11%(+1.33)#157 |
| 28. | Hybla Valley | 1.41% | 0.46%(+0.953)#28 | 0.11%(+1.31)#161 |
| 29. | Haymarket | 1.40% | 0.46%(+0.939)#29 | 0.11%(+1.29)#164 |
| 30. | Short Pump | 1.38% | 0.46%(+0.916)#30 | 0.11%(+1.27)#170 |
| 31. | Fair Oaks | 1.37% | 0.46%(+0.911)#31 | 0.11%(+1.26)#171 |
| 32. | Leesylvania | 1.37% | 0.46%(+0.909)#32 | 0.11%(+1.26)#172 |
| 33. | Arlington | 1.36% | 0.46%(+0.900)#33 | 0.11%(+1.25)#175 |
| 34. | Hayfield | 1.34% | 0.46%(+0.883)#34 | 0.11%(+1.24)#178 |
| 35. | Mount Vernon | 1.33% | 0.46%(+0.870)#35 | 0.11%(+1.22)#179 |
| 36. | Newington Forest | 1.33% | 0.46%(+0.867)#36 | 0.11%(+1.22)#181 |
| 37. | Reston | 1.22% | 0.46%(+0.757)#37 | 0.11%(+1.11)#195 |
| 38. | Oakton | 1.21% | 0.46%(+0.749)#38 | 0.11%(+1.10)#198 |
| 39. | Burke Centre | 1.09% | 0.46%(+0.632)#39 | 0.11%(+0.986)#221 |
| 40. | Huntington | 1.07% | 0.46%(+0.610)#40 | 0.11%(+0.964)#225 |
| 41. | Kings Park West | 1.02% | 0.46%(+0.558)#41 | 0.11%(+0.911)#234 |
| 42. | Dale City | 1.01% | 0.46%(+0.554)#42 | 0.11%(+0.907)#236 |
| 43. | Groveton | 0.89% | 0.46%(+0.428)#43 | 0.11%(+0.782)#267 |
| 44. | Tysons | 0.80% | 0.46%(+0.336)#44 | 0.11%(+0.689)#289 |
| 45. | Herndon | 0.76% | 0.46%(+0.300)#45 | 0.11%(+0.653)#297 |
| 46. | Rose Hill Cdp Fairfax County | 0.76% | 0.46%(+0.298)#46 | 0.11%(+0.652)#298 |
| 47. | West Falls Church | 0.70% | 0.46%(+0.243)#47 | 0.11%(+0.596)#317 |
| 48. | Gainesville | 0.69% | 0.46%(+0.228)#48 | 0.11%(+0.582)#325 |
| 49. | Dumbarton | 0.69% | 0.46%(+0.228)#49 | 0.11%(+0.582)#327 |
| 50. | Montclair | 0.57% | 0.46%(+0.110)#50 | 0.11%(+0.463)#371 |
| 51. | Linton Hall | 0.54% | 0.46%(+0.075)#51 | 0.11%(+0.429)#388 |
| 52. | Dranesville | 0.49% | 0.46%(+0.033)#52 | 0.11%(+0.386)#413 |
| 53. | Cascades | 0.48% | 0.46%(+0.017)#53 | 0.11%(+0.371)#418 |
| 54. | George Mason | 0.46% | 0.46%(-0.002)#54 | 0.11%(+0.352)#426 |
| 55. | Harrisonburg | 0.45% | 0.46%(-0.009)#55 | 0.11%(+0.345)#431 |
| 56. | One Loudoun | 0.43% | 0.46%(-0.029)#56 | 0.11%(+0.325)#444 |
| 57. | Centreville | 0.43% | 0.46%(-0.033)#57 | 0.11%(+0.321)#447 |
| 58. | Idylwood | 0.41% | 0.46%(-0.051)#58 | 0.11%(+0.303)#457 |
| 59. | Buckhall | 0.36% | 0.46%(-0.098)#59 | 0.11%(+0.256)#497 |
| 60. | Richmond | 0.36% | 0.46%(-0.102)#60 | 0.11%(+0.252)#505 |
| 61. | Leesburg | 0.36% | 0.46%(-0.104)#61 | 0.11%(+0.250)#507 |
| 62. | Fairfax Station | 0.33% | 0.46%(-0.127)#62 | 0.11%(+0.227)#532 |
| 63. | Hutchison | 0.33% | 0.46%(-0.130)#63 | 0.11%(+0.224)#536 |
| 64. | North Springfield | 0.32% | 0.46%(-0.143)#64 | 0.11%(+0.211)#550 |
| 65. | Fair Lakes | 0.30% | 0.46%(-0.158)#65 | 0.11%(+0.195)#564 |
| 66. | Charlottesville | 0.29% | 0.46%(-0.169)#66 | 0.11%(+0.184)#582 |
| 67. | Stafford Courthouse | 0.28% | 0.46%(-0.181)#67 | 0.11%(+0.173)#602 |
| 68. | South Run | 0.27% | 0.46%(-0.187)#68 | 0.11%(+0.167)#609 |
| 69. | Falls Church | 0.25% | 0.46%(-0.207)#69 | 0.11%(+0.147)#632 |
| 70. | Manassas | 0.25% | 0.46%(-0.208)#70 | 0.11%(+0.146)#633 |
| 71. | Woodburn | 0.25% | 0.46%(-0.210)#71 | 0.11%(+0.144)#635 |
| 72. | Brambleton | 0.25% | 0.46%(-0.215)#72 | 0.11%(+0.138)#639 |
| 73. | Ashburn | 0.24% | 0.46%(-0.219)#73 | 0.11%(+0.135)#648 |
| 74. | Suffolk | 0.24% | 0.46%(-0.223)#74 | 0.11%(+0.131)#655 |
| 75. | Tuckahoe | 0.23% | 0.46%(-0.232)#75 | 0.11%(+0.122)#671 |
| 76. | Dulles Town Center | 0.22% | 0.46%(-0.240)#76 | 0.11%(+0.114)#687 |
| 77. | Mount Jackson | 0.22% | 0.46%(-0.243)#77 | 0.11%(+0.111)#694 |
| 78. | New Baltimore | 0.20% | 0.46%(-0.265)#78 | 0.11%(+0.089)#738 |
| 79. | Culpeper | 0.19% | 0.46%(-0.267)#79 | 0.11%(+0.087)#742 |
| 80. | Sudley | 0.19% | 0.46%(-0.269)#80 | 0.11%(+0.085)#748 |
| 81. | Wolf Trap | 0.19% | 0.46%(-0.270)#81 | 0.11%(+0.084)#752 |
| 82. | Merrifield | 0.19% | 0.46%(-0.270)#82 | 0.11%(+0.083)#754 |
| 83. | Mclean | 0.19% | 0.46%(-0.275)#83 | 0.11%(+0.078)#764 |
| 84. | Farmville | 0.16% | 0.46%(-0.304)#84 | 0.11%(+0.050)#823 |
| 85. | Chantilly | 0.16% | 0.46%(-0.305)#85 | 0.11%(+0.049)#827 |
| 86. | University Of Virginia | 0.16% | 0.46%(-0.305)#86 | 0.11%(+0.048)#828 |
| 87. | Aquia Harbour | 0.14% | 0.46%(-0.317)#87 | 0.11%(+0.037)#853 |
| 88. | Hampton | 0.14% | 0.46%(-0.319)#88 | 0.11%(+0.035)#861 |
| 89. | Ettrick | 0.14% | 0.46%(-0.319)#89 | 0.11%(+0.035)#862 |
| 90. | Broadlands | 0.13% | 0.46%(-0.331)#90 | 0.11%(+0.023)#899 |
| 91. | Potomac Mills | 0.12% | 0.46%(-0.338)#91 | 0.11%(+0.016)#925 |
| 92. | Laurel | 0.12% | 0.46%(-0.342)#92 | 0.11%(+0.012)#937 |
| 93. | South Riding | 0.10% | 0.46%(-0.359)#93 | 0.11%(-0.005)#991 |
| 94. | Vienna | 0.098% | 0.46%(-0.363)#94 | 0.11%(-0.010)#1,004 |
| 95. | Woodlawn Cdp Carroll County | 0.088% | 0.46%(-0.373)#95 | 0.11%(-0.019)#1,045 |
| 96. | Norfolk | 0.088% | 0.46%(-0.373)#96 | 0.11%(-0.019)#1,046 |
| 97. | Great Falls | 0.087% | 0.46%(-0.374)#97 | 0.11%(-0.020)#1,050 |
| 98. | Blacksburg | 0.082% | 0.46%(-0.379)#98 | 0.11%(-0.025)#1,069 |
| 99. | Chesapeake | 0.079% | 0.46%(-0.382)#99 | 0.11%(-0.028)#1,088 |
| 100. | Fairfax | 0.074% | 0.46%(-0.387)#100 | 0.11%(-0.033)#1,106 |
Common Questions
What are the Top 10 Cities with the Highest Percentage of Ethiopian Population in Virginia?
Top 10 Cities with the Highest Percentage of Ethiopian Population in Virginia are:
#1
7.34%
#2
6.35%
#3
6.31%
#4
4.52%
#5
4.45%
#6
4.44%
#7
4.34%
#8
4.34%
#9
4.31%
#10
4.03%
What city has the Highest Percentage of Ethiopian Population in Virginia?
Lincolnia has the Highest Percentage of Ethiopian Population in Virginia with 7.34%.
What is the Percentage of Ethiopian Population in the State of Virginia?
Percentage of Ethiopian Population in Virginia is 0.46%.
What is the Percentage of Ethiopian Population in the United States?
Percentage of Ethiopian Population in the United States is 0.11%.