Cities with the Highest Percentage of Population Employed in Agriculture, Fishing & Hunting in Pennsylvania
RELATED REPORTS & OPTIONS
Agriculture, Fishing & Hunting
Pennsylvania
Compare Cities
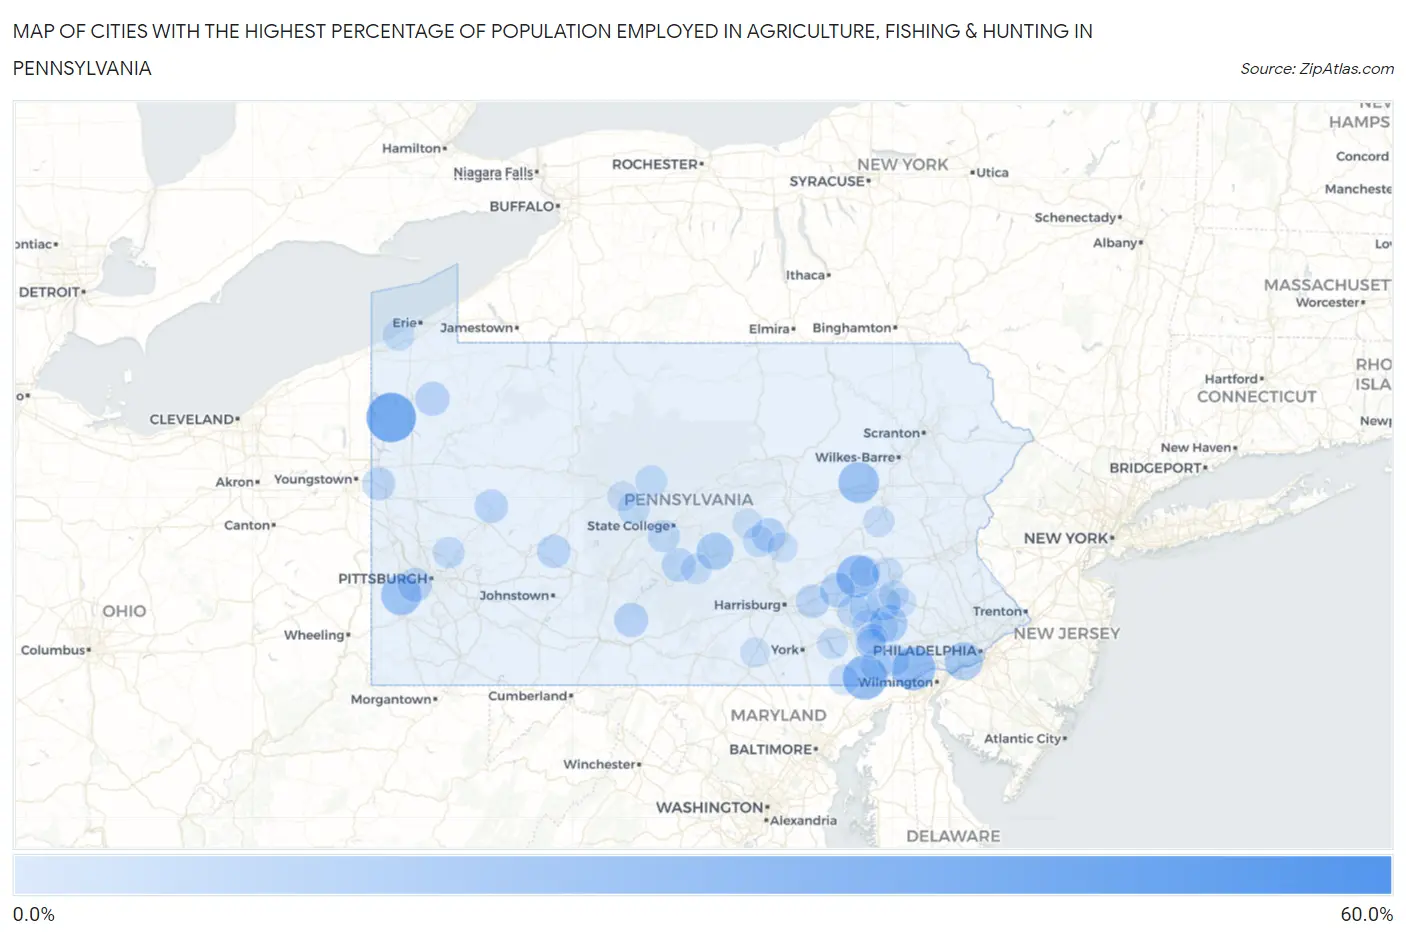
Map of Cities with the Highest Percentage of Population Employed in Agriculture, Fishing & Hunting in Pennsylvania
0.0%
60.0%
Cities with the Highest Percentage of Population Employed in Agriculture, Fishing & Hunting in Pennsylvania
| City | % Employed | vs State | vs National | |
| 1. | Clappertown | 56.0% | 0.87%(+55.1)#1 | 1.2%(+54.8)#162 |
| 2. | Curryville | 45.0% | 0.87%(+44.1)#2 | 1.2%(+43.8)#239 |
| 3. | Atlantic | 37.5% | 0.87%(+36.6)#3 | 1.2%(+36.3)#344 |
| 4. | Avondale Borough | 33.0% | 0.87%(+32.1)#4 | 1.2%(+31.8)#440 |
| 5. | Gray | 32.9% | 0.87%(+32.0)#5 | 1.2%(+31.7)#443 |
| 6. | Wakefield | 28.3% | 0.87%(+27.5)#6 | 1.2%(+27.1)#589 |
| 7. | Toughkenamon | 26.6% | 0.87%(+25.7)#7 | 1.2%(+25.4)#663 |
| 8. | Newburg Borough Cumberland County | 25.2% | 0.87%(+24.3)#8 | 1.2%(+24.0)#711 |
| 9. | Rehrersburg | 25.2% | 0.87%(+24.3)#9 | 1.2%(+24.0)#712 |
| 10. | Foundryville | 22.2% | 0.87%(+21.4)#10 | 1.2%(+21.0)#861 |
| 11. | Southview | 21.4% | 0.87%(+20.5)#11 | 1.2%(+20.2)#918 |
| 12. | Cherry Valley Borough | 20.8% | 0.87%(+20.0)#12 | 1.2%(+19.6)#946 |
| 13. | New Columbus Borough | 19.5% | 0.87%(+18.6)#13 | 1.2%(+18.3)#1,051 |
| 14. | Prospect Park | 17.5% | 0.87%(+16.6)#14 | 1.2%(+16.3)#1,209 |
| 15. | Larke | 16.7% | 0.87%(+15.8)#15 | 1.2%(+15.5)#1,303 |
| 16. | Churchtown | 16.4% | 0.87%(+15.5)#16 | 1.2%(+15.2)#1,332 |
| 17. | York Springs Borough | 16.2% | 0.87%(+15.3)#17 | 1.2%(+15.0)#1,358 |
| 18. | Maitland | 15.9% | 0.87%(+15.1)#18 | 1.2%(+14.7)#1,388 |
| 19. | Kennett Square Borough | 13.1% | 0.87%(+12.2)#19 | 1.2%(+11.9)#1,737 |
| 20. | Sand Hill | 12.4% | 0.87%(+11.6)#20 | 1.2%(+11.2)#1,848 |
| 21. | Oswayo Borough | 12.0% | 0.87%(+11.1)#21 | 1.2%(+10.8)#1,922 |
| 22. | Blooming Valley Borough | 11.9% | 0.87%(+11.0)#22 | 1.2%(+10.7)#1,942 |
| 23. | Saltillo Borough | 11.8% | 0.87%(+11.0)#23 | 1.2%(+10.6)#1,945 |
| 24. | Shellytown | 11.8% | 0.87%(+10.9)#24 | 1.2%(+10.6)#1,963 |
| 25. | York Haven Borough | 11.6% | 0.87%(+10.7)#25 | 1.2%(+10.4)#2,007 |
| 26. | Hartleton Borough | 11.5% | 0.87%(+10.6)#26 | 1.2%(+10.3)#2,040 |
| 27. | East Sharpsburg | 11.4% | 0.87%(+10.5)#27 | 1.2%(+10.2)#2,052 |
| 28. | Defiance | 11.3% | 0.87%(+10.5)#28 | 1.2%(+10.1)#2,064 |
| 29. | Guys Mills | 10.9% | 0.87%(+10.1)#29 | 1.2%(+9.74)#2,164 |
| 30. | Rennerdale | 10.8% | 0.87%(+9.98)#30 | 1.2%(+9.65)#2,188 |
| 31. | Mount Pleasant Mills | 10.8% | 0.87%(+9.96)#31 | 1.2%(+9.63)#2,195 |
| 32. | Gouglersville | 10.6% | 0.87%(+9.78)#32 | 1.2%(+9.45)#2,247 |
| 33. | Allensville | 10.4% | 0.87%(+9.50)#33 | 1.2%(+9.17)#2,321 |
| 34. | Hershey | 10.2% | 0.87%(+9.32)#34 | 1.2%(+8.99)#2,389 |
| 35. | Heilwood | 10.1% | 0.87%(+9.22)#35 | 1.2%(+8.89)#2,406 |
| 36. | Templeton | 10.1% | 0.87%(+9.22)#36 | 1.2%(+8.88)#2,408 |
| 37. | Frizzleburg | 9.3% | 0.87%(+8.45)#37 | 1.2%(+8.12)#2,651 |
| 38. | Cochranville | 8.8% | 0.87%(+7.96)#38 | 1.2%(+7.62)#2,825 |
| 39. | Shirleysburg Borough | 8.8% | 0.87%(+7.90)#39 | 1.2%(+7.57)#2,849 |
| 40. | Yellow Springs | 8.7% | 0.87%(+7.83)#40 | 1.2%(+7.50)#2,875 |
| 41. | Brickerville | 8.5% | 0.87%(+7.68)#41 | 1.2%(+7.35)#2,935 |
| 42. | Ramblewood | 8.2% | 0.87%(+7.29)#42 | 1.2%(+6.95)#3,087 |
| 43. | West Grove Borough | 8.1% | 0.87%(+7.27)#43 | 1.2%(+6.94)#3,089 |
| 44. | Sylvania Borough | 8.0% | 0.87%(+7.18)#44 | 1.2%(+6.85)#3,125 |
| 45. | Little Meadows Borough | 7.8% | 0.87%(+6.90)#45 | 1.2%(+6.57)#3,228 |
| 46. | Berrysburg Borough | 7.7% | 0.87%(+6.88)#46 | 1.2%(+6.55)#3,234 |
| 47. | Starrucca Borough | 7.7% | 0.87%(+6.83)#47 | 1.2%(+6.49)#3,264 |
| 48. | North Philipsburg | 7.6% | 0.87%(+6.78)#48 | 1.2%(+6.45)#3,301 |
| 49. | Gratz Borough | 7.6% | 0.87%(+6.71)#49 | 1.2%(+6.38)#3,320 |
| 50. | Russellton | 7.3% | 0.87%(+6.43)#50 | 1.2%(+6.10)#3,444 |
| 51. | Burlington Borough | 7.2% | 0.87%(+6.38)#51 | 1.2%(+6.05)#3,475 |
| 52. | Pine Glen | 7.2% | 0.87%(+6.34)#52 | 1.2%(+6.01)#3,485 |
| 53. | New Paris Borough | 7.1% | 0.87%(+6.28)#53 | 1.2%(+5.94)#3,520 |
| 54. | Avonia | 7.1% | 0.87%(+6.19)#54 | 1.2%(+5.86)#3,572 |
| 55. | Bloomfield Borough | 7.0% | 0.87%(+6.10)#55 | 1.2%(+5.77)#3,618 |
| 56. | Atwood Borough | 6.9% | 0.87%(+6.08)#56 | 1.2%(+5.75)#3,633 |
| 57. | Kirkwood | 6.9% | 0.87%(+6.06)#57 | 1.2%(+5.72)#3,638 |
| 58. | Cochranton Borough | 6.9% | 0.87%(+6.03)#58 | 1.2%(+5.70)#3,652 |
| 59. | Sutersville Borough | 6.9% | 0.87%(+6.01)#59 | 1.2%(+5.68)#3,662 |
| 60. | Richfield | 6.7% | 0.87%(+5.80)#60 | 1.2%(+5.47)#3,758 |
| 61. | Port Royal Borough | 6.4% | 0.87%(+5.55)#61 | 1.2%(+5.21)#3,885 |
| 62. | Shinglehouse Borough | 6.0% | 0.87%(+5.15)#62 | 1.2%(+4.82)#4,109 |
| 63. | Washington Boro | 5.9% | 0.87%(+5.03)#63 | 1.2%(+4.70)#4,172 |
| 64. | Park Crest | 5.8% | 0.87%(+4.96)#64 | 1.2%(+4.63)#4,226 |
| 65. | Gordonville | 5.8% | 0.87%(+4.89)#65 | 1.2%(+4.56)#4,268 |
| 66. | East Earl | 5.7% | 0.87%(+4.82)#66 | 1.2%(+4.48)#4,315 |
| 67. | Dayton Borough | 5.7% | 0.87%(+4.80)#67 | 1.2%(+4.47)#4,330 |
| 68. | Washingtonville Borough | 5.7% | 0.87%(+4.79)#68 | 1.2%(+4.46)#4,334 |
| 69. | Farmersville | 5.6% | 0.87%(+4.71)#69 | 1.2%(+4.38)#4,400 |
| 70. | Strausstown | 5.6% | 0.87%(+4.69)#70 | 1.2%(+4.36)#4,427 |
| 71. | Mohrsville | 5.4% | 0.87%(+4.55)#71 | 1.2%(+4.22)#4,522 |
| 72. | Longfellow | 5.4% | 0.87%(+4.54)#72 | 1.2%(+4.21)#4,533 |
| 73. | Chicora Borough | 5.4% | 0.87%(+4.53)#73 | 1.2%(+4.20)#4,538 |
| 74. | Arendtsville Borough | 5.3% | 0.87%(+4.43)#74 | 1.2%(+4.10)#4,609 |
| 75. | Westfield Borough | 5.2% | 0.87%(+4.34)#75 | 1.2%(+4.01)#4,674 |
| 76. | Fredonia Borough | 5.2% | 0.87%(+4.29)#76 | 1.2%(+3.96)#4,726 |
| 77. | Intercourse | 5.1% | 0.87%(+4.27)#77 | 1.2%(+3.94)#4,735 |
| 78. | Susquehanna Trails | 5.1% | 0.87%(+4.26)#78 | 1.2%(+3.92)#4,749 |
| 79. | Fairchance Borough | 5.1% | 0.87%(+4.21)#79 | 1.2%(+3.88)#4,777 |
| 80. | Bigler | 4.8% | 0.87%(+3.89)#80 | 1.2%(+3.56)#5,026 |
| 81. | Dalmatia | 4.7% | 0.87%(+3.83)#81 | 1.2%(+3.50)#5,088 |
| 82. | Mcclure Borough | 4.6% | 0.87%(+3.76)#82 | 1.2%(+3.43)#5,134 |
| 83. | Roscoe Borough | 4.6% | 0.87%(+3.74)#83 | 1.2%(+3.41)#5,160 |
| 84. | Linesville Borough | 4.6% | 0.87%(+3.74)#84 | 1.2%(+3.40)#5,164 |
| 85. | Clarks Summit Borough | 4.6% | 0.87%(+3.73)#85 | 1.2%(+3.40)#5,168 |
| 86. | Spartansburg Borough | 4.5% | 0.87%(+3.68)#86 | 1.2%(+3.35)#5,209 |
| 87. | Volant Borough | 4.4% | 0.87%(+3.58)#87 | 1.2%(+3.25)#5,318 |
| 88. | Schoeneck | 4.4% | 0.87%(+3.55)#88 | 1.2%(+3.22)#5,333 |
| 89. | Troxelville | 4.4% | 0.87%(+3.53)#89 | 1.2%(+3.20)#5,355 |
| 90. | Heidlersburg | 4.4% | 0.87%(+3.52)#90 | 1.2%(+3.19)#5,364 |
| 91. | Oxford Borough | 4.4% | 0.87%(+3.50)#91 | 1.2%(+3.17)#5,389 |
| 92. | Honesdale Borough | 4.4% | 0.87%(+3.49)#92 | 1.2%(+3.16)#5,399 |
| 93. | Wheatland Borough | 4.3% | 0.87%(+3.47)#93 | 1.2%(+3.13)#5,440 |
| 94. | Terre Hill Borough | 4.3% | 0.87%(+3.40)#94 | 1.2%(+3.07)#5,495 |
| 95. | West Brownsville Borough | 4.3% | 0.87%(+3.40)#95 | 1.2%(+3.06)#5,501 |
| 96. | Paradise | 4.2% | 0.87%(+3.37)#96 | 1.2%(+3.04)#5,518 |
| 97. | Gibraltar | 4.2% | 0.87%(+3.34)#97 | 1.2%(+3.00)#5,540 |
| 98. | Farwell | 4.2% | 0.87%(+3.32)#98 | 1.2%(+2.99)#5,558 |
| 99. | Southmont Borough | 4.2% | 0.87%(+3.32)#99 | 1.2%(+2.98)#5,568 |
| 100. | Reading | 4.2% | 0.87%(+3.28)#100 | 1.2%(+2.95)#5,618 |
Common Questions
What are the Top 10 Cities with the Highest Percentage of Population Employed in Agriculture, Fishing & Hunting in Pennsylvania?
Top 10 Cities with the Highest Percentage of Population Employed in Agriculture, Fishing & Hunting in Pennsylvania are:
#1
37.5%
#2
28.3%
#3
26.6%
#4
25.2%
#5
22.2%
#6
21.4%
#7
17.5%
#8
16.4%
#9
15.9%
#10
12.4%
What city has the Highest Percentage of Population Employed in Agriculture, Fishing & Hunting in Pennsylvania?
Atlantic has the Highest Percentage of Population Employed in Agriculture, Fishing & Hunting in Pennsylvania with 37.5%.
What is the Percentage of Population Employed in Agriculture, Fishing & Hunting in the State of Pennsylvania?
Percentage of Population Employed in Agriculture, Fishing & Hunting in Pennsylvania is 0.87%.
What is the Percentage of Population Employed in Agriculture, Fishing & Hunting in the United States?
Percentage of Population Employed in Agriculture, Fishing & Hunting in the United States is 1.2%.