Zip Codes with the Highest Percentage of Population Employed in Agriculture, Fishing & Hunting in Turlock, CA
RELATED REPORTS & OPTIONS
Agriculture, Fishing & Hunting
Turlock
Compare Zip Codes
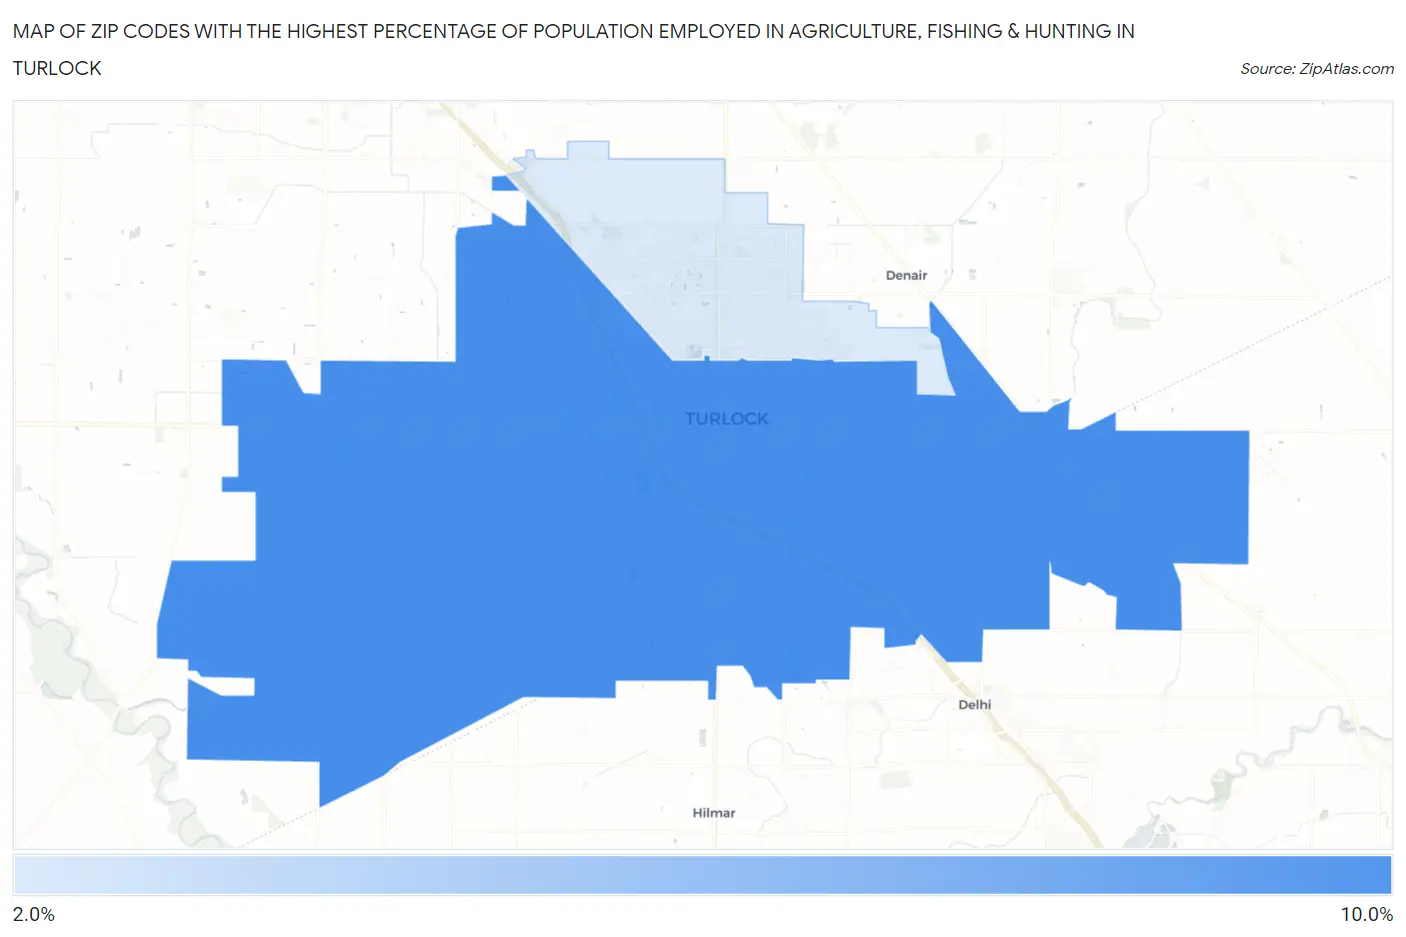
Map of Zip Codes with the Highest Percentage of Population Employed in Agriculture, Fishing & Hunting in Turlock
2.6%
9.6%
Zip Codes with the Highest Percentage of Population Employed in Agriculture, Fishing & Hunting in Turlock, CA
| Zip Code | % Employed | vs State | vs National | |
| 1. | 95380 | 9.6% | 2.0%(+7.58)#268 | 1.2%(+8.37)#4,534 |
| 2. | 95382 | 2.6% | 2.0%(+0.608)#518 | 1.2%(+1.39)#11,372 |
1
Common Questions
What are the Top Zip Codes with the Highest Percentage of Population Employed in Agriculture, Fishing & Hunting in Turlock, CA?
Top Zip Codes with the Highest Percentage of Population Employed in Agriculture, Fishing & Hunting in Turlock, CA are:
What zip code has the Highest Percentage of Population Employed in Agriculture, Fishing & Hunting in Turlock, CA?
95380 has the Highest Percentage of Population Employed in Agriculture, Fishing & Hunting in Turlock, CA with 9.6%.
What is the Percentage of Population Employed in Agriculture, Fishing & Hunting in Turlock, CA?
Percentage of Population Employed in Agriculture, Fishing & Hunting in Turlock is 4.3%.
What is the Percentage of Population Employed in Agriculture, Fishing & Hunting in California?
Percentage of Population Employed in Agriculture, Fishing & Hunting in California is 2.0%.
What is the Percentage of Population Employed in Agriculture, Fishing & Hunting in the United States?
Percentage of Population Employed in Agriculture, Fishing & Hunting in the United States is 1.2%.