Cities with the Highest Percentage of Population Employed in Agriculture, Fishing & Hunting in Connecticut
RELATED REPORTS & OPTIONS
Agriculture, Fishing & Hunting
Connecticut
Compare Cities
Map of Cities with the Highest Percentage of Population Employed in Agriculture, Fishing & Hunting in Connecticut
0.0%
20.0%
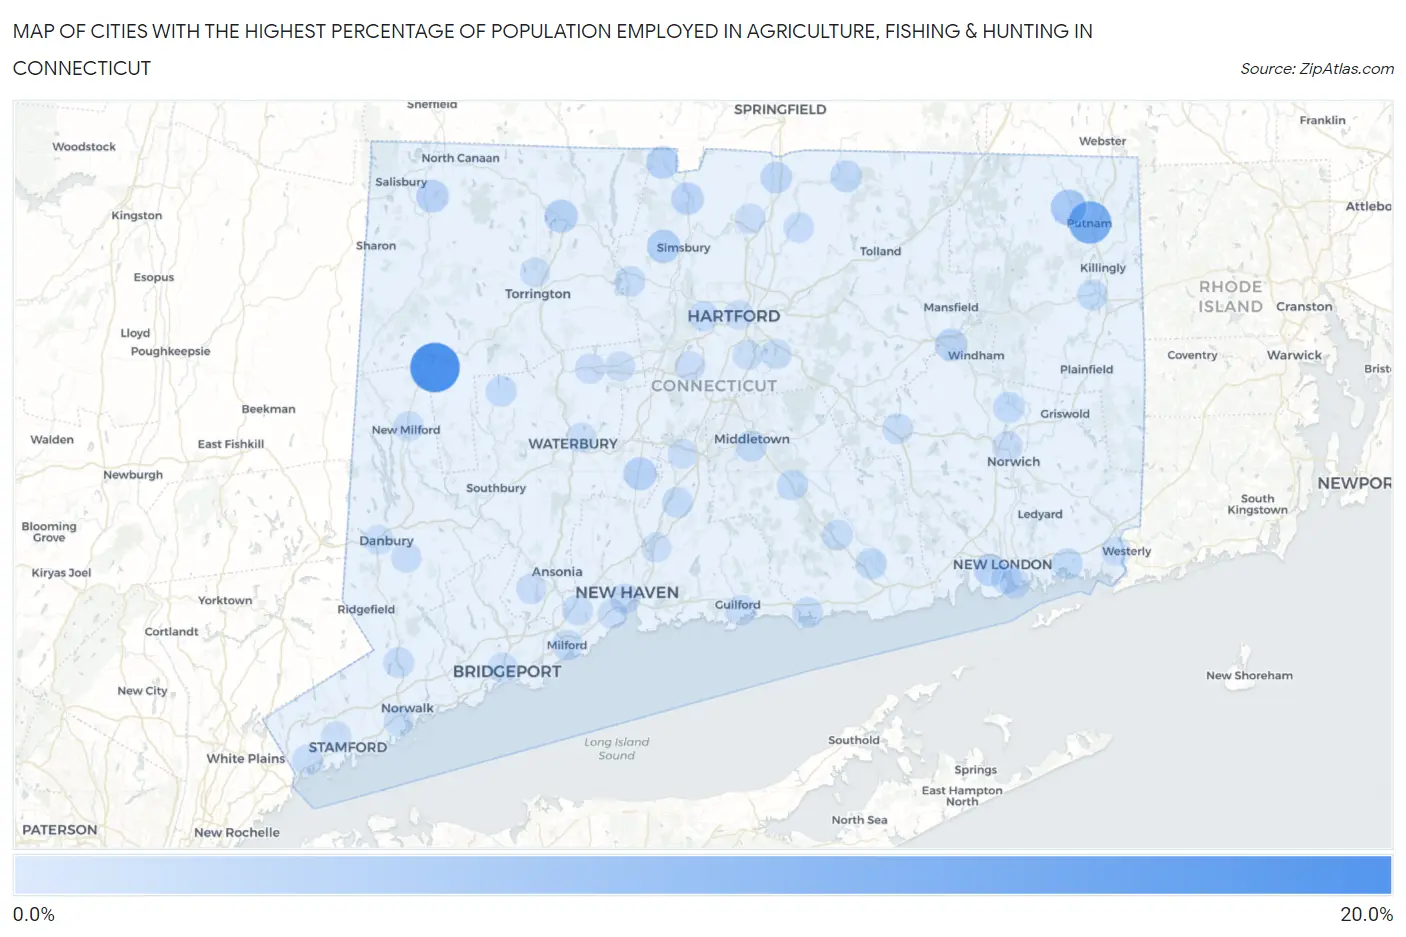
Cities with the Highest Percentage of Population Employed in Agriculture, Fishing & Hunting in Connecticut
| City | % Employed | vs State | vs National | |
| 1. | New Preston | 17.0% | 0.36%(+16.7)#1 | 1.2%(+15.8)#1,261 |
| 2. | Putnam | 10.7% | 0.36%(+10.3)#2 | 1.2%(+9.46)#2,243 |
| 3. | South Woodstock | 4.7% | 0.36%(+4.34)#3 | 1.2%(+3.50)#5,084 |
| 4. | Stonington Borough | 3.3% | 0.36%(+2.98)#4 | 1.2%(+2.14)#6,567 |
| 5. | West Simsbury | 2.8% | 0.36%(+2.46)#5 | 1.2%(+1.62)#7,315 |
| 6. | Lakes East | 2.7% | 0.36%(+2.32)#6 | 1.2%(+1.48)#7,537 |
| 7. | Winsted | 2.6% | 0.36%(+2.27)#7 | 1.2%(+1.43)#7,616 |
| 8. | Cheshire Village | 2.5% | 0.36%(+2.17)#8 | 1.2%(+1.32)#7,801 |
| 9. | Falls Village | 2.3% | 0.36%(+1.93)#9 | 1.2%(+1.08)#8,245 |
| 10. | North Granby | 2.2% | 0.36%(+1.88)#10 | 1.2%(+1.04)#8,353 |
| 11. | Salmon Brook | 2.1% | 0.36%(+1.77)#11 | 1.2%(+0.930)#8,581 |
| 12. | East | 2.1% | 0.36%(+1.71)#12 | 1.2%(+0.864)#8,703 |
| 13. | Willimantic | 2.0% | 0.36%(+1.66)#13 | 1.2%(+0.819)#8,807 |
| 14. | Waterford | 1.9% | 0.36%(+1.56)#14 | 1.2%(+0.713)#9,044 |
| 15. | Oronoque | 1.6% | 0.36%(+1.23)#15 | 1.2%(+0.389)#9,863 |
| 16. | Somers | 1.5% | 0.36%(+1.19)#16 | 1.2%(+0.347)#9,969 |
| 17. | Thompsonville | 1.3% | 0.36%(+0.945)#17 | 1.2%(+0.102)#10,690 |
| 18. | Essex Village | 1.1% | 0.36%(+0.702)#18 | 1.2%(-0.140)#11,557 |
| 19. | Quinnipiac University | 1.0% | 0.36%(+0.652)#19 | 1.2%(-0.191)#11,753 |
| 20. | Baltic | 0.99% | 0.36%(+0.630)#20 | 1.2%(-0.213)#11,842 |
| 21. | Daniels Farm | 0.98% | 0.36%(+0.627)#21 | 1.2%(-0.216)#11,853 |
| 22. | Wallingford Center | 0.87% | 0.36%(+0.513)#22 | 1.2%(-0.329)#12,307 |
| 23. | Higganum | 0.86% | 0.36%(+0.502)#23 | 1.2%(-0.341)#12,358 |
| 24. | Middletown | 0.81% | 0.36%(+0.454)#24 | 1.2%(-0.388)#12,572 |
| 25. | Westport | 0.80% | 0.36%(+0.439)#25 | 1.2%(-0.404)#12,627 |
| 26. | Plattsville | 0.79% | 0.36%(+0.435)#26 | 1.2%(-0.408)#12,646 |
| 27. | Bethlehem Village | 0.76% | 0.36%(+0.403)#27 | 1.2%(-0.439)#12,788 |
| 28. | East Brooklyn | 0.74% | 0.36%(+0.382)#28 | 1.2%(-0.461)#12,895 |
| 29. | Mystic | 0.73% | 0.36%(+0.377)#29 | 1.2%(-0.466)#12,922 |
| 30. | Wilton Center | 0.70% | 0.36%(+0.346)#30 | 1.2%(-0.497)#13,083 |
| 31. | Chester Center | 0.70% | 0.36%(+0.344)#31 | 1.2%(-0.498)#13,092 |
| 32. | Northford | 0.65% | 0.36%(+0.296)#32 | 1.2%(-0.547)#13,353 |
| 33. | Milford City Balance | 0.64% | 0.36%(+0.281)#33 | 1.2%(-0.561)#13,441 |
| 34. | Bantam Borough | 0.58% | 0.36%(+0.221)#34 | 1.2%(-0.621)#13,803 |
| 35. | Collinsville | 0.57% | 0.36%(+0.215)#35 | 1.2%(-0.627)#13,835 |
| 36. | Clinton | 0.56% | 0.36%(+0.203)#36 | 1.2%(-0.639)#13,916 |
| 37. | Noroton | 0.55% | 0.36%(+0.198)#37 | 1.2%(-0.645)#13,951 |
| 38. | Old Hill | 0.55% | 0.36%(+0.194)#38 | 1.2%(-0.649)#13,974 |
| 39. | Colchester | 0.53% | 0.36%(+0.170)#39 | 1.2%(-0.672)#14,116 |
| 40. | Orange | 0.52% | 0.36%(+0.164)#40 | 1.2%(-0.678)#14,146 |
| 41. | Noroton Heights | 0.47% | 0.36%(+0.118)#41 | 1.2%(-0.725)#14,438 |
| 42. | Broad Brook | 0.43% | 0.36%(+0.074)#42 | 1.2%(-0.768)#14,691 |
| 43. | Guilford Center | 0.43% | 0.36%(+0.072)#43 | 1.2%(-0.771)#14,713 |
| 44. | New Milford | 0.42% | 0.36%(+0.063)#44 | 1.2%(-0.780)#14,775 |
| 45. | Norwich | 0.40% | 0.36%(+0.040)#45 | 1.2%(-0.802)#14,911 |
| 46. | Bethel | 0.38% | 0.36%(+0.024)#46 | 1.2%(-0.819)#15,009 |
| 47. | Shelton | 0.36% | 0.36%(+0.005)#47 | 1.2%(-0.838)#15,147 |
| 48. | Greenwich | 0.32% | 0.36%(-0.039)#48 | 1.2%(-0.881)#15,481 |
| 49. | New Haven | 0.30% | 0.36%(-0.054)#49 | 1.2%(-0.897)#15,595 |
| 50. | West Hartford | 0.30% | 0.36%(-0.062)#50 | 1.2%(-0.904)#15,641 |
| 51. | New London | 0.24% | 0.36%(-0.117)#51 | 1.2%(-0.960)#16,042 |
| 52. | New Britain | 0.23% | 0.36%(-0.127)#52 | 1.2%(-0.970)#16,114 |
| 53. | Windsor Locks | 0.23% | 0.36%(-0.132)#53 | 1.2%(-0.974)#16,148 |
| 54. | Glastonbury Center | 0.20% | 0.36%(-0.158)#54 | 1.2%(-1.00)#16,345 |
| 55. | Sandy Hook | 0.19% | 0.36%(-0.165)#55 | 1.2%(-1.01)#16,382 |
| 56. | Terryville | 0.18% | 0.36%(-0.177)#56 | 1.2%(-1.02)#16,444 |
| 57. | Norwalk | 0.17% | 0.36%(-0.183)#57 | 1.2%(-1.03)#16,497 |
| 58. | Bridgeport | 0.15% | 0.36%(-0.203)#58 | 1.2%(-1.05)#16,637 |
| 59. | Naugatuck Borough | 0.15% | 0.36%(-0.205)#59 | 1.2%(-1.05)#16,658 |
| 60. | North Haven | 0.13% | 0.36%(-0.224)#60 | 1.2%(-1.07)#16,784 |
| 61. | Danbury | 0.12% | 0.36%(-0.239)#61 | 1.2%(-1.08)#16,865 |
| 62. | Groton | 0.11% | 0.36%(-0.243)#62 | 1.2%(-1.09)#16,886 |
| 63. | Waterbury | 0.087% | 0.36%(-0.270)#63 | 1.2%(-1.11)#17,021 |
| 64. | Hartford | 0.086% | 0.36%(-0.271)#64 | 1.2%(-1.11)#17,026 |
| 65. | Stamford | 0.086% | 0.36%(-0.271)#65 | 1.2%(-1.11)#17,027 |
| 66. | West Haven | 0.077% | 0.36%(-0.280)#66 | 1.2%(-1.12)#17,076 |
| 67. | Meriden | 0.067% | 0.36%(-0.290)#67 | 1.2%(-1.13)#17,124 |
| 68. | Bristol | 0.064% | 0.36%(-0.293)#68 | 1.2%(-1.14)#17,139 |
| 69. | Pawcatuck | 0.036% | 0.36%(-0.321)#69 | 1.2%(-1.16)#17,257 |
| 70. | Torrington | 0.033% | 0.36%(-0.324)#70 | 1.2%(-1.17)#17,265 |
| 71. | Wethersfield | 0.021% | 0.36%(-0.336)#71 | 1.2%(-1.18)#17,290 |
Common Questions
What are the Top 10 Cities with the Highest Percentage of Population Employed in Agriculture, Fishing & Hunting in Connecticut?
Top 10 Cities with the Highest Percentage of Population Employed in Agriculture, Fishing & Hunting in Connecticut are:
#1
17.0%
#2
10.7%
#3
4.7%
#4
2.8%
#5
2.6%
#6
2.5%
#7
2.3%
#8
2.2%
#9
2.1%
#10
2.0%
What city has the Highest Percentage of Population Employed in Agriculture, Fishing & Hunting in Connecticut?
New Preston has the Highest Percentage of Population Employed in Agriculture, Fishing & Hunting in Connecticut with 17.0%.
What is the Percentage of Population Employed in Agriculture, Fishing & Hunting in the State of Connecticut?
Percentage of Population Employed in Agriculture, Fishing & Hunting in Connecticut is 0.36%.
What is the Percentage of Population Employed in Agriculture, Fishing & Hunting in the United States?
Percentage of Population Employed in Agriculture, Fishing & Hunting in the United States is 1.2%.