Cities with the Highest Percentage of Population Employed in Agriculture, Fishing & Hunting in Idaho
RELATED REPORTS & OPTIONS
Agriculture, Fishing & Hunting
Idaho
Compare Cities
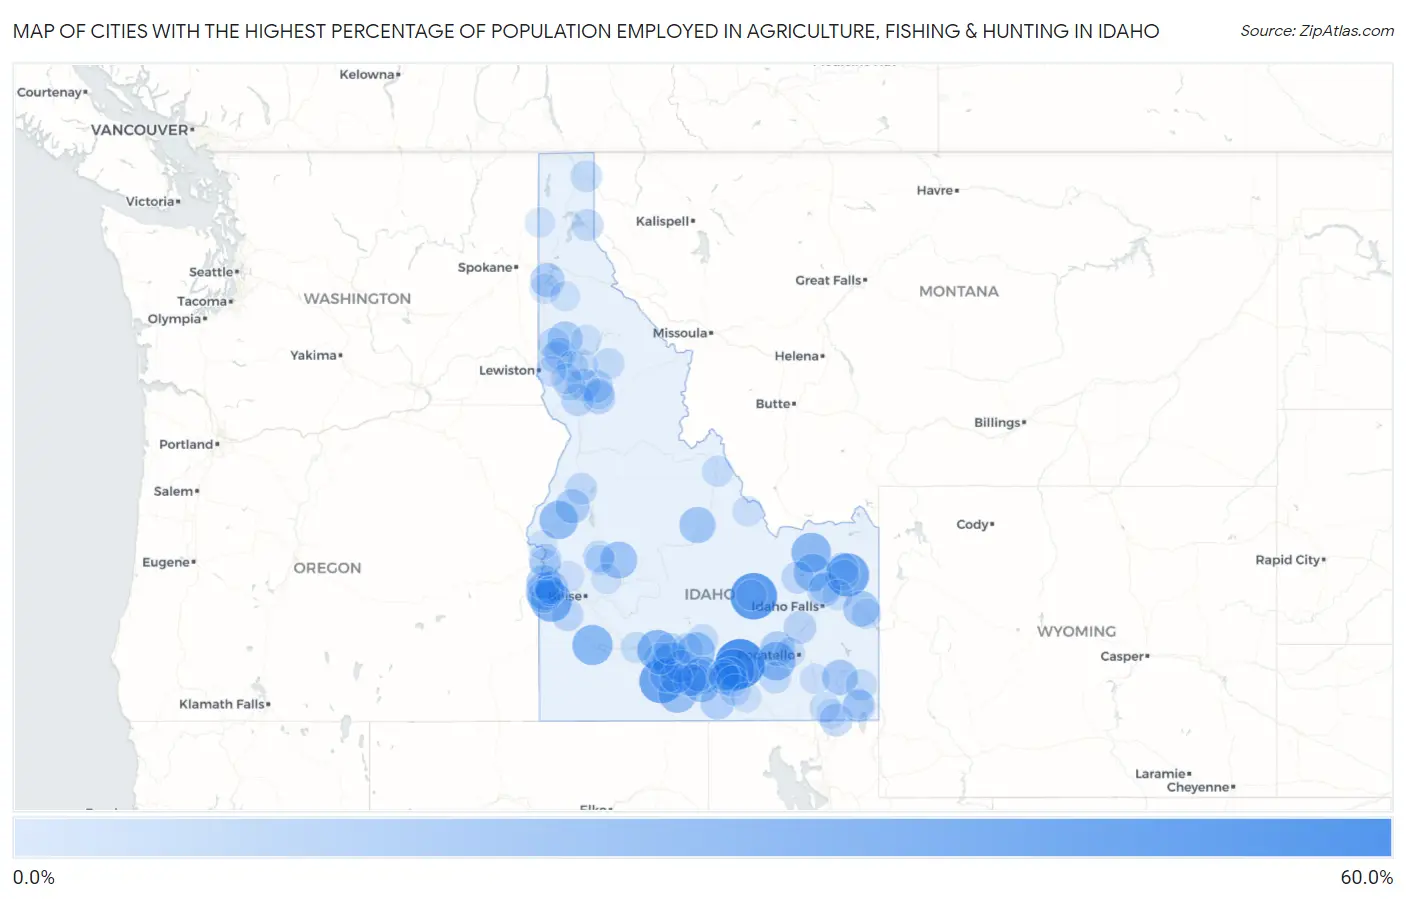
Map of Cities with the Highest Percentage of Population Employed in Agriculture, Fishing & Hunting in Idaho
0.0%
60.0%
Cities with the Highest Percentage of Population Employed in Agriculture, Fishing & Hunting in Idaho
| City | % Employed | vs State | vs National | |
| 1. | Minidoka | 56.0% | 3.9%(+52.1)#1 | 1.2%(+54.8)#161 |
| 2. | Butte City | 48.1% | 3.9%(+44.2)#2 | 1.2%(+46.9)#220 |
| 3. | Castleford | 41.0% | 3.9%(+37.1)#3 | 1.2%(+39.8)#289 |
| 4. | Newdale | 39.0% | 3.9%(+35.1)#4 | 1.2%(+37.8)#319 |
| 5. | Acequia | 35.0% | 3.9%(+31.1)#5 | 1.2%(+33.8)#389 |
| 6. | Marsing | 33.0% | 3.9%(+29.1)#6 | 1.2%(+31.8)#438 |
| 7. | Bliss | 30.9% | 3.9%(+26.9)#7 | 1.2%(+29.7)#497 |
| 8. | Grand View | 30.5% | 3.9%(+26.5)#8 | 1.2%(+29.3)#520 |
| 9. | Dubois | 28.9% | 3.9%(+25.0)#9 | 1.2%(+27.7)#560 |
| 10. | Cambridge | 25.7% | 3.9%(+21.8)#10 | 1.2%(+24.5)#695 |
| 11. | American Falls | 25.7% | 3.9%(+21.8)#11 | 1.2%(+24.5)#698 |
| 12. | Hollister | 25.0% | 3.9%(+21.1)#12 | 1.2%(+23.8)#715 |
| 13. | Wilder | 24.0% | 3.9%(+20.0)#13 | 1.2%(+22.8)#769 |
| 14. | Wendell | 23.6% | 3.9%(+19.7)#14 | 1.2%(+22.4)#785 |
| 15. | Hamer | 23.5% | 3.9%(+19.6)#15 | 1.2%(+22.3)#791 |
| 16. | Dietrich | 23.4% | 3.9%(+19.5)#16 | 1.2%(+22.2)#796 |
| 17. | Hazelton | 23.3% | 3.9%(+19.4)#17 | 1.2%(+22.1)#805 |
| 18. | Lowman | 21.4% | 3.9%(+17.5)#18 | 1.2%(+20.2)#917 |
| 19. | Murtaugh | 21.3% | 3.9%(+17.4)#19 | 1.2%(+20.1)#924 |
| 20. | Bruneau | 20.8% | 3.9%(+16.9)#20 | 1.2%(+19.6)#948 |
| 21. | Challis | 19.8% | 3.9%(+15.9)#21 | 1.2%(+18.6)#1,027 |
| 22. | Swan Valley | 18.9% | 3.9%(+15.0)#22 | 1.2%(+17.7)#1,094 |
| 23. | Grace | 18.3% | 3.9%(+14.4)#23 | 1.2%(+17.1)#1,134 |
| 24. | Deary | 16.6% | 3.9%(+12.7)#24 | 1.2%(+15.4)#1,315 |
| 25. | Buhl | 16.3% | 3.9%(+12.4)#25 | 1.2%(+15.1)#1,345 |
| 26. | Aberdeen | 16.1% | 3.9%(+12.2)#26 | 1.2%(+14.9)#1,364 |
| 27. | Parma | 15.7% | 3.9%(+11.8)#27 | 1.2%(+14.5)#1,410 |
| 28. | Council | 15.0% | 3.9%(+11.1)#28 | 1.2%(+13.8)#1,481 |
| 29. | Oakley | 14.3% | 3.9%(+10.4)#29 | 1.2%(+13.1)#1,565 |
| 30. | Rockford Bay | 14.1% | 3.9%(+10.2)#30 | 1.2%(+12.9)#1,593 |
| 31. | Lewisville | 12.9% | 3.9%(+9.00)#31 | 1.2%(+11.7)#1,766 |
| 32. | Homedale | 12.6% | 3.9%(+8.68)#32 | 1.2%(+11.4)#1,813 |
| 33. | Rupert | 12.6% | 3.9%(+8.66)#33 | 1.2%(+11.4)#1,816 |
| 34. | Notus | 12.1% | 3.9%(+8.18)#34 | 1.2%(+10.9)#1,905 |
| 35. | Hansen | 11.8% | 3.9%(+7.88)#35 | 1.2%(+10.6)#1,953 |
| 36. | Stites | 11.5% | 3.9%(+7.63)#36 | 1.2%(+10.3)#2,020 |
| 37. | Kamiah | 11.1% | 3.9%(+7.20)#37 | 1.2%(+9.91)#2,111 |
| 38. | Jerome | 11.0% | 3.9%(+7.13)#38 | 1.2%(+9.84)#2,141 |
| 39. | Eden | 11.0% | 3.9%(+7.12)#39 | 1.2%(+9.82)#2,144 |
| 40. | Moreland | 10.9% | 3.9%(+6.99)#40 | 1.2%(+9.70)#2,176 |
| 41. | Franklin | 10.8% | 3.9%(+6.93)#41 | 1.2%(+9.64)#2,194 |
| 42. | Nezperce | 10.8% | 3.9%(+6.85)#42 | 1.2%(+9.56)#2,215 |
| 43. | Heyburn | 10.6% | 3.9%(+6.74)#43 | 1.2%(+9.44)#2,248 |
| 44. | Kimberly | 10.4% | 3.9%(+6.49)#44 | 1.2%(+9.20)#2,306 |
| 45. | Payette | 10.3% | 3.9%(+6.36)#45 | 1.2%(+9.07)#2,356 |
| 46. | Bloomington | 10.0% | 3.9%(+6.09)#46 | 1.2%(+8.80)#2,430 |
| 47. | Hammett | 9.8% | 3.9%(+5.87)#47 | 1.2%(+8.58)#2,496 |
| 48. | St Anthony | 9.7% | 3.9%(+5.76)#48 | 1.2%(+8.47)#2,530 |
| 49. | Cottonwood | 9.7% | 3.9%(+5.75)#49 | 1.2%(+8.46)#2,532 |
| 50. | Mud Lake | 9.4% | 3.9%(+5.52)#50 | 1.2%(+8.22)#2,610 |
| 51. | Juliaetta | 9.4% | 3.9%(+5.48)#51 | 1.2%(+8.19)#2,624 |
| 52. | Melba | 9.2% | 3.9%(+5.30)#52 | 1.2%(+8.01)#2,692 |
| 53. | Kendrick | 9.0% | 3.9%(+5.11)#53 | 1.2%(+7.82)#2,768 |
| 54. | New Meadows | 8.8% | 3.9%(+4.94)#54 | 1.2%(+7.64)#2,818 |
| 55. | Clark Fork | 8.8% | 3.9%(+4.91)#55 | 1.2%(+7.62)#2,834 |
| 56. | Rockland | 8.8% | 3.9%(+4.86)#56 | 1.2%(+7.57)#2,850 |
| 57. | Filer | 8.8% | 3.9%(+4.85)#57 | 1.2%(+7.56)#2,853 |
| 58. | Hagerman | 8.7% | 3.9%(+4.81)#58 | 1.2%(+7.51)#2,867 |
| 59. | Troy | 8.6% | 3.9%(+4.74)#59 | 1.2%(+7.45)#2,900 |
| 60. | Gooding | 8.2% | 3.9%(+4.33)#60 | 1.2%(+7.04)#3,053 |
| 61. | Moyie Springs | 7.9% | 3.9%(+4.01)#61 | 1.2%(+6.72)#3,167 |
| 62. | Richfield | 7.5% | 3.9%(+3.58)#62 | 1.2%(+6.29)#3,365 |
| 63. | Paul | 7.5% | 3.9%(+3.58)#63 | 1.2%(+6.28)#3,368 |
| 64. | Albion | 7.5% | 3.9%(+3.58)#64 | 1.2%(+6.28)#3,370 |
| 65. | Georgetown | 7.3% | 3.9%(+3.38)#65 | 1.2%(+6.09)#3,449 |
| 66. | Pierce | 7.3% | 3.9%(+3.38)#66 | 1.2%(+6.09)#3,452 |
| 67. | Peck | 7.2% | 3.9%(+3.34)#67 | 1.2%(+6.05)#3,474 |
| 68. | Crouch | 7.2% | 3.9%(+3.30)#68 | 1.2%(+6.01)#3,486 |
| 69. | Declo | 7.2% | 3.9%(+3.30)#69 | 1.2%(+6.00)#3,489 |
| 70. | Shoshone | 7.2% | 3.9%(+3.29)#70 | 1.2%(+6.00)#3,492 |
| 71. | Glenns Ferry | 7.1% | 3.9%(+3.21)#71 | 1.2%(+5.92)#3,552 |
| 72. | Menan | 7.0% | 3.9%(+3.07)#72 | 1.2%(+5.78)#3,607 |
| 73. | Teton | 6.7% | 3.9%(+2.76)#73 | 1.2%(+5.47)#3,750 |
| 74. | Kooskia | 6.7% | 3.9%(+2.76)#74 | 1.2%(+5.47)#3,752 |
| 75. | Craigmont | 6.6% | 3.9%(+2.73)#75 | 1.2%(+5.44)#3,787 |
| 76. | Salmon | 6.5% | 3.9%(+2.58)#76 | 1.2%(+5.29)#3,850 |
| 77. | Orofino | 6.1% | 3.9%(+2.19)#77 | 1.2%(+4.90)#4,056 |
| 78. | Arco | 5.9% | 3.9%(+2.02)#78 | 1.2%(+4.73)#4,160 |
| 79. | Clifton | 5.9% | 3.9%(+1.99)#79 | 1.2%(+4.70)#4,171 |
| 80. | Reubens | 5.9% | 3.9%(+1.97)#80 | 1.2%(+4.68)#4,199 |
| 81. | Fruitland | 5.9% | 3.9%(+1.96)#81 | 1.2%(+4.67)#4,206 |
| 82. | Ririe | 5.5% | 3.9%(+1.61)#82 | 1.2%(+4.32)#4,457 |
| 83. | Emmett | 5.4% | 3.9%(+1.50)#83 | 1.2%(+4.20)#4,535 |
| 84. | Lapwai | 5.2% | 3.9%(+1.31)#84 | 1.2%(+4.02)#4,666 |
| 85. | Worley | 5.2% | 3.9%(+1.31)#85 | 1.2%(+4.02)#4,667 |
| 86. | Leadore | 5.2% | 3.9%(+1.26)#86 | 1.2%(+3.97)#4,710 |
| 87. | Arbon Valley | 5.0% | 3.9%(+1.14)#87 | 1.2%(+3.85)#4,808 |
| 88. | Garden Valley | 4.8% | 3.9%(+0.925)#88 | 1.2%(+3.63)#4,976 |
| 89. | Irwin | 4.8% | 3.9%(+0.854)#89 | 1.2%(+3.56)#5,034 |
| 90. | Idaho City | 4.7% | 3.9%(+0.822)#90 | 1.2%(+3.53)#5,064 |
| 91. | Arimo | 4.7% | 3.9%(+0.822)#91 | 1.2%(+3.53)#5,065 |
| 92. | Elk River | 4.6% | 3.9%(+0.708)#92 | 1.2%(+3.42)#5,150 |
| 93. | Paris | 4.6% | 3.9%(+0.676)#93 | 1.2%(+3.38)#5,177 |
| 94. | Gannett | 4.5% | 3.9%(+0.638)#94 | 1.2%(+3.35)#5,207 |
| 95. | Malta | 4.5% | 3.9%(+0.638)#95 | 1.2%(+3.35)#5,208 |
| 96. | St Maries | 4.4% | 3.9%(+0.484)#96 | 1.2%(+3.19)#5,361 |
| 97. | Preston | 4.3% | 3.9%(+0.399)#97 | 1.2%(+3.11)#5,467 |
| 98. | Greenleaf | 4.3% | 3.9%(+0.396)#98 | 1.2%(+3.10)#5,472 |
| 99. | Oldtown | 4.1% | 3.9%(+0.237)#99 | 1.2%(+2.95)#5,622 |
| 100. | Weiser | 4.1% | 3.9%(+0.210)#100 | 1.2%(+2.92)#5,652 |
Common Questions
What are the Top 10 Cities with the Highest Percentage of Population Employed in Agriculture, Fishing & Hunting in Idaho?
Top 10 Cities with the Highest Percentage of Population Employed in Agriculture, Fishing & Hunting in Idaho are:
#1
56.0%
#2
48.1%
#3
41.0%
#4
39.0%
#5
35.0%
#6
33.0%
#7
30.9%
#8
30.5%
#9
28.9%
#10
25.7%
What city has the Highest Percentage of Population Employed in Agriculture, Fishing & Hunting in Idaho?
Minidoka has the Highest Percentage of Population Employed in Agriculture, Fishing & Hunting in Idaho with 56.0%.
What is the Percentage of Population Employed in Agriculture, Fishing & Hunting in the State of Idaho?
Percentage of Population Employed in Agriculture, Fishing & Hunting in Idaho is 3.9%.
What is the Percentage of Population Employed in Agriculture, Fishing & Hunting in the United States?
Percentage of Population Employed in Agriculture, Fishing & Hunting in the United States is 1.2%.