Cities with the Highest Percentage of Population Employed in Agriculture, Fishing & Hunting in Utah
RELATED REPORTS & OPTIONS
Agriculture, Fishing & Hunting
Utah
Compare Cities
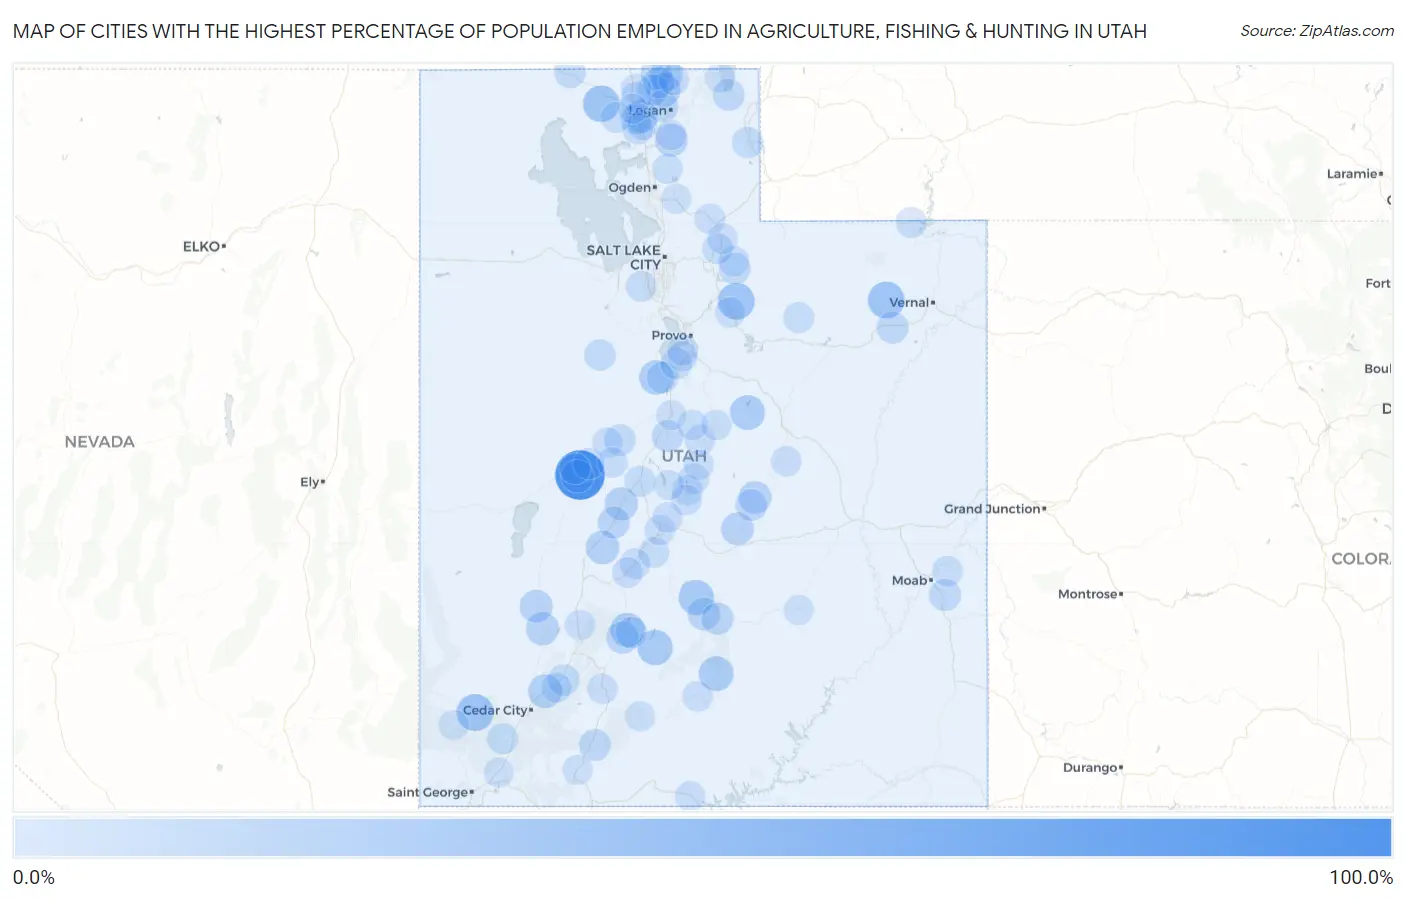
Map of Cities with the Highest Percentage of Population Employed in Agriculture, Fishing & Hunting in Utah
0.0%
100.0%
Cities with the Highest Percentage of Population Employed in Agriculture, Fishing & Hunting in Utah
| City | % Employed | vs State | vs National | |
| 1. | Oasis | 100.0% | 0.72%(+99.3)#1 | 1.2%(+98.8)#34 |
| 2. | Newcastle | 35.6% | 0.72%(+34.9)#2 | 1.2%(+34.4)#375 |
| 3. | Whiterocks | 34.6% | 0.72%(+33.9)#3 | 1.2%(+33.4)#393 |
| 4. | Timber Lakes | 34.5% | 0.72%(+33.8)#4 | 1.2%(+33.3)#396 |
| 5. | Howell | 33.5% | 0.72%(+32.8)#5 | 1.2%(+32.3)#411 |
| 6. | Antimony | 27.6% | 0.72%(+26.9)#6 | 1.2%(+26.4)#614 |
| 7. | Fremont | 26.7% | 0.72%(+25.9)#7 | 1.2%(+25.5)#659 |
| 8. | Scofield | 25.0% | 0.72%(+24.3)#8 | 1.2%(+23.8)#727 |
| 9. | Boulder | 24.8% | 0.72%(+24.1)#9 | 1.2%(+23.6)#734 |
| 10. | Elberta | 22.7% | 0.72%(+21.9)#10 | 1.2%(+21.5)#833 |
| 11. | Junction | 22.2% | 0.72%(+21.5)#11 | 1.2%(+21.0)#856 |
| 12. | Summit | 20.0% | 0.72%(+19.3)#12 | 1.2%(+18.8)#1,004 |
| 13. | Kanosh | 18.9% | 0.72%(+18.2)#13 | 1.2%(+17.7)#1,095 |
| 14. | Amalga | 18.8% | 0.72%(+18.1)#14 | 1.2%(+17.6)#1,102 |
| 15. | Holden | 17.9% | 0.72%(+17.1)#15 | 1.2%(+16.7)#1,176 |
| 16. | Minersville | 16.9% | 0.72%(+16.2)#16 | 1.2%(+15.7)#1,271 |
| 17. | Deweyville | 16.6% | 0.72%(+15.8)#17 | 1.2%(+15.4)#1,319 |
| 18. | Avon | 16.4% | 0.72%(+15.6)#18 | 1.2%(+15.2)#1,334 |
| 19. | Lewiston | 16.2% | 0.72%(+15.5)#19 | 1.2%(+15.0)#1,350 |
| 20. | Milford | 16.0% | 0.72%(+15.3)#20 | 1.2%(+14.8)#1,380 |
| 21. | Emery | 15.4% | 0.72%(+14.7)#21 | 1.2%(+14.2)#1,435 |
| 22. | Clawson | 15.4% | 0.72%(+14.7)#22 | 1.2%(+14.2)#1,446 |
| 23. | Deseret | 14.9% | 0.72%(+14.2)#23 | 1.2%(+13.7)#1,491 |
| 24. | Bicknell | 13.8% | 0.72%(+13.1)#24 | 1.2%(+12.6)#1,626 |
| 25. | Circleville | 13.2% | 0.72%(+12.5)#25 | 1.2%(+12.0)#1,717 |
| 26. | Torrey | 11.6% | 0.72%(+10.9)#26 | 1.2%(+10.4)#2,000 |
| 27. | Fillmore | 11.6% | 0.72%(+10.8)#27 | 1.2%(+10.4)#2,014 |
| 28. | Alton | 11.3% | 0.72%(+10.5)#28 | 1.2%(+10.1)#2,079 |
| 29. | Benson | 11.2% | 0.72%(+10.5)#29 | 1.2%(+10.0)#2,086 |
| 30. | Ferron | 11.2% | 0.72%(+10.4)#30 | 1.2%(+9.96)#2,104 |
| 31. | Fort Duchesne | 11.1% | 0.72%(+10.4)#31 | 1.2%(+9.91)#2,113 |
| 32. | Spanish Valley | 11.0% | 0.72%(+10.3)#32 | 1.2%(+9.82)#2,146 |
| 33. | Cornish | 10.4% | 0.72%(+9.71)#33 | 1.2%(+9.24)#2,296 |
| 34. | Goshen | 10.4% | 0.72%(+9.65)#34 | 1.2%(+9.18)#2,316 |
| 35. | Laketown | 10.3% | 0.72%(+9.53)#35 | 1.2%(+9.06)#2,358 |
| 36. | Levan | 10.0% | 0.72%(+9.28)#36 | 1.2%(+8.80)#2,421 |
| 37. | Newton | 9.9% | 0.72%(+9.20)#37 | 1.2%(+8.73)#2,456 |
| 38. | Marion | 9.6% | 0.72%(+8.86)#38 | 1.2%(+8.38)#2,557 |
| 39. | Kingston | 9.3% | 0.72%(+8.62)#39 | 1.2%(+8.15)#2,642 |
| 40. | Trenton | 9.3% | 0.72%(+8.61)#40 | 1.2%(+8.13)#2,646 |
| 41. | Leamington | 8.7% | 0.72%(+8.01)#41 | 1.2%(+7.53)#2,860 |
| 42. | Paragonah | 8.5% | 0.72%(+7.78)#42 | 1.2%(+7.30)#2,952 |
| 43. | Snowville | 8.5% | 0.72%(+7.75)#43 | 1.2%(+7.28)#2,960 |
| 44. | Vernon | 8.4% | 0.72%(+7.71)#44 | 1.2%(+7.23)#2,983 |
| 45. | West Mountain | 8.2% | 0.72%(+7.48)#45 | 1.2%(+7.00)#3,064 |
| 46. | Elwood | 8.1% | 0.72%(+7.34)#46 | 1.2%(+6.87)#3,117 |
| 47. | Delta | 8.0% | 0.72%(+7.24)#47 | 1.2%(+6.76)#3,151 |
| 48. | Woodruff | 8.0% | 0.72%(+7.23)#48 | 1.2%(+6.76)#3,156 |
| 49. | Scipio | 7.0% | 0.72%(+6.24)#49 | 1.2%(+5.77)#3,621 |
| 50. | New Harmony | 6.8% | 0.72%(+6.13)#50 | 1.2%(+5.65)#3,679 |
| 51. | Bear River City | 6.5% | 0.72%(+5.75)#51 | 1.2%(+5.27)#3,860 |
| 52. | Castle Valley | 6.4% | 0.72%(+5.69)#52 | 1.2%(+5.22)#3,883 |
| 53. | Tabiona | 6.2% | 0.72%(+5.53)#53 | 1.2%(+5.05)#3,973 |
| 54. | Glenwood | 6.1% | 0.72%(+5.41)#54 | 1.2%(+4.93)#4,036 |
| 55. | Manila | 5.7% | 0.72%(+4.95)#55 | 1.2%(+4.47)#4,326 |
| 56. | Thatcher | 5.6% | 0.72%(+4.92)#56 | 1.2%(+4.45)#4,343 |
| 57. | Lake Shore | 5.6% | 0.72%(+4.86)#57 | 1.2%(+4.38)#4,403 |
| 58. | Riverside | 5.5% | 0.72%(+4.82)#58 | 1.2%(+4.35)#4,443 |
| 59. | Elsinore | 5.3% | 0.72%(+4.58)#59 | 1.2%(+4.11)#4,604 |
| 60. | Oakley | 5.3% | 0.72%(+4.58)#60 | 1.2%(+4.10)#4,610 |
| 61. | Wanship | 5.2% | 0.72%(+4.49)#61 | 1.2%(+4.01)#4,675 |
| 62. | Hinckley | 5.2% | 0.72%(+4.48)#62 | 1.2%(+4.00)#4,680 |
| 63. | Manti | 5.1% | 0.72%(+4.39)#63 | 1.2%(+3.91)#4,754 |
| 64. | Copperton | 5.1% | 0.72%(+4.34)#64 | 1.2%(+3.86)#4,798 |
| 65. | Henefer | 5.0% | 0.72%(+4.30)#65 | 1.2%(+3.83)#4,824 |
| 66. | Joseph | 4.9% | 0.72%(+4.15)#66 | 1.2%(+3.67)#4,942 |
| 67. | Sterling | 4.8% | 0.72%(+4.04)#67 | 1.2%(+3.56)#5,029 |
| 68. | Hoytsville | 4.6% | 0.72%(+3.92)#68 | 1.2%(+3.44)#5,130 |
| 69. | Moroni | 4.6% | 0.72%(+3.91)#69 | 1.2%(+3.43)#5,133 |
| 70. | Beaver | 4.6% | 0.72%(+3.89)#70 | 1.2%(+3.41)#5,153 |
| 71. | Fountain Green | 4.6% | 0.72%(+3.86)#71 | 1.2%(+3.38)#5,176 |
| 72. | Mayfield | 4.6% | 0.72%(+3.85)#72 | 1.2%(+3.37)#5,188 |
| 73. | Richmond | 4.5% | 0.72%(+3.76)#73 | 1.2%(+3.29)#5,276 |
| 74. | Elmo | 4.3% | 0.72%(+3.59)#74 | 1.2%(+3.12)#5,456 |
| 75. | Independence | 4.2% | 0.72%(+3.44)#75 | 1.2%(+2.97)#5,600 |
| 76. | Escalante | 4.1% | 0.72%(+3.39)#76 | 1.2%(+2.92)#5,653 |
| 77. | Lynndyl | 4.0% | 0.72%(+3.28)#77 | 1.2%(+2.80)#5,768 |
| 78. | Panguitch | 3.9% | 0.72%(+3.21)#78 | 1.2%(+2.73)#5,843 |
| 79. | Aurora | 3.9% | 0.72%(+3.19)#79 | 1.2%(+2.71)#5,865 |
| 80. | Liberty | 3.9% | 0.72%(+3.18)#80 | 1.2%(+2.71)#5,871 |
| 81. | Fayette | 3.7% | 0.72%(+3.03)#81 | 1.2%(+2.55)#6,056 |
| 82. | Parowan | 3.7% | 0.72%(+2.99)#82 | 1.2%(+2.52)#6,093 |
| 83. | Oak City | 3.7% | 0.72%(+2.98)#83 | 1.2%(+2.50)#6,104 |
| 84. | Benjamin | 3.6% | 0.72%(+2.90)#84 | 1.2%(+2.42)#6,236 |
| 85. | Big Water | 3.6% | 0.72%(+2.89)#85 | 1.2%(+2.42)#6,244 |
| 86. | Fairview | 3.6% | 0.72%(+2.88)#86 | 1.2%(+2.41)#6,255 |
| 87. | Redmond | 3.6% | 0.72%(+2.85)#87 | 1.2%(+2.37)#6,281 |
| 88. | Honeyville | 3.5% | 0.72%(+2.73)#88 | 1.2%(+2.25)#6,407 |
| 89. | Orderville | 3.4% | 0.72%(+2.69)#89 | 1.2%(+2.21)#6,481 |
| 90. | Plymouth | 3.3% | 0.72%(+2.59)#90 | 1.2%(+2.12)#6,613 |
| 91. | Garden City | 3.3% | 0.72%(+2.58)#91 | 1.2%(+2.10)#6,631 |
| 92. | Nephi | 3.2% | 0.72%(+2.44)#92 | 1.2%(+1.96)#6,812 |
| 93. | Hanksville | 3.2% | 0.72%(+2.44)#93 | 1.2%(+1.96)#6,815 |
| 94. | Enterprise | 3.0% | 0.72%(+2.30)#94 | 1.2%(+1.82)#7,012 |
| 95. | Garland | 2.9% | 0.72%(+2.18)#95 | 1.2%(+1.71)#7,179 |
| 96. | Mountain Green | 2.9% | 0.72%(+2.17)#96 | 1.2%(+1.69)#7,203 |
| 97. | Leeds | 2.9% | 0.72%(+2.13)#97 | 1.2%(+1.66)#7,247 |
| 98. | Tropic | 2.8% | 0.72%(+2.05)#98 | 1.2%(+1.58)#7,370 |
| 99. | Ephraim | 2.7% | 0.72%(+1.95)#99 | 1.2%(+1.47)#7,542 |
| 100. | Paradise | 2.6% | 0.72%(+1.89)#100 | 1.2%(+1.42)#7,635 |
Common Questions
What are the Top 10 Cities with the Highest Percentage of Population Employed in Agriculture, Fishing & Hunting in Utah?
Top 10 Cities with the Highest Percentage of Population Employed in Agriculture, Fishing & Hunting in Utah are:
#1
100.0%
#2
35.6%
#3
34.6%
#4
34.5%
#5
33.5%
#6
27.6%
#7
26.7%
#8
25.0%
#9
24.8%
#10
22.7%
What city has the Highest Percentage of Population Employed in Agriculture, Fishing & Hunting in Utah?
Oasis has the Highest Percentage of Population Employed in Agriculture, Fishing & Hunting in Utah with 100.0%.
What is the Percentage of Population Employed in Agriculture, Fishing & Hunting in the State of Utah?
Percentage of Population Employed in Agriculture, Fishing & Hunting in Utah is 0.72%.
What is the Percentage of Population Employed in Agriculture, Fishing & Hunting in the United States?
Percentage of Population Employed in Agriculture, Fishing & Hunting in the United States is 1.2%.