Cities with the Highest Percentage of Population Employed in Agriculture, Fishing & Hunting in Virginia
RELATED REPORTS & OPTIONS
Agriculture, Fishing & Hunting
Virginia
Compare Cities
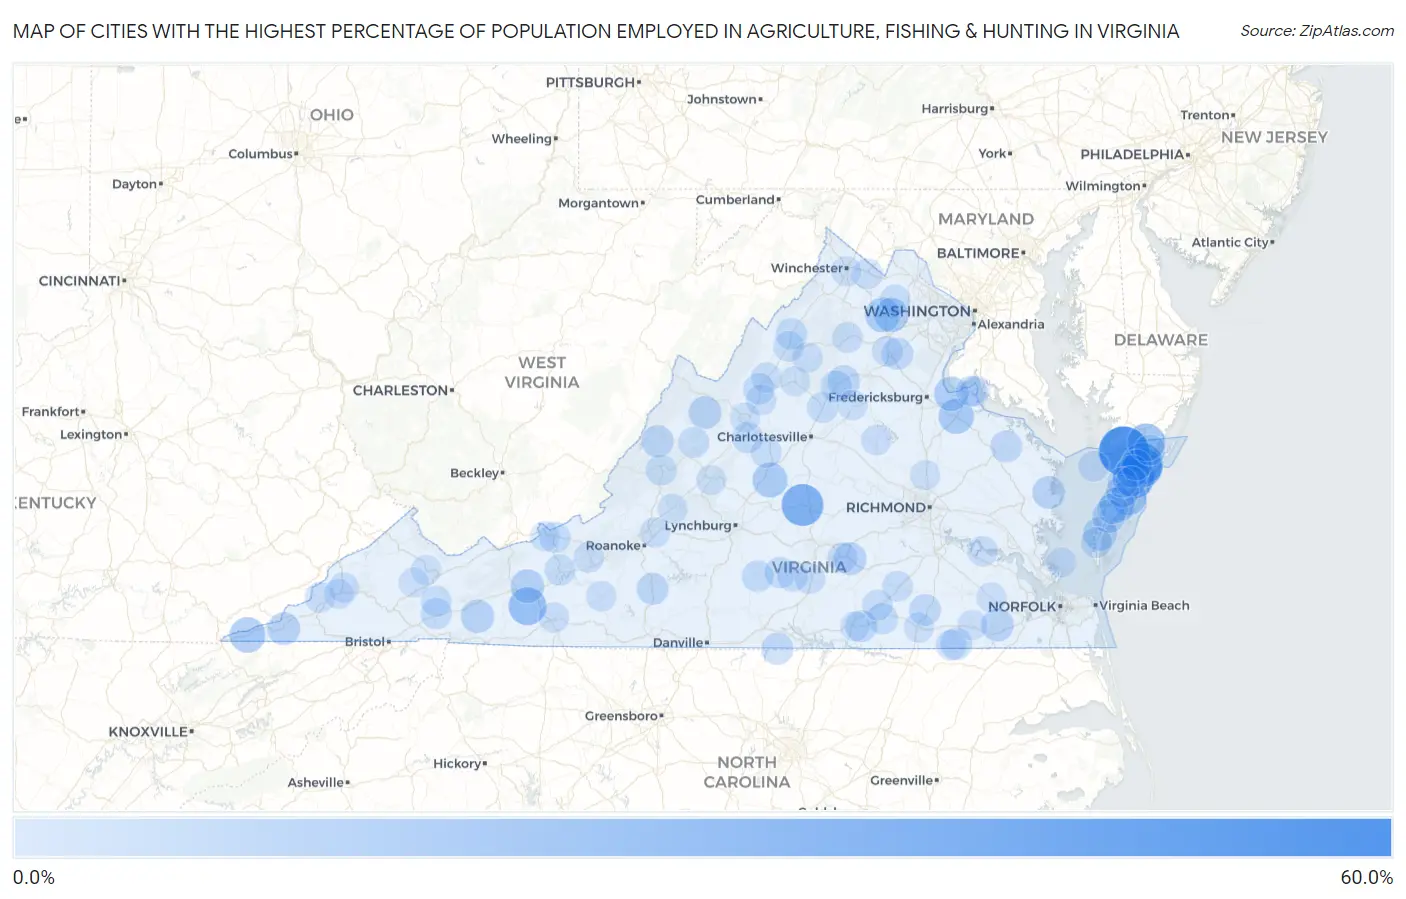
Map of Cities with the Highest Percentage of Population Employed in Agriculture, Fishing & Hunting in Virginia
0.0%
60.0%
Cities with the Highest Percentage of Population Employed in Agriculture, Fishing & Hunting in Virginia
| City | % Employed | vs State | vs National | |
| 1. | Saxis | 50.5% | 0.69%(+49.8)#1 | 1.2%(+49.3)#193 |
| 2. | Osaka | 36.4% | 0.69%(+35.7)#2 | 1.2%(+35.2)#363 |
| 3. | Buckingham Courthouse | 30.2% | 0.69%(+29.5)#3 | 1.2%(+29.0)#528 |
| 4. | Pastoria | 29.9% | 0.69%(+29.2)#4 | 1.2%(+28.7)#535 |
| 5. | Mappsville | 28.9% | 0.69%(+28.2)#5 | 1.2%(+27.7)#561 |
| 6. | Modest Town | 24.7% | 0.69%(+24.1)#6 | 1.2%(+23.5)#736 |
| 7. | Ivanhoe | 20.3% | 0.69%(+19.6)#7 | 1.2%(+19.1)#984 |
| 8. | New Church | 20.2% | 0.69%(+19.5)#8 | 1.2%(+19.0)#991 |
| 9. | Ewing | 14.5% | 0.69%(+13.8)#9 | 1.2%(+13.3)#1,541 |
| 10. | Wachapreague | 14.3% | 0.69%(+13.6)#10 | 1.2%(+13.1)#1,566 |
| 11. | Port Royal | 13.8% | 0.69%(+13.1)#11 | 1.2%(+12.6)#1,629 |
| 12. | Cats Bridge | 13.6% | 0.69%(+12.9)#12 | 1.2%(+12.4)#1,663 |
| 13. | Shipman | 13.1% | 0.69%(+12.4)#13 | 1.2%(+11.9)#1,740 |
| 14. | Marshall | 12.6% | 0.69%(+11.9)#14 | 1.2%(+11.4)#1,817 |
| 15. | Fairview Beach | 11.5% | 0.69%(+10.8)#15 | 1.2%(+10.3)#2,029 |
| 16. | The Plains | 11.4% | 0.69%(+10.7)#16 | 1.2%(+10.2)#2,048 |
| 17. | Eastville | 10.7% | 0.69%(+10.0)#17 | 1.2%(+9.51)#2,227 |
| 18. | Max Meadows | 9.9% | 0.69%(+9.22)#18 | 1.2%(+8.71)#2,461 |
| 19. | Stewartsville | 9.8% | 0.69%(+9.11)#19 | 1.2%(+8.59)#2,492 |
| 20. | Sugar Grove | 8.8% | 0.69%(+8.16)#20 | 1.2%(+7.64)#2,817 |
| 21. | Nassawadox | 8.6% | 0.69%(+7.87)#21 | 1.2%(+7.36)#2,932 |
| 22. | Jonesville | 7.9% | 0.69%(+7.23)#22 | 1.2%(+6.71)#3,173 |
| 23. | Carrsville | 7.8% | 0.69%(+7.13)#23 | 1.2%(+6.61)#3,206 |
| 24. | Crewe | 7.8% | 0.69%(+7.12)#24 | 1.2%(+6.61)#3,213 |
| 25. | Melfa | 7.6% | 0.69%(+6.88)#25 | 1.2%(+6.37)#3,326 |
| 26. | White Stone | 7.5% | 0.69%(+6.86)#26 | 1.2%(+6.35)#3,337 |
| 27. | Deerfield | 7.5% | 0.69%(+6.79)#27 | 1.2%(+6.28)#3,375 |
| 28. | Parksley | 6.6% | 0.69%(+5.89)#28 | 1.2%(+5.38)#3,811 |
| 29. | Brightwood | 6.4% | 0.69%(+5.71)#29 | 1.2%(+5.19)#3,895 |
| 30. | Hot Springs | 6.3% | 0.69%(+5.66)#30 | 1.2%(+5.15)#3,918 |
| 31. | Henry Fork | 5.9% | 0.69%(+5.24)#31 | 1.2%(+4.73)#4,161 |
| 32. | Virgilina | 5.8% | 0.69%(+5.11)#32 | 1.2%(+4.60)#4,244 |
| 33. | Boykins | 5.7% | 0.69%(+5.00)#33 | 1.2%(+4.49)#4,312 |
| 34. | Warsaw | 5.3% | 0.69%(+4.65)#34 | 1.2%(+4.13)#4,585 |
| 35. | Brodnax | 5.3% | 0.69%(+4.58)#35 | 1.2%(+4.06)#4,631 |
| 36. | Midland | 5.1% | 0.69%(+4.44)#36 | 1.2%(+3.93)#4,743 |
| 37. | Jarratt | 5.1% | 0.69%(+4.39)#37 | 1.2%(+3.87)#4,780 |
| 38. | Brookneal | 4.8% | 0.69%(+4.06)#38 | 1.2%(+3.55)#5,049 |
| 39. | Madison | 4.5% | 0.69%(+3.83)#39 | 1.2%(+3.32)#5,242 |
| 40. | Mount Jackson | 4.5% | 0.69%(+3.81)#40 | 1.2%(+3.30)#5,268 |
| 41. | Phenix | 4.0% | 0.69%(+3.29)#41 | 1.2%(+2.77)#5,790 |
| 42. | Pearisburg | 3.9% | 0.69%(+3.24)#42 | 1.2%(+2.73)#5,853 |
| 43. | Glade Spring | 3.8% | 0.69%(+3.10)#43 | 1.2%(+2.58)#6,020 |
| 44. | Stuarts Draft | 3.7% | 0.69%(+2.99)#44 | 1.2%(+2.47)#6,157 |
| 45. | Dublin | 3.6% | 0.69%(+2.92)#45 | 1.2%(+2.41)#6,257 |
| 46. | Mount Crawford | 3.6% | 0.69%(+2.87)#46 | 1.2%(+2.36)#6,307 |
| 47. | Lawrenceville | 3.5% | 0.69%(+2.80)#47 | 1.2%(+2.28)#6,385 |
| 48. | Bloxom | 3.4% | 0.69%(+2.76)#48 | 1.2%(+2.25)#6,422 |
| 49. | Ruckersville | 3.4% | 0.69%(+2.70)#49 | 1.2%(+2.19)#6,496 |
| 50. | Goshen | 3.1% | 0.69%(+2.44)#50 | 1.2%(+1.93)#6,858 |
| 51. | Charlotte Court House | 3.1% | 0.69%(+2.40)#51 | 1.2%(+1.89)#6,921 |
| 52. | Branchville | 3.1% | 0.69%(+2.39)#52 | 1.2%(+1.88)#6,939 |
| 53. | Iron Gate | 3.0% | 0.69%(+2.34)#53 | 1.2%(+1.83)#6,983 |
| 54. | Dahlgren | 3.0% | 0.69%(+2.32)#54 | 1.2%(+1.81)#7,031 |
| 55. | Nellysford | 3.0% | 0.69%(+2.30)#55 | 1.2%(+1.78)#7,070 |
| 56. | Washington | 2.9% | 0.69%(+2.26)#56 | 1.2%(+1.74)#7,136 |
| 57. | Wattsville | 2.9% | 0.69%(+2.22)#57 | 1.2%(+1.71)#7,181 |
| 58. | Cheriton | 2.9% | 0.69%(+2.20)#58 | 1.2%(+1.69)#7,211 |
| 59. | Keysville | 2.8% | 0.69%(+2.16)#59 | 1.2%(+1.65)#7,277 |
| 60. | Opal | 2.8% | 0.69%(+2.08)#60 | 1.2%(+1.57)#7,394 |
| 61. | New Market | 2.8% | 0.69%(+2.07)#61 | 1.2%(+1.55)#7,414 |
| 62. | Tangier | 2.7% | 0.69%(+2.00)#62 | 1.2%(+1.49)#7,519 |
| 63. | Saltville | 2.6% | 0.69%(+1.96)#63 | 1.2%(+1.44)#7,583 |
| 64. | Exmore | 2.6% | 0.69%(+1.94)#64 | 1.2%(+1.42)#7,622 |
| 65. | Middleburg | 2.6% | 0.69%(+1.91)#65 | 1.2%(+1.40)#7,674 |
| 66. | Mckenney | 2.6% | 0.69%(+1.90)#66 | 1.2%(+1.39)#7,688 |
| 67. | Alberta | 2.6% | 0.69%(+1.88)#67 | 1.2%(+1.36)#7,728 |
| 68. | Berryville | 2.4% | 0.69%(+1.71)#68 | 1.2%(+1.20)#8,039 |
| 69. | Appalachia | 2.4% | 0.69%(+1.67)#69 | 1.2%(+1.15)#8,124 |
| 70. | Weyers Cave | 2.3% | 0.69%(+1.64)#70 | 1.2%(+1.13)#8,164 |
| 71. | Burkeville | 2.2% | 0.69%(+1.54)#71 | 1.2%(+1.02)#8,387 |
| 72. | Hillsville | 2.2% | 0.69%(+1.53)#72 | 1.2%(+1.01)#8,409 |
| 73. | Wise | 2.2% | 0.69%(+1.52)#73 | 1.2%(+1.01)#8,418 |
| 74. | Claremont | 2.2% | 0.69%(+1.51)#74 | 1.2%(+0.998)#8,440 |
| 75. | Floyd | 2.2% | 0.69%(+1.50)#75 | 1.2%(+0.990)#8,459 |
| 76. | Merrimac | 2.1% | 0.69%(+1.37)#76 | 1.2%(+0.860)#8,711 |
| 77. | Dahlgren Center | 2.1% | 0.69%(+1.37)#77 | 1.2%(+0.855)#8,718 |
| 78. | Mineral | 2.0% | 0.69%(+1.35)#78 | 1.2%(+0.833)#8,775 |
| 79. | Harrisonburg | 1.9% | 0.69%(+1.25)#79 | 1.2%(+0.732)#8,987 |
| 80. | Stanley | 1.9% | 0.69%(+1.21)#80 | 1.2%(+0.701)#9,075 |
| 81. | Laymantown | 1.9% | 0.69%(+1.20)#81 | 1.2%(+0.687)#9,111 |
| 82. | Orange | 1.9% | 0.69%(+1.17)#82 | 1.2%(+0.661)#9,183 |
| 83. | Winchester | 1.7% | 0.69%(+1.04)#83 | 1.2%(+0.529)#9,489 |
| 84. | Buena Vista | 1.7% | 0.69%(+1.01)#84 | 1.2%(+0.501)#9,559 |
| 85. | Meadowview | 1.7% | 0.69%(+1.01)#85 | 1.2%(+0.496)#9,573 |
| 86. | Onancock | 1.7% | 0.69%(+1.00)#86 | 1.2%(+0.489)#9,589 |
| 87. | Accomac | 1.7% | 0.69%(+0.999)#87 | 1.2%(+0.486)#9,595 |
| 88. | Elkton | 1.6% | 0.69%(+0.961)#88 | 1.2%(+0.448)#9,703 |
| 89. | Ashland | 1.6% | 0.69%(+0.934)#89 | 1.2%(+0.421)#9,766 |
| 90. | Ivor | 1.6% | 0.69%(+0.927)#90 | 1.2%(+0.414)#9,795 |
| 91. | Emporia | 1.6% | 0.69%(+0.916)#91 | 1.2%(+0.402)#9,814 |
| 92. | Raven | 1.6% | 0.69%(+0.876)#92 | 1.2%(+0.363)#9,918 |
| 93. | Honaker | 1.6% | 0.69%(+0.873)#93 | 1.2%(+0.360)#9,929 |
| 94. | Courtland | 1.5% | 0.69%(+0.777)#94 | 1.2%(+0.264)#10,221 |
| 95. | Buchanan | 1.4% | 0.69%(+0.725)#95 | 1.2%(+0.212)#10,365 |
| 96. | Narrows | 1.3% | 0.69%(+0.661)#96 | 1.2%(+0.147)#10,557 |
| 97. | La Crosse | 1.3% | 0.69%(+0.659)#97 | 1.2%(+0.146)#10,563 |
| 98. | Staunton | 1.3% | 0.69%(+0.656)#98 | 1.2%(+0.143)#10,569 |
| 99. | Poquoson | 1.3% | 0.69%(+0.644)#99 | 1.2%(+0.131)#10,607 |
| 100. | Norton | 1.3% | 0.69%(+0.643)#100 | 1.2%(+0.130)#10,609 |
Common Questions
What are the Top 10 Cities with the Highest Percentage of Population Employed in Agriculture, Fishing & Hunting in Virginia?
Top 10 Cities with the Highest Percentage of Population Employed in Agriculture, Fishing & Hunting in Virginia are:
#1
50.5%
#2
30.2%
#3
29.9%
#4
28.9%
#5
24.7%
#6
20.3%
#7
20.2%
#8
14.5%
#9
14.3%
#10
13.8%
What city has the Highest Percentage of Population Employed in Agriculture, Fishing & Hunting in Virginia?
Saxis has the Highest Percentage of Population Employed in Agriculture, Fishing & Hunting in Virginia with 50.5%.
What is the Percentage of Population Employed in Agriculture, Fishing & Hunting in the State of Virginia?
Percentage of Population Employed in Agriculture, Fishing & Hunting in Virginia is 0.69%.
What is the Percentage of Population Employed in Agriculture, Fishing & Hunting in the United States?
Percentage of Population Employed in Agriculture, Fishing & Hunting in the United States is 1.2%.