Cities with the Highest Percentage of Population Employed in Agriculture, Fishing & Hunting in Tennessee
RELATED REPORTS & OPTIONS
Agriculture, Fishing & Hunting
Tennessee
Compare Cities
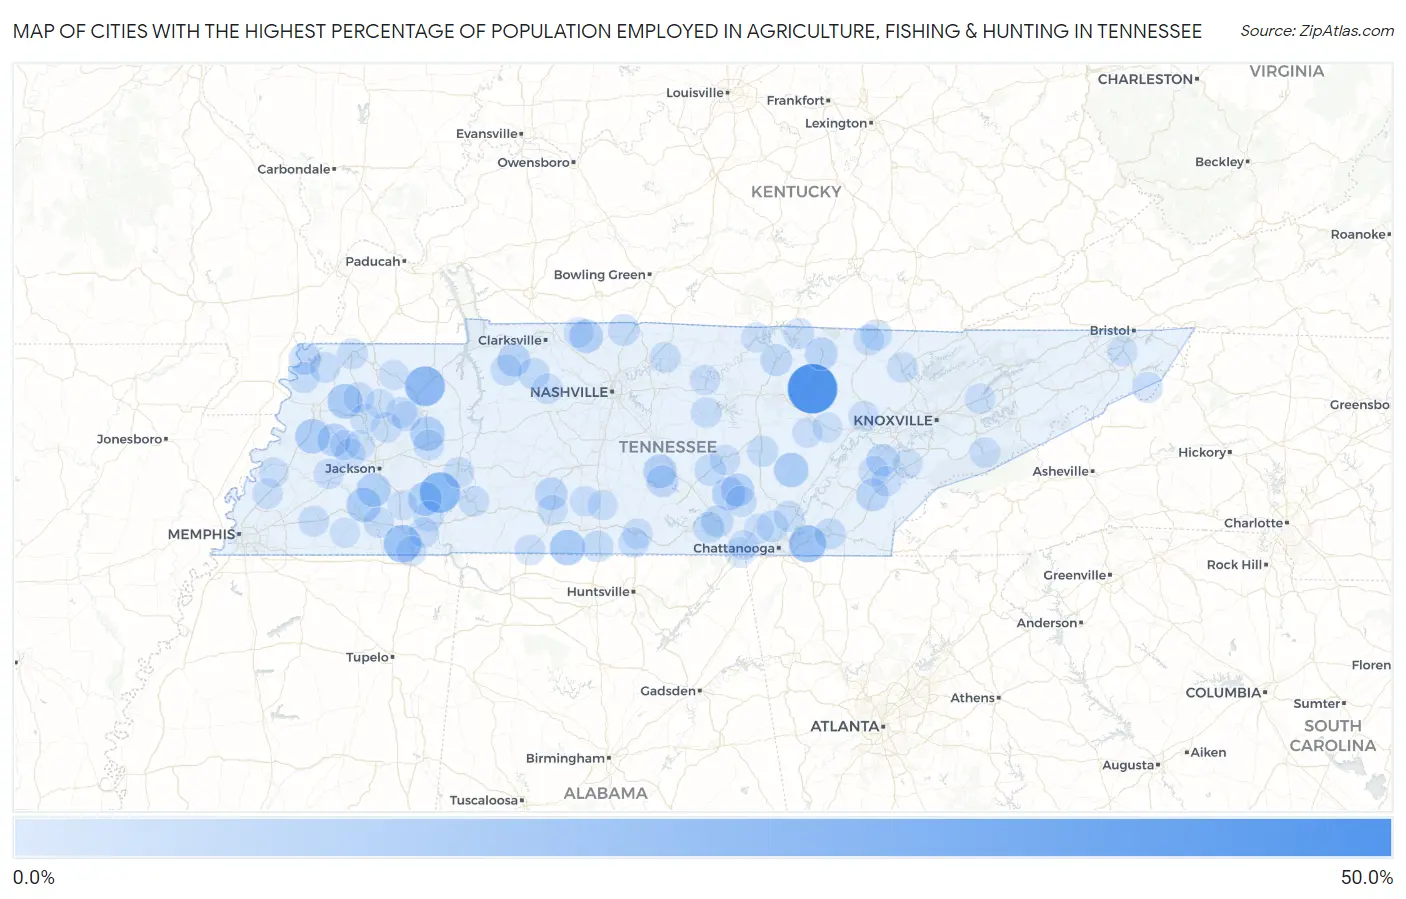
Map of Cities with the Highest Percentage of Population Employed in Agriculture, Fishing & Hunting in Tennessee
0.0%
50.0%
Cities with the Highest Percentage of Population Employed in Agriculture, Fishing & Hunting in Tennessee
| City | % Employed | vs State | vs National | |
| 1. | Conasauga | 40.5% | 0.74%(+39.8)#1 | 1.2%(+39.3)#299 |
| 2. | Clarkrange | 39.5% | 0.74%(+38.7)#2 | 1.2%(+38.3)#313 |
| 3. | Sardis | 21.2% | 0.74%(+20.5)#3 | 1.2%(+20.0)#927 |
| 4. | Henry | 19.8% | 0.74%(+19.0)#4 | 1.2%(+18.6)#1,033 |
| 5. | Ramer | 15.6% | 0.74%(+14.8)#5 | 1.2%(+14.4)#1,422 |
| 6. | Ooltewah | 14.8% | 0.74%(+14.0)#6 | 1.2%(+13.6)#1,509 |
| 7. | Minor Hill | 11.1% | 0.74%(+10.3)#7 | 1.2%(+9.87)#2,134 |
| 8. | Yorkville | 10.4% | 0.74%(+9.63)#8 | 1.2%(+9.17)#2,322 |
| 9. | Gates | 9.9% | 0.74%(+9.13)#9 | 1.2%(+8.67)#2,476 |
| 10. | Pikeville | 9.6% | 0.74%(+8.84)#10 | 1.2%(+8.37)#2,561 |
| 11. | Toone | 9.4% | 0.74%(+8.62)#11 | 1.2%(+8.15)#2,640 |
| 12. | Clarksburg | 9.3% | 0.74%(+8.55)#12 | 1.2%(+8.09)#2,667 |
| 13. | Medon | 8.8% | 0.74%(+8.09)#13 | 1.2%(+7.62)#2,827 |
| 14. | Morris Chapel | 8.4% | 0.74%(+7.68)#14 | 1.2%(+7.22)#2,990 |
| 15. | Enville | 8.3% | 0.74%(+7.60)#15 | 1.2%(+7.13)#3,026 |
| 16. | Cedar Hill | 7.8% | 0.74%(+7.04)#16 | 1.2%(+6.57)#3,222 |
| 17. | Bell Buckle | 7.6% | 0.74%(+6.84)#17 | 1.2%(+6.37)#3,324 |
| 18. | Altamont | 7.0% | 0.74%(+6.27)#18 | 1.2%(+5.81)#3,594 |
| 19. | Beersheba Springs | 6.9% | 0.74%(+6.13)#19 | 1.2%(+5.67)#3,664 |
| 20. | Cumberland City | 6.7% | 0.74%(+5.99)#20 | 1.2%(+5.53)#3,728 |
| 21. | Maury City | 6.5% | 0.74%(+5.73)#21 | 1.2%(+5.27)#3,859 |
| 22. | Summertown | 6.0% | 0.74%(+5.31)#22 | 1.2%(+4.84)#4,097 |
| 23. | Englewood | 6.0% | 0.74%(+5.26)#23 | 1.2%(+4.79)#4,118 |
| 24. | Jamestown | 5.9% | 0.74%(+5.20)#24 | 1.2%(+4.74)#4,154 |
| 25. | Hilham | 5.6% | 0.74%(+4.89)#25 | 1.2%(+4.43)#4,366 |
| 26. | Philadelphia | 5.4% | 0.74%(+4.63)#26 | 1.2%(+4.17)#4,556 |
| 27. | Tiptonville | 4.9% | 0.74%(+4.17)#27 | 1.2%(+3.71)#4,904 |
| 28. | Livingston | 4.7% | 0.74%(+3.99)#28 | 1.2%(+3.53)#5,063 |
| 29. | Wartrace | 4.4% | 0.74%(+3.70)#29 | 1.2%(+3.24)#5,324 |
| 30. | Monteagle | 4.3% | 0.74%(+3.54)#30 | 1.2%(+3.08)#5,492 |
| 31. | Orlinda | 4.2% | 0.74%(+3.47)#31 | 1.2%(+3.01)#5,538 |
| 32. | Lone Oak | 4.2% | 0.74%(+3.42)#32 | 1.2%(+2.96)#5,611 |
| 33. | Slayden | 4.1% | 0.74%(+3.32)#33 | 1.2%(+2.85)#5,708 |
| 34. | Morrison | 3.9% | 0.74%(+3.15)#34 | 1.2%(+2.69)#5,886 |
| 35. | Cosby | 3.8% | 0.74%(+3.09)#35 | 1.2%(+2.63)#5,969 |
| 36. | Elkton | 3.7% | 0.74%(+2.97)#36 | 1.2%(+2.50)#6,106 |
| 37. | Sewanee | 3.6% | 0.74%(+2.87)#37 | 1.2%(+2.41)#6,247 |
| 38. | East Cleveland | 3.3% | 0.74%(+2.53)#38 | 1.2%(+2.06)#6,681 |
| 39. | Ridgely | 3.2% | 0.74%(+2.43)#39 | 1.2%(+1.97)#6,801 |
| 40. | Erin | 3.2% | 0.74%(+2.43)#40 | 1.2%(+1.97)#6,802 |
| 41. | Winfield | 3.0% | 0.74%(+2.29)#41 | 1.2%(+1.83)#7,004 |
| 42. | Spencer | 3.0% | 0.74%(+2.27)#42 | 1.2%(+1.80)#7,034 |
| 43. | Byrdstown | 2.9% | 0.74%(+2.20)#43 | 1.2%(+1.73)#7,144 |
| 44. | Castalian Springs | 2.9% | 0.74%(+2.15)#44 | 1.2%(+1.69)#7,204 |
| 45. | Rutherford | 2.9% | 0.74%(+2.12)#45 | 1.2%(+1.66)#7,243 |
| 46. | Somerville | 2.8% | 0.74%(+2.10)#46 | 1.2%(+1.64)#7,286 |
| 47. | Decaturville | 2.8% | 0.74%(+2.09)#47 | 1.2%(+1.63)#7,299 |
| 48. | Caryville | 2.8% | 0.74%(+2.06)#48 | 1.2%(+1.60)#7,341 |
| 49. | Dowelltown | 2.8% | 0.74%(+2.04)#49 | 1.2%(+1.58)#7,374 |
| 50. | Gruetli Laager | 2.8% | 0.74%(+2.04)#50 | 1.2%(+1.57)#7,385 |
| 51. | Clifton | 2.7% | 0.74%(+2.00)#51 | 1.2%(+1.54)#7,431 |
| 52. | Trezevant | 2.7% | 0.74%(+1.96)#52 | 1.2%(+1.50)#7,505 |
| 53. | Union City | 2.7% | 0.74%(+1.95)#53 | 1.2%(+1.49)#7,520 |
| 54. | Hornbeak | 2.7% | 0.74%(+1.94)#54 | 1.2%(+1.48)#7,534 |
| 55. | Parker S Crossroads | 2.7% | 0.74%(+1.94)#55 | 1.2%(+1.47)#7,539 |
| 56. | Delano | 2.6% | 0.74%(+1.84)#56 | 1.2%(+1.38)#7,711 |
| 57. | Milan | 2.5% | 0.74%(+1.78)#57 | 1.2%(+1.32)#7,807 |
| 58. | Oneida | 2.5% | 0.74%(+1.78)#58 | 1.2%(+1.32)#7,814 |
| 59. | Hornsby | 2.5% | 0.74%(+1.72)#59 | 1.2%(+1.26)#7,915 |
| 60. | Roan Mountain | 2.4% | 0.74%(+1.68)#60 | 1.2%(+1.22)#8,002 |
| 61. | Mowbray Mountain | 2.3% | 0.74%(+1.59)#61 | 1.2%(+1.12)#8,184 |
| 62. | Oakdale | 2.3% | 0.74%(+1.54)#62 | 1.2%(+1.07)#8,278 |
| 63. | Mcminnville | 2.2% | 0.74%(+1.50)#63 | 1.2%(+1.04)#8,357 |
| 64. | Charlotte | 2.2% | 0.74%(+1.49)#64 | 1.2%(+1.02)#8,382 |
| 65. | Sweetwater | 2.2% | 0.74%(+1.45)#65 | 1.2%(+0.985)#8,470 |
| 66. | Fayetteville | 2.2% | 0.74%(+1.42)#66 | 1.2%(+0.953)#8,545 |
| 67. | Adamsville | 2.1% | 0.74%(+1.34)#67 | 1.2%(+0.879)#8,686 |
| 68. | New Market | 2.0% | 0.74%(+1.30)#68 | 1.2%(+0.835)#8,772 |
| 69. | Lynnville | 2.0% | 0.74%(+1.26)#69 | 1.2%(+0.801)#8,854 |
| 70. | Lynchburg | 2.0% | 0.74%(+1.25)#70 | 1.2%(+0.789)#8,876 |
| 71. | Stantonville | 2.0% | 0.74%(+1.25)#71 | 1.2%(+0.787)#8,880 |
| 72. | Cornersville | 1.9% | 0.74%(+1.19)#72 | 1.2%(+0.732)#8,990 |
| 73. | Bells | 1.9% | 0.74%(+1.18)#73 | 1.2%(+0.719)#9,030 |
| 74. | Park City | 1.9% | 0.74%(+1.16)#74 | 1.2%(+0.697)#9,089 |
| 75. | Adams | 1.9% | 0.74%(+1.14)#75 | 1.2%(+0.677)#9,147 |
| 76. | Brownsville | 1.8% | 0.74%(+1.11)#76 | 1.2%(+0.643)#9,227 |
| 77. | Guys | 1.8% | 0.74%(+1.09)#77 | 1.2%(+0.630)#9,257 |
| 78. | Atoka | 1.8% | 0.74%(+1.07)#78 | 1.2%(+0.610)#9,298 |
| 79. | Ethridge | 1.8% | 0.74%(+1.03)#79 | 1.2%(+0.563)#9,409 |
| 80. | Madisonville | 1.7% | 0.74%(+0.998)#80 | 1.2%(+0.536)#9,473 |
| 81. | South Carthage | 1.7% | 0.74%(+0.994)#81 | 1.2%(+0.532)#9,483 |
| 82. | St Joseph | 1.7% | 0.74%(+0.973)#82 | 1.2%(+0.510)#9,534 |
| 83. | Lake Tansi | 1.7% | 0.74%(+0.960)#83 | 1.2%(+0.498)#9,567 |
| 84. | Gatlinburg | 1.7% | 0.74%(+0.935)#84 | 1.2%(+0.472)#9,624 |
| 85. | Alamo | 1.7% | 0.74%(+0.929)#85 | 1.2%(+0.466)#9,652 |
| 86. | New Hope | 1.6% | 0.74%(+0.855)#86 | 1.2%(+0.392)#9,854 |
| 87. | Trenton | 1.6% | 0.74%(+0.854)#87 | 1.2%(+0.392)#9,856 |
| 88. | Powells Crossroads | 1.6% | 0.74%(+0.818)#88 | 1.2%(+0.355)#9,941 |
| 89. | Celina | 1.5% | 0.74%(+0.806)#89 | 1.2%(+0.343)#9,976 |
| 90. | Dresden | 1.5% | 0.74%(+0.755)#90 | 1.2%(+0.292)#10,134 |
| 91. | Bluff City | 1.5% | 0.74%(+0.751)#91 | 1.2%(+0.288)#10,139 |
| 92. | Greenback | 1.4% | 0.74%(+0.681)#92 | 1.2%(+0.218)#10,345 |
| 93. | Jasper | 1.4% | 0.74%(+0.668)#93 | 1.2%(+0.205)#10,385 |
| 94. | Crab Orchard | 1.4% | 0.74%(+0.645)#94 | 1.2%(+0.182)#10,444 |
| 95. | Gadsden | 1.4% | 0.74%(+0.643)#95 | 1.2%(+0.180)#10,446 |
| 96. | Mclemoresville | 1.4% | 0.74%(+0.643)#96 | 1.2%(+0.180)#10,447 |
| 97. | Hickory Valley | 1.4% | 0.74%(+0.615)#97 | 1.2%(+0.152)#10,550 |
| 98. | Finger | 1.3% | 0.74%(+0.588)#98 | 1.2%(+0.125)#10,626 |
| 99. | Garland | 1.3% | 0.74%(+0.588)#99 | 1.2%(+0.125)#10,630 |
| 100. | Bradford | 1.3% | 0.74%(+0.576)#100 | 1.2%(+0.114)#10,660 |
Common Questions
What are the Top 10 Cities with the Highest Percentage of Population Employed in Agriculture, Fishing & Hunting in Tennessee?
Top 10 Cities with the Highest Percentage of Population Employed in Agriculture, Fishing & Hunting in Tennessee are:
#1
39.5%
#2
21.2%
#3
19.8%
#4
15.6%
#5
14.8%
#6
11.1%
#7
10.4%
#8
9.9%
#9
9.6%
#10
9.4%
What city has the Highest Percentage of Population Employed in Agriculture, Fishing & Hunting in Tennessee?
Clarkrange has the Highest Percentage of Population Employed in Agriculture, Fishing & Hunting in Tennessee with 39.5%.
What is the Percentage of Population Employed in Agriculture, Fishing & Hunting in the State of Tennessee?
Percentage of Population Employed in Agriculture, Fishing & Hunting in Tennessee is 0.74%.
What is the Percentage of Population Employed in Agriculture, Fishing & Hunting in the United States?
Percentage of Population Employed in Agriculture, Fishing & Hunting in the United States is 1.2%.