Zip Codes with the Highest Percentage of Population Employed in Agriculture, Fishing & Hunting in Yorba Linda, CA
RELATED REPORTS & OPTIONS
Agriculture, Fishing & Hunting
Yorba Linda
Compare Zip Codes
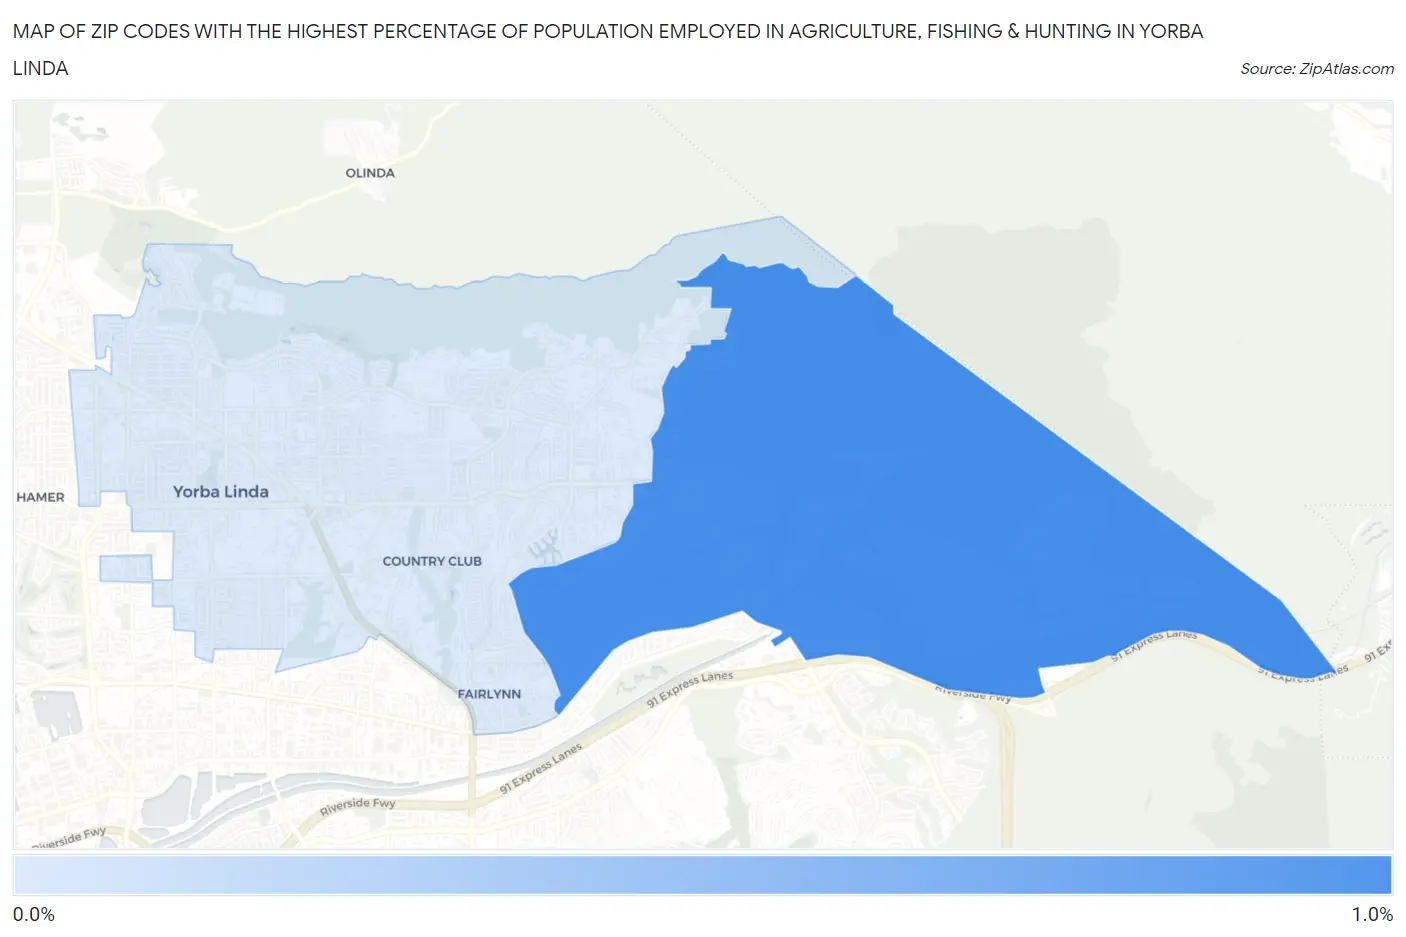
Map of Zip Codes with the Highest Percentage of Population Employed in Agriculture, Fishing & Hunting in Yorba Linda
0.17%
0.87%
Zip Codes with the Highest Percentage of Population Employed in Agriculture, Fishing & Hunting in Yorba Linda, CA
| Zip Code | % Employed | vs State | vs National | |
| 1. | 92887 | 0.87% | 2.0%(-1.11)#763 | 1.2%(-0.325)#16,839 |
| 2. | 92886 | 0.17% | 2.0%(-1.81)#1,248 | 1.2%(-1.03)#22,685 |
1
Common Questions
What are the Top Zip Codes with the Highest Percentage of Population Employed in Agriculture, Fishing & Hunting in Yorba Linda, CA?
Top Zip Codes with the Highest Percentage of Population Employed in Agriculture, Fishing & Hunting in Yorba Linda, CA are:
What zip code has the Highest Percentage of Population Employed in Agriculture, Fishing & Hunting in Yorba Linda, CA?
92887 has the Highest Percentage of Population Employed in Agriculture, Fishing & Hunting in Yorba Linda, CA with 0.87%.
What is the Percentage of Population Employed in Agriculture, Fishing & Hunting in Yorba Linda, CA?
Percentage of Population Employed in Agriculture, Fishing & Hunting in Yorba Linda is 0.40%.
What is the Percentage of Population Employed in Agriculture, Fishing & Hunting in California?
Percentage of Population Employed in Agriculture, Fishing & Hunting in California is 2.0%.
What is the Percentage of Population Employed in Agriculture, Fishing & Hunting in the United States?
Percentage of Population Employed in Agriculture, Fishing & Hunting in the United States is 1.2%.