Zip Codes with the Highest Percentage of Population Employed in Agriculture, Fishing & Hunting in San Diego, CA
RELATED REPORTS & OPTIONS
Agriculture, Fishing & Hunting
San Diego
Compare Zip Codes
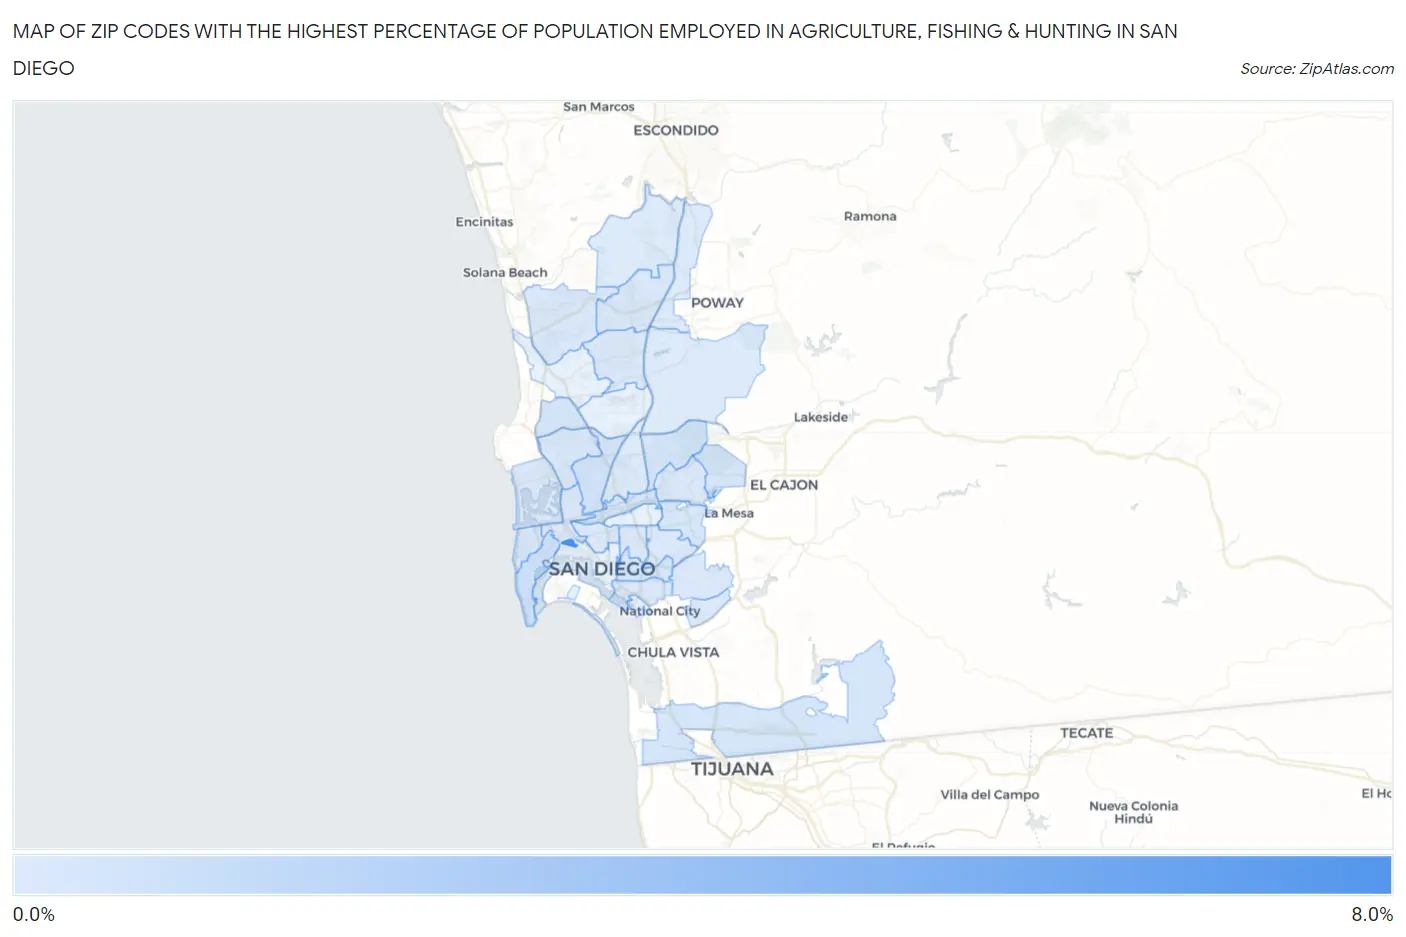
Map of Zip Codes with the Highest Percentage of Population Employed in Agriculture, Fishing & Hunting in San Diego
0.033%
8.0%
Zip Codes with the Highest Percentage of Population Employed in Agriculture, Fishing & Hunting in San Diego, CA
| Zip Code | % Employed | vs State | vs National | |
| 1. | 92140 | 8.0% | 2.0%(+5.99)#302 | 1.2%(+6.77)#5,421 |
| 2. | 92106 | 0.84% | 2.0%(-1.15)#775 | 1.2%(-0.361)#17,027 |
| 3. | 92111 | 0.57% | 2.0%(-1.41)#913 | 1.2%(-0.626)#18,682 |
| 4. | 92108 | 0.55% | 2.0%(-1.43)#925 | 1.2%(-0.645)#18,820 |
| 5. | 92124 | 0.46% | 2.0%(-1.52)#992 | 1.2%(-0.738)#19,603 |
| 6. | 92115 | 0.41% | 2.0%(-1.58)#1,030 | 1.2%(-0.793)#20,102 |
| 7. | 92122 | 0.39% | 2.0%(-1.60)#1,048 | 1.2%(-0.810)#20,253 |
| 8. | 92154 | 0.35% | 2.0%(-1.63)#1,072 | 1.2%(-0.846)#20,613 |
| 9. | 92119 | 0.34% | 2.0%(-1.65)#1,093 | 1.2%(-0.864)#20,804 |
| 10. | 92102 | 0.33% | 2.0%(-1.65)#1,097 | 1.2%(-0.867)#20,833 |
| 11. | 92107 | 0.32% | 2.0%(-1.66)#1,103 | 1.2%(-0.875)#20,898 |
| 12. | 92129 | 0.32% | 2.0%(-1.67)#1,113 | 1.2%(-0.884)#20,998 |
| 13. | 92117 | 0.24% | 2.0%(-1.74)#1,185 | 1.2%(-0.958)#21,854 |
| 14. | 92120 | 0.21% | 2.0%(-1.78)#1,219 | 1.2%(-0.994)#22,292 |
| 15. | 92105 | 0.19% | 2.0%(-1.79)#1,232 | 1.2%(-1.01)#22,467 |
| 16. | 92113 | 0.18% | 2.0%(-1.81)#1,242 | 1.2%(-1.02)#22,601 |
| 17. | 92110 | 0.18% | 2.0%(-1.81)#1,243 | 1.2%(-1.02)#22,614 |
| 18. | 92109 | 0.17% | 2.0%(-1.82)#1,256 | 1.2%(-1.03)#22,735 |
| 19. | 92103 | 0.15% | 2.0%(-1.83)#1,269 | 1.2%(-1.04)#22,953 |
| 20. | 92139 | 0.13% | 2.0%(-1.85)#1,294 | 1.2%(-1.07)#23,261 |
| 21. | 92130 | 0.11% | 2.0%(-1.88)#1,319 | 1.2%(-1.09)#23,539 |
| 22. | 92126 | 0.11% | 2.0%(-1.88)#1,323 | 1.2%(-1.09)#23,551 |
| 23. | 92114 | 0.100% | 2.0%(-1.89)#1,337 | 1.2%(-1.10)#23,691 |
| 24. | 92104 | 0.093% | 2.0%(-1.89)#1,346 | 1.2%(-1.11)#23,767 |
| 25. | 92131 | 0.081% | 2.0%(-1.90)#1,362 | 1.2%(-1.12)#23,949 |
| 26. | 92123 | 0.034% | 2.0%(-1.95)#1,400 | 1.2%(-1.17)#24,505 |
| 27. | 92128 | 0.034% | 2.0%(-1.95)#1,401 | 1.2%(-1.17)#24,507 |
| 28. | 92127 | 0.033% | 2.0%(-1.95)#1,402 | 1.2%(-1.17)#24,514 |
1
Common Questions
What are the Top 10 Zip Codes with the Highest Percentage of Population Employed in Agriculture, Fishing & Hunting in San Diego, CA?
Top 10 Zip Codes with the Highest Percentage of Population Employed in Agriculture, Fishing & Hunting in San Diego, CA are:
What zip code has the Highest Percentage of Population Employed in Agriculture, Fishing & Hunting in San Diego, CA?
92140 has the Highest Percentage of Population Employed in Agriculture, Fishing & Hunting in San Diego, CA with 8.0%.
What is the Percentage of Population Employed in Agriculture, Fishing & Hunting in San Diego, CA?
Percentage of Population Employed in Agriculture, Fishing & Hunting in San Diego is 0.23%.
What is the Percentage of Population Employed in Agriculture, Fishing & Hunting in California?
Percentage of Population Employed in Agriculture, Fishing & Hunting in California is 2.0%.
What is the Percentage of Population Employed in Agriculture, Fishing & Hunting in the United States?
Percentage of Population Employed in Agriculture, Fishing & Hunting in the United States is 1.2%.