Zip Codes with the Highest Percentage of Population Employed in Agriculture, Fishing & Hunting in Merced, CA
RELATED REPORTS & OPTIONS
Agriculture, Fishing & Hunting
Merced
Compare Zip Codes
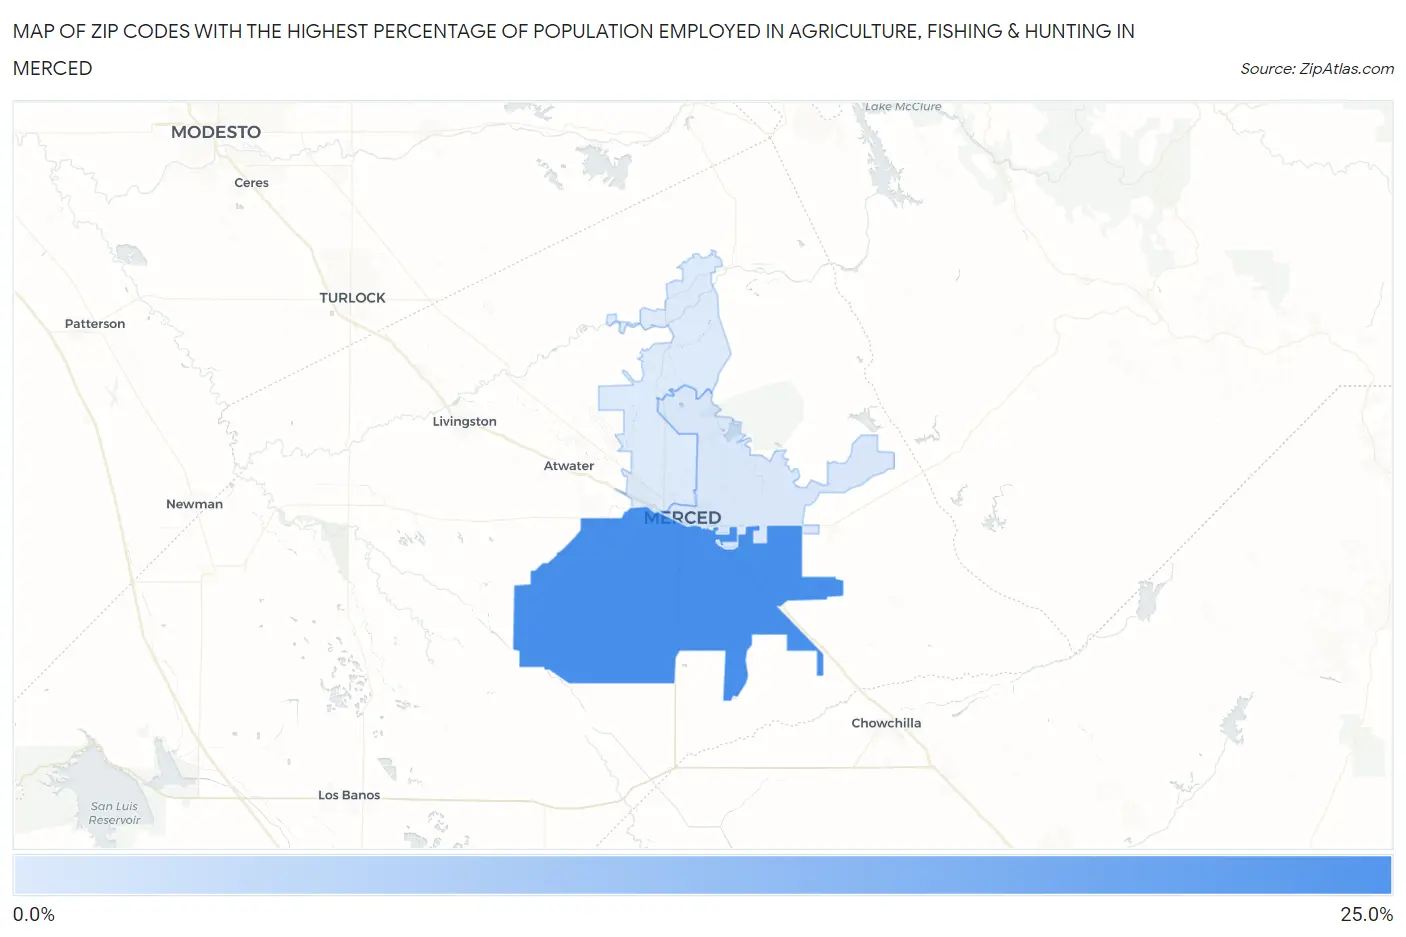
Map of Zip Codes with the Highest Percentage of Population Employed in Agriculture, Fishing & Hunting in Merced
2.2%
21.3%
Zip Codes with the Highest Percentage of Population Employed in Agriculture, Fishing & Hunting in Merced, CA
| Zip Code | % Employed | vs State | vs National | |
| 1. | 95341 | 21.3% | 2.0%(+19.3)#132 | 1.2%(+20.1)#1,633 |
| 2. | 95340 | 2.9% | 2.0%(+0.882)#494 | 1.2%(+1.67)#10,814 |
| 3. | 95348 | 2.2% | 2.0%(+0.214)#547 | 1.2%(+1.00)#12,258 |
1
Common Questions
What are the Top Zip Codes with the Highest Percentage of Population Employed in Agriculture, Fishing & Hunting in Merced, CA?
Top Zip Codes with the Highest Percentage of Population Employed in Agriculture, Fishing & Hunting in Merced, CA are:
What zip code has the Highest Percentage of Population Employed in Agriculture, Fishing & Hunting in Merced, CA?
95341 has the Highest Percentage of Population Employed in Agriculture, Fishing & Hunting in Merced, CA with 21.3%.
What is the Percentage of Population Employed in Agriculture, Fishing & Hunting in Merced, CA?
Percentage of Population Employed in Agriculture, Fishing & Hunting in Merced is 8.2%.
What is the Percentage of Population Employed in Agriculture, Fishing & Hunting in California?
Percentage of Population Employed in Agriculture, Fishing & Hunting in California is 2.0%.
What is the Percentage of Population Employed in Agriculture, Fishing & Hunting in the United States?
Percentage of Population Employed in Agriculture, Fishing & Hunting in the United States is 1.2%.