Cities with the Highest Percentage of Population Employed in Agriculture, Fishing & Hunting in Nebraska
RELATED REPORTS & OPTIONS
Agriculture, Fishing & Hunting
Nebraska
Compare Cities
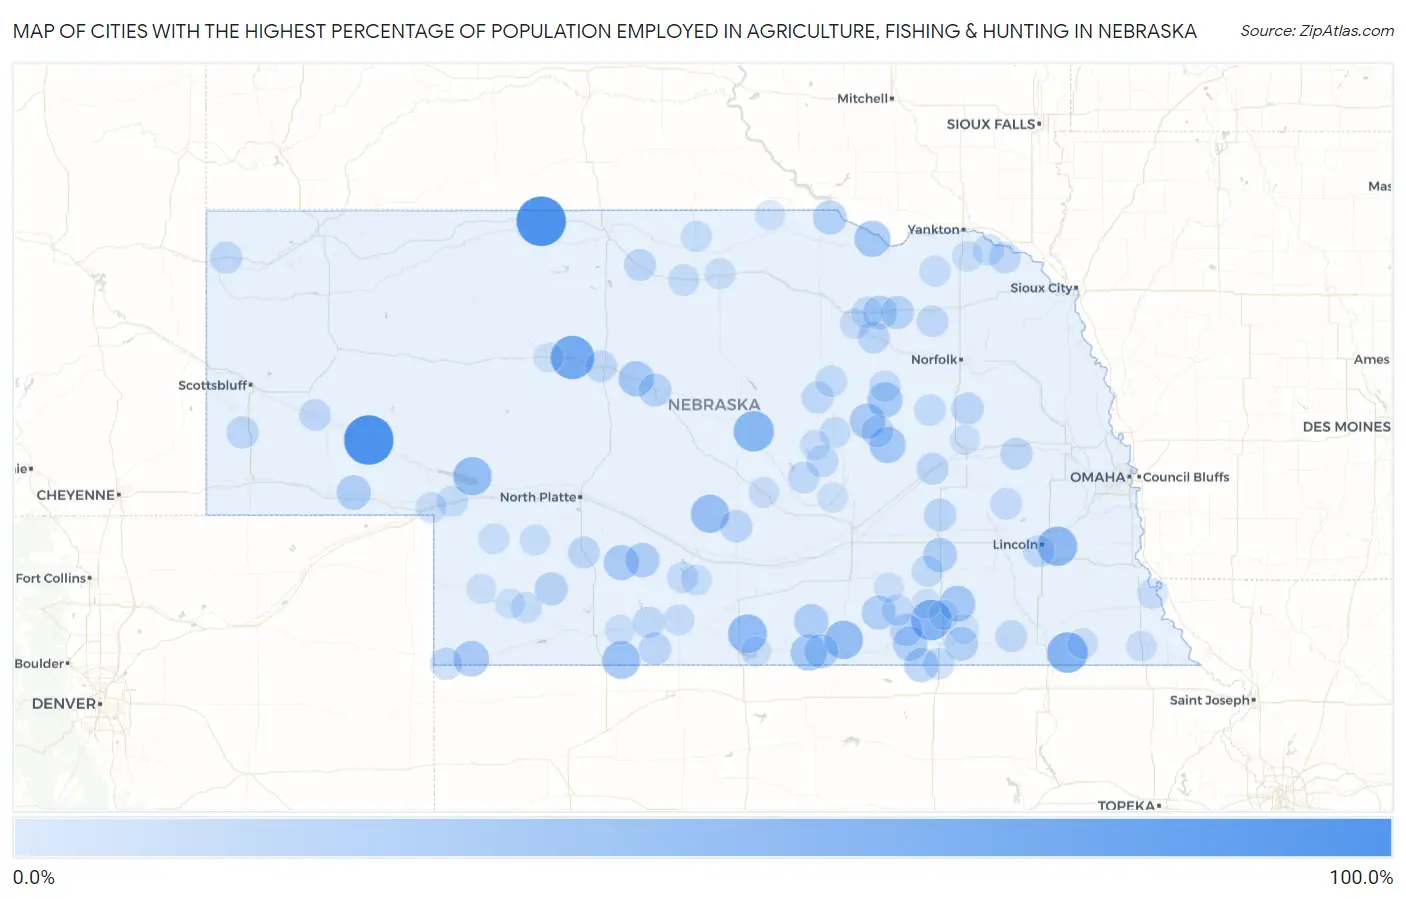
Map of Cities with the Highest Percentage of Population Employed in Agriculture, Fishing & Hunting in Nebraska
0.0%
100.0%
Cities with the Highest Percentage of Population Employed in Agriculture, Fishing & Hunting in Nebraska
| City | % Employed | vs State | vs National | |
| 1. | Nenzel | 100.0% | 4.1%(+95.9)#1 | 1.2%(+98.8)#50 |
| 2. | Lisco | 100.0% | 4.1%(+95.9)#2 | 1.2%(+98.8)#56 |
| 3. | Seneca | 72.7% | 4.1%(+68.6)#3 | 1.2%(+71.5)#98 |
| 4. | Liberty | 60.0% | 4.1%(+55.9)#4 | 1.2%(+58.8)#136 |
| 5. | Carleton | 59.6% | 4.1%(+55.5)#5 | 1.2%(+58.4)#141 |
| 6. | Comstock | 58.5% | 4.1%(+54.4)#6 | 1.2%(+57.3)#145 |
| 7. | Walton | 54.4% | 4.1%(+50.3)#7 | 1.2%(+53.2)#174 |
| 8. | Huntley | 52.1% | 4.1%(+47.9)#8 | 1.2%(+50.9)#184 |
| 9. | Martin | 50.0% | 4.1%(+45.9)#9 | 1.2%(+48.8)#196 |
| 10. | Cowles | 50.0% | 4.1%(+45.9)#10 | 1.2%(+48.8)#209 |
| 11. | Eddyville | 49.1% | 4.1%(+44.9)#11 | 1.2%(+47.9)#214 |
| 12. | Danbury | 46.3% | 4.1%(+42.2)#12 | 1.2%(+45.1)#226 |
| 13. | Riverton | 40.6% | 4.1%(+36.5)#13 | 1.2%(+39.4)#297 |
| 14. | Belgrade | 40.5% | 4.1%(+36.4)#14 | 1.2%(+39.3)#298 |
| 15. | Verdel | 40.0% | 4.1%(+35.9)#15 | 1.2%(+38.8)#307 |
| 16. | Ohiowa | 39.0% | 4.1%(+34.8)#16 | 1.2%(+37.8)#318 |
| 17. | Parks | 37.5% | 4.1%(+33.4)#17 | 1.2%(+36.3)#347 |
| 18. | Primrose | 36.8% | 4.1%(+32.7)#18 | 1.2%(+35.6)#355 |
| 19. | Halsey | 36.8% | 4.1%(+32.7)#19 | 1.2%(+35.6)#356 |
| 20. | Loretto | 35.8% | 4.1%(+31.7)#20 | 1.2%(+34.6)#368 |
| 21. | Moorefield | 35.7% | 4.1%(+31.6)#21 | 1.2%(+34.5)#372 |
| 22. | Campbell | 33.1% | 4.1%(+28.9)#22 | 1.2%(+31.9)#435 |
| 23. | Farnam | 32.9% | 4.1%(+28.8)#23 | 1.2%(+31.7)#441 |
| 24. | Sunol | 32.7% | 4.1%(+28.5)#24 | 1.2%(+31.5)#447 |
| 25. | Ruskin | 31.9% | 4.1%(+27.8)#25 | 1.2%(+30.7)#459 |
| 26. | Byron | 31.8% | 4.1%(+27.7)#26 | 1.2%(+30.6)#465 |
| 27. | Inavale | 31.2% | 4.1%(+27.1)#27 | 1.2%(+30.1)#483 |
| 28. | Mccool Junction | 30.9% | 4.1%(+26.8)#28 | 1.2%(+29.7)#493 |
| 29. | Deweese | 30.8% | 4.1%(+26.6)#29 | 1.2%(+29.6)#505 |
| 30. | Gilead | 30.0% | 4.1%(+25.9)#30 | 1.2%(+28.8)#531 |
| 31. | Gross | 30.0% | 4.1%(+25.9)#31 | 1.2%(+28.8)#532 |
| 32. | Royal | 28.9% | 4.1%(+24.7)#32 | 1.2%(+27.7)#563 |
| 33. | Hayes Center | 27.4% | 4.1%(+23.2)#33 | 1.2%(+26.2)#618 |
| 34. | Brunswick | 26.8% | 4.1%(+22.7)#34 | 1.2%(+25.6)#651 |
| 35. | Dunning | 26.5% | 4.1%(+22.3)#35 | 1.2%(+25.3)#667 |
| 36. | Oak | 25.0% | 4.1%(+20.9)#36 | 1.2%(+23.8)#726 |
| 37. | Benedict | 24.7% | 4.1%(+20.6)#37 | 1.2%(+23.5)#737 |
| 38. | Wilsonville | 24.4% | 4.1%(+20.2)#38 | 1.2%(+23.2)#748 |
| 39. | Miller | 24.1% | 4.1%(+20.0)#39 | 1.2%(+22.9)#761 |
| 40. | Creston | 23.4% | 4.1%(+19.2)#40 | 1.2%(+22.2)#800 |
| 41. | Harrisburg | 23.3% | 4.1%(+19.2)#41 | 1.2%(+22.1)#803 |
| 42. | Silver Creek | 22.8% | 4.1%(+18.7)#42 | 1.2%(+21.6)#825 |
| 43. | Linwood | 22.7% | 4.1%(+18.6)#43 | 1.2%(+21.5)#830 |
| 44. | Cedar Rapids | 22.7% | 4.1%(+18.5)#44 | 1.2%(+21.5)#832 |
| 45. | Haigler | 22.6% | 4.1%(+18.4)#45 | 1.2%(+21.4)#837 |
| 46. | Wellfleet | 22.2% | 4.1%(+18.1)#46 | 1.2%(+21.0)#864 |
| 47. | Wood Lake | 22.2% | 4.1%(+18.1)#47 | 1.2%(+21.0)#867 |
| 48. | Clearwater | 22.2% | 4.1%(+18.0)#48 | 1.2%(+21.0)#872 |
| 49. | Harrison | 22.0% | 4.1%(+17.8)#49 | 1.2%(+20.8)#886 |
| 50. | Ericson | 21.7% | 4.1%(+17.6)#50 | 1.2%(+20.5)#896 |
| 51. | Harbine | 21.7% | 4.1%(+17.6)#51 | 1.2%(+20.5)#897 |
| 52. | Foster | 21.4% | 4.1%(+17.3)#52 | 1.2%(+20.2)#913 |
| 53. | Cotesfield | 21.4% | 4.1%(+17.3)#53 | 1.2%(+20.2)#914 |
| 54. | Obert | 21.4% | 4.1%(+17.3)#54 | 1.2%(+20.2)#915 |
| 55. | Thedford | 21.4% | 4.1%(+17.2)#55 | 1.2%(+20.2)#919 |
| 56. | Cambridge | 21.3% | 4.1%(+17.1)#56 | 1.2%(+20.1)#925 |
| 57. | Yankee Hill | 21.1% | 4.1%(+16.9)#57 | 1.2%(+19.9)#934 |
| 58. | Ashton | 20.9% | 4.1%(+16.8)#58 | 1.2%(+19.7)#942 |
| 59. | Bridgeport | 20.9% | 4.1%(+16.7)#59 | 1.2%(+19.7)#945 |
| 60. | Lindsay | 20.6% | 4.1%(+16.5)#60 | 1.2%(+19.4)#962 |
| 61. | Bartlett | 20.5% | 4.1%(+16.4)#61 | 1.2%(+19.3)#970 |
| 62. | Dwight | 20.4% | 4.1%(+16.2)#62 | 1.2%(+19.2)#981 |
| 63. | Ainsworth | 20.0% | 4.1%(+15.8)#63 | 1.2%(+18.8)#1,022 |
| 64. | Petersburg | 19.9% | 4.1%(+15.8)#64 | 1.2%(+18.7)#1,024 |
| 65. | Chester | 19.8% | 4.1%(+15.7)#65 | 1.2%(+18.6)#1,026 |
| 66. | Wynot | 19.8% | 4.1%(+15.7)#66 | 1.2%(+18.6)#1,028 |
| 67. | Orchard | 19.8% | 4.1%(+15.6)#67 | 1.2%(+18.6)#1,034 |
| 68. | Edgar | 19.7% | 4.1%(+15.5)#68 | 1.2%(+18.5)#1,036 |
| 69. | Grafton | 19.3% | 4.1%(+15.2)#69 | 1.2%(+18.1)#1,063 |
| 70. | Brule | 19.0% | 4.1%(+14.8)#70 | 1.2%(+17.8)#1,088 |
| 71. | Bloomfield | 18.4% | 4.1%(+14.2)#71 | 1.2%(+17.2)#1,133 |
| 72. | Greeley Center | 18.2% | 4.1%(+14.1)#72 | 1.2%(+17.0)#1,140 |
| 73. | Elwood | 17.9% | 4.1%(+13.8)#73 | 1.2%(+16.7)#1,171 |
| 74. | Springview | 17.8% | 4.1%(+13.6)#74 | 1.2%(+16.6)#1,187 |
| 75. | Litchfield | 17.7% | 4.1%(+13.6)#75 | 1.2%(+16.5)#1,193 |
| 76. | Hamlet | 17.6% | 4.1%(+13.5)#76 | 1.2%(+16.4)#1,200 |
| 77. | Smithfield | 17.5% | 4.1%(+13.4)#77 | 1.2%(+16.3)#1,211 |
| 78. | Big Springs | 17.5% | 4.1%(+13.3)#78 | 1.2%(+16.3)#1,212 |
| 79. | Bassett | 17.5% | 4.1%(+13.3)#79 | 1.2%(+16.3)#1,213 |
| 80. | Madrid | 17.5% | 4.1%(+13.3)#80 | 1.2%(+16.3)#1,214 |
| 81. | Arapahoe | 17.4% | 4.1%(+13.2)#81 | 1.2%(+16.2)#1,227 |
| 82. | Fordyce | 17.3% | 4.1%(+13.1)#82 | 1.2%(+16.1)#1,235 |
| 83. | Ewing | 16.9% | 4.1%(+12.7)#83 | 1.2%(+15.7)#1,277 |
| 84. | Wallace | 16.8% | 4.1%(+12.7)#84 | 1.2%(+15.6)#1,280 |
| 85. | Burchard | 16.7% | 4.1%(+12.5)#85 | 1.2%(+15.5)#1,299 |
| 86. | Scotia | 16.2% | 4.1%(+12.1)#86 | 1.2%(+15.0)#1,359 |
| 87. | Dawson | 15.6% | 4.1%(+11.4)#87 | 1.2%(+14.4)#1,421 |
| 88. | Peru | 15.5% | 4.1%(+11.3)#88 | 1.2%(+14.3)#1,429 |
| 89. | Indianola | 15.2% | 4.1%(+11.1)#89 | 1.2%(+14.0)#1,461 |
| 90. | Alexandria | 14.9% | 4.1%(+10.8)#90 | 1.2%(+13.7)#1,497 |
| 91. | Wauneta | 14.9% | 4.1%(+10.7)#91 | 1.2%(+13.7)#1,499 |
| 92. | Shickley | 14.9% | 4.1%(+10.7)#92 | 1.2%(+13.7)#1,501 |
| 93. | Dannebrog | 14.8% | 4.1%(+10.7)#93 | 1.2%(+13.6)#1,502 |
| 94. | Mullen | 14.8% | 4.1%(+10.7)#94 | 1.2%(+13.6)#1,503 |
| 95. | Republican City | 14.8% | 4.1%(+10.7)#95 | 1.2%(+13.6)#1,506 |
| 96. | Clay Center | 14.6% | 4.1%(+10.4)#96 | 1.2%(+13.4)#1,526 |
| 97. | Imperial | 14.6% | 4.1%(+10.4)#97 | 1.2%(+13.4)#1,529 |
| 98. | Bruning | 14.5% | 4.1%(+10.3)#98 | 1.2%(+13.3)#1,543 |
| 99. | Lakeview | 14.4% | 4.1%(+10.2)#99 | 1.2%(+13.2)#1,560 |
| 100. | Naper | 14.3% | 4.1%(+10.1)#100 | 1.2%(+13.1)#1,569 |
Common Questions
What are the Top 10 Cities with the Highest Percentage of Population Employed in Agriculture, Fishing & Hunting in Nebraska?
Top 10 Cities with the Highest Percentage of Population Employed in Agriculture, Fishing & Hunting in Nebraska are:
What city has the Highest Percentage of Population Employed in Agriculture, Fishing & Hunting in Nebraska?
Nenzel has the Highest Percentage of Population Employed in Agriculture, Fishing & Hunting in Nebraska with 100.0%.
What is the Percentage of Population Employed in Agriculture, Fishing & Hunting in the State of Nebraska?
Percentage of Population Employed in Agriculture, Fishing & Hunting in Nebraska is 4.1%.
What is the Percentage of Population Employed in Agriculture, Fishing & Hunting in the United States?
Percentage of Population Employed in Agriculture, Fishing & Hunting in the United States is 1.2%.