Cities with the Highest Percentage of Population Employed in Agriculture, Fishing & Hunting in Oklahoma
RELATED REPORTS & OPTIONS
Agriculture, Fishing & Hunting
Oklahoma
Compare Cities
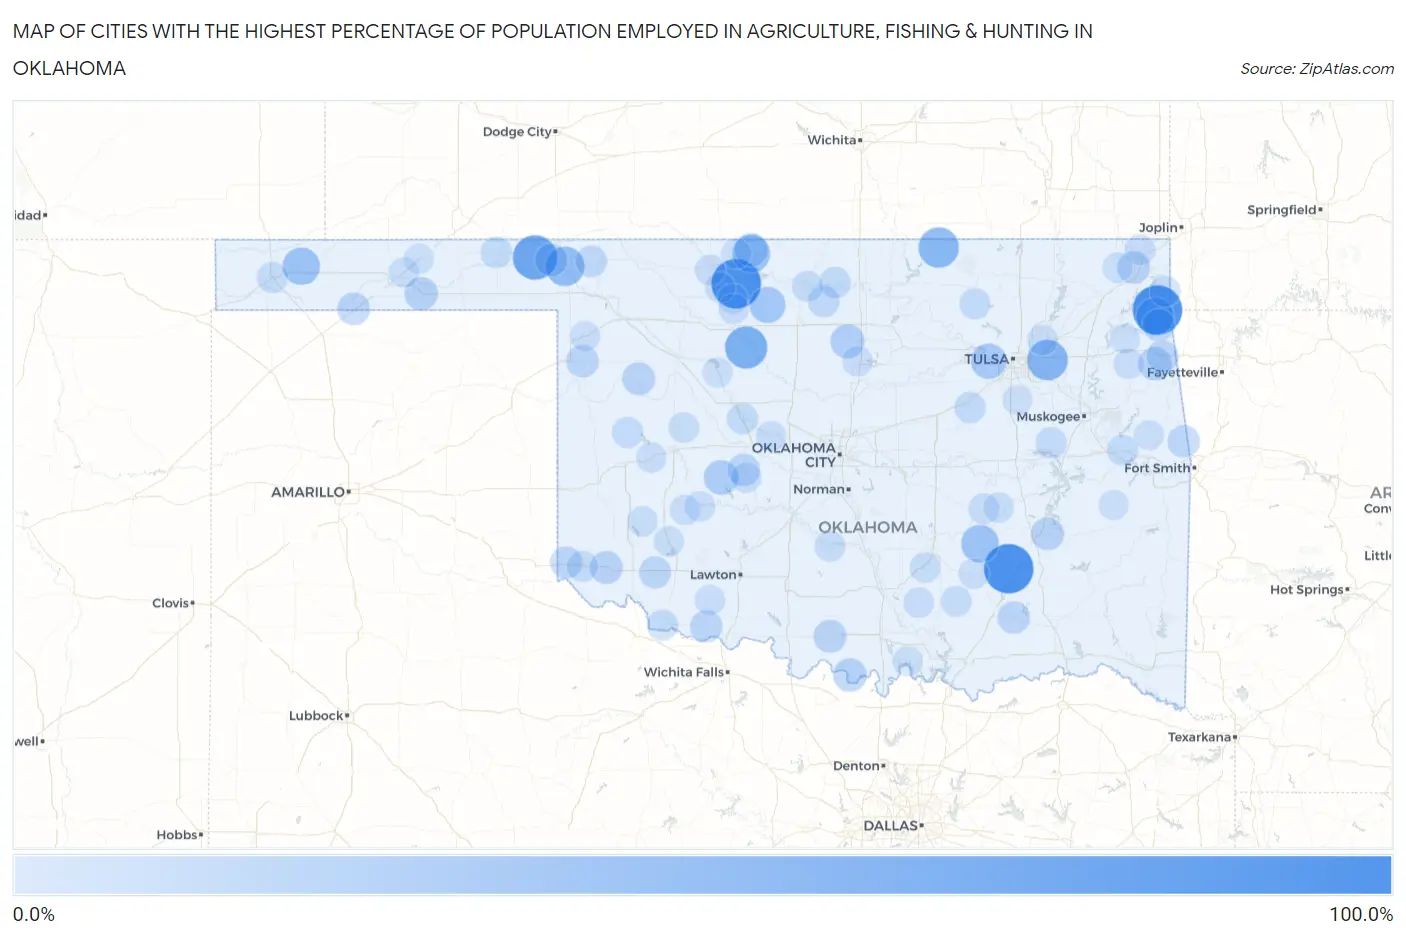
Map of Cities with the Highest Percentage of Population Employed in Agriculture, Fishing & Hunting in Oklahoma
0.0%
100.0%
Cities with the Highest Percentage of Population Employed in Agriculture, Fishing & Hunting in Oklahoma
| City | % Employed | vs State | vs National | |
| 1. | Wardville | 100.0% | 1.6%(+98.4)#1 | 1.2%(+98.8)#25 |
| 2. | White Water | 100.0% | 1.6%(+98.4)#2 | 1.2%(+98.8)#31 |
| 3. | Lambert | 100.0% | 1.6%(+98.4)#3 | 1.2%(+98.8)#70 |
| 4. | Knowles | 75.0% | 1.6%(+73.4)#4 | 1.2%(+73.8)#94 |
| 5. | Isabella | 64.5% | 1.6%(+63.0)#5 | 1.2%(+63.3)#118 |
| 6. | Fair Oaks | 56.8% | 1.6%(+55.3)#6 | 1.2%(+55.6)#155 |
| 7. | Grainola | 55.6% | 1.6%(+54.0)#7 | 1.2%(+54.4)#164 |
| 8. | Rosston | 50.0% | 1.6%(+48.4)#8 | 1.2%(+48.8)#200 |
| 9. | Byron | 42.9% | 1.6%(+41.3)#9 | 1.2%(+41.7)#265 |
| 10. | Deer Lick | 42.5% | 1.6%(+40.9)#10 | 1.2%(+41.3)#268 |
| 11. | Gerty | 42.3% | 1.6%(+40.7)#11 | 1.2%(+41.1)#271 |
| 12. | Keyes | 41.4% | 1.6%(+39.9)#12 | 1.2%(+40.2)#281 |
| 13. | Goltry | 35.5% | 1.6%(+34.0)#13 | 1.2%(+34.3)#378 |
| 14. | Chance | 34.4% | 1.6%(+32.8)#14 | 1.2%(+33.2)#399 |
| 15. | Lotsee | 33.3% | 1.6%(+31.8)#15 | 1.2%(+32.1)#431 |
| 16. | Eakly | 29.1% | 1.6%(+27.5)#16 | 1.2%(+27.9)#554 |
| 17. | Baron | 27.9% | 1.6%(+26.3)#17 | 1.2%(+26.7)#600 |
| 18. | Hough | 26.9% | 1.6%(+25.4)#18 | 1.2%(+25.7)#645 |
| 19. | Lucien | 25.9% | 1.6%(+24.4)#19 | 1.2%(+24.7)#687 |
| 20. | Chewey | 24.1% | 1.6%(+22.6)#20 | 1.2%(+22.9)#760 |
| 21. | Leon | 23.8% | 1.6%(+22.2)#21 | 1.2%(+22.6)#776 |
| 22. | Amorita | 23.1% | 1.6%(+21.5)#22 | 1.2%(+21.9)#814 |
| 23. | Hardesty | 22.8% | 1.6%(+21.2)#23 | 1.2%(+21.6)#828 |
| 24. | Bache | 22.2% | 1.6%(+20.7)#24 | 1.2%(+21.0)#863 |
| 25. | Alderson | 21.6% | 1.6%(+20.0)#25 | 1.2%(+20.4)#900 |
| 26. | East Duke | 21.2% | 1.6%(+19.7)#26 | 1.2%(+20.0)#928 |
| 27. | Cornish | 21.2% | 1.6%(+19.6)#27 | 1.2%(+20.0)#931 |
| 28. | Camargo | 21.1% | 1.6%(+19.6)#28 | 1.2%(+19.9)#932 |
| 29. | Gate | 20.5% | 1.6%(+18.9)#29 | 1.2%(+19.3)#975 |
| 30. | Narcissa | 20.0% | 1.6%(+18.4)#30 | 1.2%(+18.8)#1,008 |
| 31. | Texhoma | 19.8% | 1.6%(+18.2)#31 | 1.2%(+18.6)#1,032 |
| 32. | Lookeba | 19.5% | 1.6%(+18.0)#32 | 1.2%(+18.3)#1,047 |
| 33. | Arnett | 19.3% | 1.6%(+17.8)#33 | 1.2%(+18.1)#1,064 |
| 34. | Lane | 19.1% | 1.6%(+17.5)#34 | 1.2%(+17.9)#1,083 |
| 35. | Short | 18.4% | 1.6%(+16.9)#35 | 1.2%(+17.2)#1,128 |
| 36. | Reagan | 18.2% | 1.6%(+16.6)#36 | 1.2%(+17.0)#1,148 |
| 37. | Grandfield | 18.1% | 1.6%(+16.5)#37 | 1.2%(+16.9)#1,155 |
| 38. | Sycamore | 17.9% | 1.6%(+16.4)#38 | 1.2%(+16.7)#1,167 |
| 39. | Hollis | 17.9% | 1.6%(+16.4)#39 | 1.2%(+16.7)#1,172 |
| 40. | Headrick | 17.6% | 1.6%(+16.1)#40 | 1.2%(+16.4)#1,197 |
| 41. | Leonard | 17.5% | 1.6%(+15.9)#41 | 1.2%(+16.3)#1,218 |
| 42. | Little Rock | 17.5% | 1.6%(+15.9)#42 | 1.2%(+16.3)#1,219 |
| 43. | Dripping Springs | 17.4% | 1.6%(+15.8)#43 | 1.2%(+16.2)#1,225 |
| 44. | Buffalo | 15.6% | 1.6%(+14.0)#44 | 1.2%(+14.4)#1,419 |
| 45. | Hunter | 15.4% | 1.6%(+13.8)#45 | 1.2%(+14.2)#1,444 |
| 46. | Adams | 14.9% | 1.6%(+13.3)#46 | 1.2%(+13.7)#1,495 |
| 47. | Lamont | 14.5% | 1.6%(+13.0)#47 | 1.2%(+13.3)#1,535 |
| 48. | Forgan | 14.1% | 1.6%(+12.5)#48 | 1.2%(+12.9)#1,595 |
| 49. | Slick | 14.0% | 1.6%(+12.5)#49 | 1.2%(+12.8)#1,601 |
| 50. | Greenfield | 13.6% | 1.6%(+12.1)#50 | 1.2%(+12.4)#1,648 |
| 51. | Hammon | 13.4% | 1.6%(+11.8)#51 | 1.2%(+12.2)#1,684 |
| 52. | Council Hill | 13.3% | 1.6%(+11.8)#52 | 1.2%(+12.1)#1,697 |
| 53. | Boise City | 13.2% | 1.6%(+11.6)#53 | 1.2%(+12.0)#1,727 |
| 54. | Gould | 13.2% | 1.6%(+11.6)#54 | 1.2%(+12.0)#1,728 |
| 55. | Lone Chimney | 12.8% | 1.6%(+11.3)#55 | 1.2%(+11.6)#1,778 |
| 56. | Carlisle | 12.5% | 1.6%(+10.9)#56 | 1.2%(+11.3)#1,825 |
| 57. | Cayuga | 12.5% | 1.6%(+10.9)#57 | 1.2%(+11.3)#1,830 |
| 58. | Pond Creek | 12.5% | 1.6%(+10.9)#58 | 1.2%(+11.3)#1,846 |
| 59. | Wynona | 12.4% | 1.6%(+10.8)#59 | 1.2%(+11.2)#1,854 |
| 60. | Davidson | 12.1% | 1.6%(+10.6)#60 | 1.2%(+10.9)#1,899 |
| 61. | North Miami | 11.8% | 1.6%(+10.2)#61 | 1.2%(+10.6)#1,957 |
| 62. | Bromide | 11.6% | 1.6%(+10.1)#62 | 1.2%(+10.4)#2,001 |
| 63. | Greenville | 11.5% | 1.6%(+9.98)#63 | 1.2%(+10.3)#2,024 |
| 64. | Erin Springs | 11.5% | 1.6%(+9.98)#64 | 1.2%(+10.3)#2,026 |
| 65. | Fitzhugh | 11.1% | 1.6%(+9.55)#65 | 1.2%(+9.91)#2,115 |
| 66. | Horntown | 11.1% | 1.6%(+9.55)#66 | 1.2%(+9.91)#2,124 |
| 67. | Valley Park | 11.1% | 1.6%(+9.55)#67 | 1.2%(+9.91)#2,132 |
| 68. | Custer City | 10.7% | 1.6%(+9.11)#68 | 1.2%(+9.47)#2,241 |
| 69. | Alva | 10.6% | 1.6%(+9.02)#69 | 1.2%(+9.38)#2,259 |
| 70. | Shady Grove Cdp Cherokee County | 10.5% | 1.6%(+8.96)#70 | 1.2%(+9.33)#2,270 |
| 71. | Mountain View | 10.4% | 1.6%(+8.82)#71 | 1.2%(+9.18)#2,312 |
| 72. | Dacoma | 10.2% | 1.6%(+8.64)#72 | 1.2%(+9.00)#2,385 |
| 73. | Centrahoma | 10.0% | 1.6%(+8.44)#73 | 1.2%(+8.80)#2,439 |
| 74. | Keefton | 9.9% | 1.6%(+8.37)#74 | 1.2%(+8.73)#2,453 |
| 75. | Mill Creek | 9.9% | 1.6%(+8.34)#75 | 1.2%(+8.70)#2,467 |
| 76. | Shady Grove Cdp Mcintosh County | 9.8% | 1.6%(+8.24)#76 | 1.2%(+8.60)#2,489 |
| 77. | Binger | 9.7% | 1.6%(+8.15)#77 | 1.2%(+8.51)#2,518 |
| 78. | Gotebo | 9.6% | 1.6%(+8.08)#78 | 1.2%(+8.44)#2,538 |
| 79. | Calumet | 9.6% | 1.6%(+8.07)#79 | 1.2%(+8.43)#2,544 |
| 80. | Teresita | 9.6% | 1.6%(+8.05)#80 | 1.2%(+8.42)#2,549 |
| 81. | Orlando | 9.6% | 1.6%(+8.05)#81 | 1.2%(+8.42)#2,551 |
| 82. | Burlington | 9.5% | 1.6%(+7.96)#82 | 1.2%(+8.32)#2,577 |
| 83. | Lone Wolf | 9.4% | 1.6%(+7.81)#83 | 1.2%(+8.18)#2,630 |
| 84. | Bluejacket | 9.3% | 1.6%(+7.78)#84 | 1.2%(+8.15)#2,643 |
| 85. | Optima | 9.3% | 1.6%(+7.76)#85 | 1.2%(+8.12)#2,653 |
| 86. | Aline | 9.3% | 1.6%(+7.76)#86 | 1.2%(+8.12)#2,654 |
| 87. | Carmen | 9.3% | 1.6%(+7.74)#87 | 1.2%(+8.10)#2,658 |
| 88. | Foss | 9.3% | 1.6%(+7.74)#88 | 1.2%(+8.10)#2,660 |
| 89. | Haywood | 9.3% | 1.6%(+7.70)#89 | 1.2%(+8.06)#2,676 |
| 90. | Gage | 9.2% | 1.6%(+7.65)#90 | 1.2%(+8.01)#2,689 |
| 91. | Lebanon | 9.1% | 1.6%(+7.53)#91 | 1.2%(+7.89)#2,722 |
| 92. | Lamar | 9.1% | 1.6%(+7.53)#92 | 1.2%(+7.89)#2,725 |
| 93. | Roosevelt | 9.0% | 1.6%(+7.44)#93 | 1.2%(+7.80)#2,773 |
| 94. | Chattanooga | 9.0% | 1.6%(+7.42)#94 | 1.2%(+7.78)#2,780 |
| 95. | Hooker | 8.8% | 1.6%(+7.25)#95 | 1.2%(+7.61)#2,835 |
| 96. | Canton | 8.7% | 1.6%(+7.10)#96 | 1.2%(+7.47)#2,891 |
| 97. | Liberty | 8.6% | 1.6%(+7.01)#97 | 1.2%(+7.37)#2,926 |
| 98. | Lequire | 8.3% | 1.6%(+6.77)#98 | 1.2%(+7.13)#3,027 |
| 99. | Flute Springs | 8.3% | 1.6%(+6.77)#99 | 1.2%(+7.13)#3,031 |
| 100. | Kenwood | 8.2% | 1.6%(+6.63)#100 | 1.2%(+6.99)#3,073 |
Common Questions
What are the Top 10 Cities with the Highest Percentage of Population Employed in Agriculture, Fishing & Hunting in Oklahoma?
Top 10 Cities with the Highest Percentage of Population Employed in Agriculture, Fishing & Hunting in Oklahoma are:
What city has the Highest Percentage of Population Employed in Agriculture, Fishing & Hunting in Oklahoma?
Wardville has the Highest Percentage of Population Employed in Agriculture, Fishing & Hunting in Oklahoma with 100.0%.
What is the Percentage of Population Employed in Agriculture, Fishing & Hunting in the State of Oklahoma?
Percentage of Population Employed in Agriculture, Fishing & Hunting in Oklahoma is 1.6%.
What is the Percentage of Population Employed in Agriculture, Fishing & Hunting in the United States?
Percentage of Population Employed in Agriculture, Fishing & Hunting in the United States is 1.2%.