Zip Codes with the Highest Percentage of Population Employed in Agriculture, Fishing & Hunting in San Gabriel, CA
RELATED REPORTS & OPTIONS
Agriculture, Fishing & Hunting
San Gabriel
Compare Zip Codes
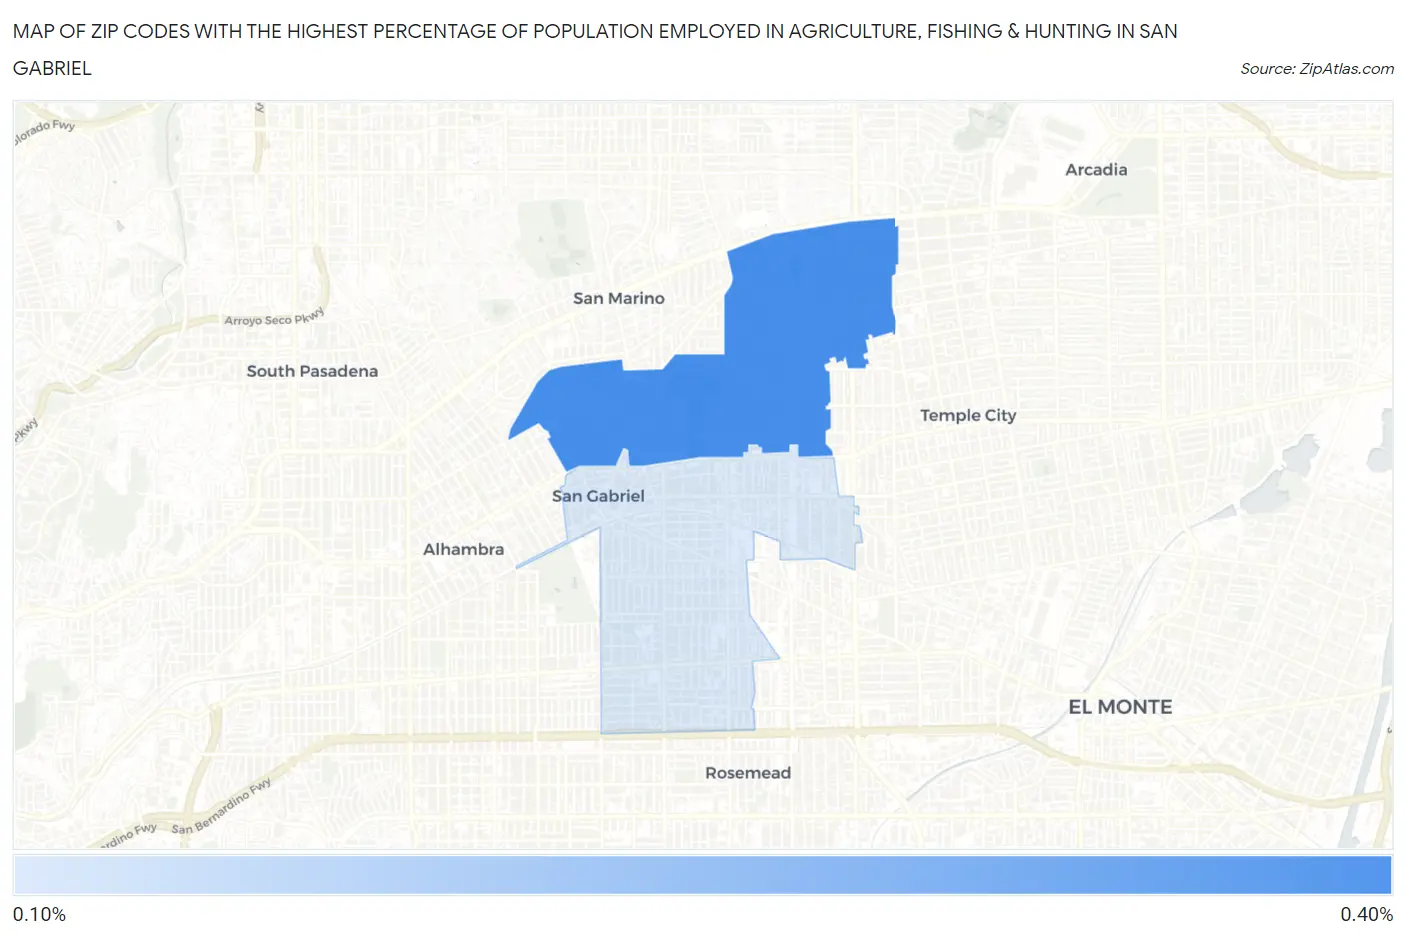
Map of Zip Codes with the Highest Percentage of Population Employed in Agriculture, Fishing & Hunting in San Gabriel
0.13%
0.33%
Zip Codes with the Highest Percentage of Population Employed in Agriculture, Fishing & Hunting in San Gabriel, CA
| Zip Code | % Employed | vs State | vs National | |
| 1. | 91775 | 0.33% | 2.0%(-1.66)#1,100 | 1.2%(-0.870)#20,853 |
| 2. | 91776 | 0.13% | 2.0%(-1.86)#1,298 | 1.2%(-1.07)#23,342 |
1
Common Questions
What are the Top Zip Codes with the Highest Percentage of Population Employed in Agriculture, Fishing & Hunting in San Gabriel, CA?
Top Zip Codes with the Highest Percentage of Population Employed in Agriculture, Fishing & Hunting in San Gabriel, CA are:
What zip code has the Highest Percentage of Population Employed in Agriculture, Fishing & Hunting in San Gabriel, CA?
91775 has the Highest Percentage of Population Employed in Agriculture, Fishing & Hunting in San Gabriel, CA with 0.33%.
What is the Percentage of Population Employed in Agriculture, Fishing & Hunting in San Gabriel, CA?
Percentage of Population Employed in Agriculture, Fishing & Hunting in San Gabriel is 0.078%.
What is the Percentage of Population Employed in Agriculture, Fishing & Hunting in California?
Percentage of Population Employed in Agriculture, Fishing & Hunting in California is 2.0%.
What is the Percentage of Population Employed in Agriculture, Fishing & Hunting in the United States?
Percentage of Population Employed in Agriculture, Fishing & Hunting in the United States is 1.2%.