Cities with the Highest Percentage of Population Employed in Agriculture, Fishing & Hunting in Illinois
RELATED REPORTS & OPTIONS
Agriculture, Fishing & Hunting
Illinois
Compare Cities
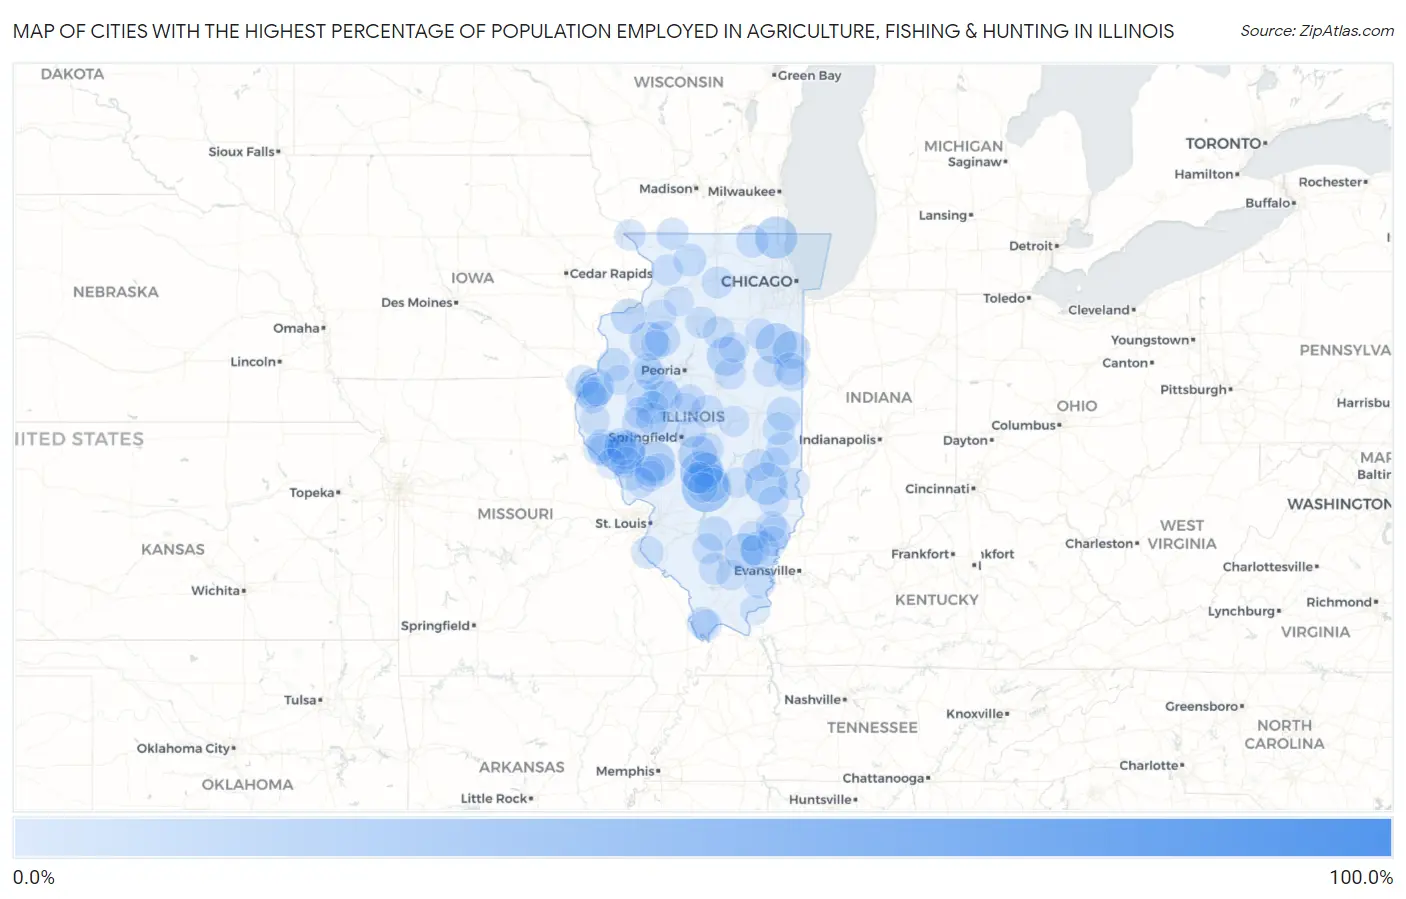
Map of Cities with the Highest Percentage of Population Employed in Agriculture, Fishing & Hunting in Illinois
0.0%
100.0%
Cities with the Highest Percentage of Population Employed in Agriculture, Fishing & Hunting in Illinois
| City | % Employed | vs State | vs National | |
| 1. | Beverly | 100.0% | 0.88%(+99.1)#1 | 1.2%(+98.8)#17 |
| 2. | Oxville | 100.0% | 0.88%(+99.1)#2 | 1.2%(+98.8)#45 |
| 3. | Fowler | 55.0% | 0.88%(+54.1)#3 | 1.2%(+53.8)#169 |
| 4. | Bingham | 35.1% | 0.88%(+34.2)#4 | 1.2%(+33.9)#387 |
| 5. | Nachusa | 25.7% | 0.88%(+24.8)#5 | 1.2%(+24.5)#696 |
| 6. | Wenonah | 25.0% | 0.88%(+24.1)#6 | 1.2%(+23.8)#729 |
| 7. | Old Mill Creek | 24.5% | 0.88%(+23.7)#7 | 1.2%(+23.3)#742 |
| 8. | Hidalgo | 24.3% | 0.88%(+23.4)#8 | 1.2%(+23.1)#753 |
| 9. | Irwin | 23.1% | 0.88%(+22.2)#9 | 1.2%(+21.9)#812 |
| 10. | Milton | 22.8% | 0.88%(+21.9)#10 | 1.2%(+21.6)#827 |
| 11. | Scottville | 21.4% | 0.88%(+20.6)#11 | 1.2%(+20.2)#909 |
| 12. | Florence | 20.0% | 0.88%(+19.1)#12 | 1.2%(+18.8)#1,020 |
| 13. | Flanagan | 19.9% | 0.88%(+19.1)#13 | 1.2%(+18.8)#1,023 |
| 14. | Langleyville | 19.6% | 0.88%(+18.8)#14 | 1.2%(+18.4)#1,039 |
| 15. | Oneida | 19.4% | 0.88%(+18.5)#15 | 1.2%(+18.2)#1,058 |
| 16. | Belle Prairie City | 19.2% | 0.88%(+18.4)#16 | 1.2%(+18.0)#1,070 |
| 17. | Burnt Prairie | 19.0% | 0.88%(+18.1)#17 | 1.2%(+17.8)#1,090 |
| 18. | Ferris | 18.8% | 0.88%(+17.9)#18 | 1.2%(+17.6)#1,106 |
| 19. | Papineau | 17.9% | 0.88%(+17.0)#19 | 1.2%(+16.7)#1,179 |
| 20. | Oak Grove | 15.0% | 0.88%(+14.2)#20 | 1.2%(+13.8)#1,482 |
| 21. | La Fayette | 14.9% | 0.88%(+14.0)#21 | 1.2%(+13.7)#1,494 |
| 22. | Liverpool | 14.0% | 0.88%(+13.1)#22 | 1.2%(+12.8)#1,613 |
| 23. | Walnut Hill | 13.8% | 0.88%(+12.9)#23 | 1.2%(+12.6)#1,630 |
| 24. | Ohlman | 13.8% | 0.88%(+12.9)#24 | 1.2%(+12.6)#1,631 |
| 25. | Ramsey | 13.7% | 0.88%(+12.8)#25 | 1.2%(+12.5)#1,638 |
| 26. | Muncie | 13.0% | 0.88%(+12.1)#26 | 1.2%(+11.8)#1,758 |
| 27. | Topeka | 12.5% | 0.88%(+11.6)#27 | 1.2%(+11.3)#1,841 |
| 28. | Media | 12.3% | 0.88%(+11.4)#28 | 1.2%(+11.1)#1,880 |
| 29. | Ipava | 12.1% | 0.88%(+11.2)#29 | 1.2%(+10.9)#1,898 |
| 30. | Hettick | 12.1% | 0.88%(+11.2)#30 | 1.2%(+10.9)#1,901 |
| 31. | El Dara | 11.8% | 0.88%(+10.9)#31 | 1.2%(+10.6)#1,962 |
| 32. | Bath | 11.4% | 0.88%(+10.5)#32 | 1.2%(+10.2)#2,057 |
| 33. | Redmon | 11.4% | 0.88%(+10.5)#33 | 1.2%(+10.2)#2,058 |
| 34. | Adeline | 11.4% | 0.88%(+10.5)#34 | 1.2%(+10.2)#2,059 |
| 35. | Greenwood | 10.9% | 0.88%(+10.0)#35 | 1.2%(+9.70)#2,174 |
| 36. | Allerton | 10.9% | 0.88%(+9.99)#36 | 1.2%(+9.67)#2,182 |
| 37. | Lake Carroll | 10.9% | 0.88%(+9.98)#37 | 1.2%(+9.66)#2,185 |
| 38. | Milford | 10.8% | 0.88%(+9.96)#38 | 1.2%(+9.64)#2,193 |
| 39. | Beason | 10.7% | 0.88%(+9.84)#39 | 1.2%(+9.51)#2,230 |
| 40. | Maeystown | 10.7% | 0.88%(+9.84)#40 | 1.2%(+9.51)#2,233 |
| 41. | North City | 10.6% | 0.88%(+9.69)#41 | 1.2%(+9.36)#2,263 |
| 42. | Nauvoo | 10.5% | 0.88%(+9.65)#42 | 1.2%(+9.33)#2,268 |
| 43. | Woodland | 10.4% | 0.88%(+9.50)#43 | 1.2%(+9.18)#2,313 |
| 44. | Chandlerville | 10.4% | 0.88%(+9.50)#44 | 1.2%(+9.17)#2,317 |
| 45. | Leonore | 10.3% | 0.88%(+9.42)#45 | 1.2%(+9.09)#2,351 |
| 46. | Lerna | 10.2% | 0.88%(+9.35)#46 | 1.2%(+9.03)#2,378 |
| 47. | Stonington | 10.1% | 0.88%(+9.26)#47 | 1.2%(+8.94)#2,395 |
| 48. | Fairview | 10.0% | 0.88%(+9.12)#48 | 1.2%(+8.80)#2,423 |
| 49. | West York | 9.9% | 0.88%(+9.01)#49 | 1.2%(+8.69)#2,472 |
| 50. | Ridgway | 9.8% | 0.88%(+8.96)#50 | 1.2%(+8.64)#2,483 |
| 51. | De Pue | 9.7% | 0.88%(+8.87)#51 | 1.2%(+8.55)#2,509 |
| 52. | Winslow | 9.7% | 0.88%(+8.85)#52 | 1.2%(+8.53)#2,514 |
| 53. | Barry | 9.6% | 0.88%(+8.77)#53 | 1.2%(+8.45)#2,534 |
| 54. | West Salem | 9.6% | 0.88%(+8.73)#54 | 1.2%(+8.41)#2,552 |
| 55. | Elvaston | 9.6% | 0.88%(+8.71)#55 | 1.2%(+8.39)#2,554 |
| 56. | Steward | 9.6% | 0.88%(+8.67)#56 | 1.2%(+8.35)#2,565 |
| 57. | Basco | 9.5% | 0.88%(+8.65)#57 | 1.2%(+8.32)#2,582 |
| 58. | New Canton | 9.4% | 0.88%(+8.50)#58 | 1.2%(+8.18)#2,633 |
| 59. | New Holland | 9.3% | 0.88%(+8.44)#59 | 1.2%(+8.12)#2,652 |
| 60. | Browning | 9.3% | 0.88%(+8.42)#60 | 1.2%(+8.10)#2,662 |
| 61. | Griggsville | 9.2% | 0.88%(+8.34)#61 | 1.2%(+8.02)#2,688 |
| 62. | Lexington | 9.0% | 0.88%(+8.08)#62 | 1.2%(+7.76)#2,787 |
| 63. | Witt | 8.9% | 0.88%(+8.02)#63 | 1.2%(+7.70)#2,803 |
| 64. | Tamms | 8.9% | 0.88%(+7.98)#64 | 1.2%(+7.66)#2,813 |
| 65. | Thawville | 8.9% | 0.88%(+7.98)#65 | 1.2%(+7.66)#2,814 |
| 66. | Pearl | 8.8% | 0.88%(+7.95)#66 | 1.2%(+7.62)#2,831 |
| 67. | Chadwick | 8.8% | 0.88%(+7.93)#67 | 1.2%(+7.61)#2,839 |
| 68. | Menominee | 8.8% | 0.88%(+7.92)#68 | 1.2%(+7.60)#2,841 |
| 69. | Pulaski | 8.7% | 0.88%(+7.87)#69 | 1.2%(+7.55)#2,856 |
| 70. | Atkinson | 8.7% | 0.88%(+7.80)#70 | 1.2%(+7.48)#2,881 |
| 71. | Emden | 8.7% | 0.88%(+7.79)#71 | 1.2%(+7.47)#2,889 |
| 72. | Beardstown | 8.6% | 0.88%(+7.76)#72 | 1.2%(+7.44)#2,904 |
| 73. | Cisco | 8.6% | 0.88%(+7.74)#73 | 1.2%(+7.42)#2,910 |
| 74. | Radom | 8.5% | 0.88%(+7.57)#74 | 1.2%(+7.25)#2,975 |
| 75. | Eldred | 8.3% | 0.88%(+7.46)#75 | 1.2%(+7.13)#3,025 |
| 76. | Rockbridge | 8.2% | 0.88%(+7.29)#76 | 1.2%(+6.96)#3,082 |
| 77. | Dawson | 8.1% | 0.88%(+7.25)#77 | 1.2%(+6.92)#3,093 |
| 78. | Greenfield | 8.0% | 0.88%(+7.16)#78 | 1.2%(+6.84)#3,129 |
| 79. | Parkersburg | 8.0% | 0.88%(+7.16)#79 | 1.2%(+6.84)#3,132 |
| 80. | Ste Marie | 8.0% | 0.88%(+7.15)#80 | 1.2%(+6.83)#3,133 |
| 81. | East Brooklyn | 8.0% | 0.88%(+7.12)#81 | 1.2%(+6.80)#3,144 |
| 82. | Thompsonville | 7.9% | 0.88%(+7.04)#82 | 1.2%(+6.72)#3,172 |
| 83. | London Mills | 7.9% | 0.88%(+7.04)#83 | 1.2%(+6.71)#3,174 |
| 84. | Jeffersonville | 7.8% | 0.88%(+6.93)#84 | 1.2%(+6.61)#3,205 |
| 85. | Coatsburg | 7.8% | 0.88%(+6.93)#85 | 1.2%(+6.61)#3,207 |
| 86. | Detroit | 7.7% | 0.88%(+6.81)#86 | 1.2%(+6.49)#3,281 |
| 87. | Albion | 7.6% | 0.88%(+6.77)#87 | 1.2%(+6.45)#3,297 |
| 88. | Cornell | 7.6% | 0.88%(+6.74)#88 | 1.2%(+6.42)#3,305 |
| 89. | Shumway | 7.5% | 0.88%(+6.67)#89 | 1.2%(+6.35)#3,339 |
| 90. | Carthage | 7.5% | 0.88%(+6.62)#90 | 1.2%(+6.30)#3,354 |
| 91. | Sciota | 7.5% | 0.88%(+6.62)#91 | 1.2%(+6.30)#3,362 |
| 92. | Mill Shoals | 7.5% | 0.88%(+6.59)#92 | 1.2%(+6.26)#3,382 |
| 93. | Deer Grove | 7.4% | 0.88%(+6.53)#93 | 1.2%(+6.21)#3,407 |
| 94. | Fillmore | 7.4% | 0.88%(+6.50)#94 | 1.2%(+6.18)#3,411 |
| 95. | Kane | 7.3% | 0.88%(+6.41)#95 | 1.2%(+6.09)#3,447 |
| 96. | Tallula | 7.3% | 0.88%(+6.40)#96 | 1.2%(+6.07)#3,454 |
| 97. | Pleasant Hill | 7.3% | 0.88%(+6.38)#97 | 1.2%(+6.06)#3,462 |
| 98. | Victoria | 7.2% | 0.88%(+6.37)#98 | 1.2%(+6.05)#3,472 |
| 99. | Rosiclare | 7.2% | 0.88%(+6.34)#99 | 1.2%(+6.02)#3,481 |
| 100. | Westfield | 7.2% | 0.88%(+6.33)#100 | 1.2%(+6.01)#3,484 |
Common Questions
What are the Top 10 Cities with the Highest Percentage of Population Employed in Agriculture, Fishing & Hunting in Illinois?
Top 10 Cities with the Highest Percentage of Population Employed in Agriculture, Fishing & Hunting in Illinois are:
#1
35.1%
#2
25.0%
#3
24.5%
#4
24.3%
#5
23.1%
#6
22.8%
#7
21.4%
#8
20.0%
#9
19.9%
#10
19.6%
What city has the Highest Percentage of Population Employed in Agriculture, Fishing & Hunting in Illinois?
Bingham has the Highest Percentage of Population Employed in Agriculture, Fishing & Hunting in Illinois with 35.1%.
What is the Percentage of Population Employed in Agriculture, Fishing & Hunting in the State of Illinois?
Percentage of Population Employed in Agriculture, Fishing & Hunting in Illinois is 0.88%.
What is the Percentage of Population Employed in Agriculture, Fishing & Hunting in the United States?
Percentage of Population Employed in Agriculture, Fishing & Hunting in the United States is 1.2%.