Cities with the Highest Percentage of Population Employed in Agriculture, Fishing & Hunting in Oregon
RELATED REPORTS & OPTIONS
Agriculture, Fishing & Hunting
Oregon
Compare Cities
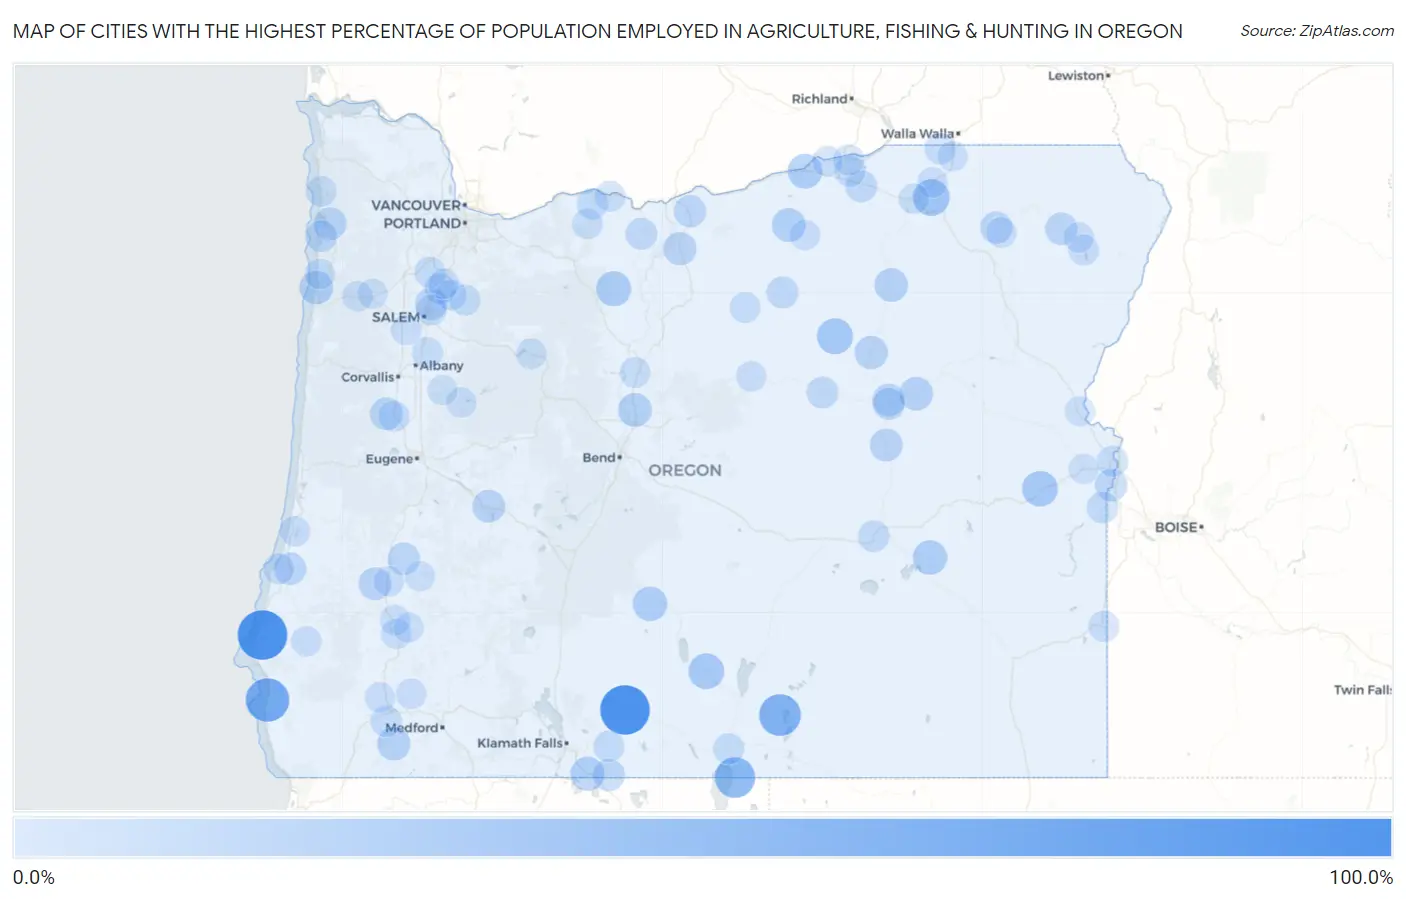
Map of Cities with the Highest Percentage of Population Employed in Agriculture, Fishing & Hunting in Oregon
0.0%
100.0%
Cities with the Highest Percentage of Population Employed in Agriculture, Fishing & Hunting in Oregon
| City | % Employed | vs State | vs National | |
| 1. | Langlois | 100.0% | 2.7%(+97.3)#1 | 1.2%(+98.8)#2 |
| 2. | Beatty | 100.0% | 2.7%(+97.3)#2 | 1.2%(+98.8)#53 |
| 3. | Nesika Beach | 70.0% | 2.7%(+67.3)#3 | 1.2%(+68.8)#103 |
| 4. | Plush | 61.0% | 2.7%(+58.3)#4 | 1.2%(+59.8)#132 |
| 5. | New Pine Creek | 54.3% | 2.7%(+51.6)#5 | 1.2%(+53.1)#176 |
| 6. | Mckay | 44.6% | 2.7%(+41.9)#6 | 1.2%(+43.4)#242 |
| 7. | Gilchrist | 38.4% | 2.7%(+35.6)#7 | 1.2%(+37.2)#331 |
| 8. | Cayuse | 36.8% | 2.7%(+34.1)#8 | 1.2%(+35.6)#354 |
| 9. | Monument | 32.8% | 2.7%(+30.1)#9 | 1.2%(+31.6)#445 |
| 10. | Paisley | 31.7% | 2.7%(+29.0)#10 | 1.2%(+30.5)#470 |
| 11. | Harper | 31.4% | 2.7%(+28.7)#11 | 1.2%(+30.2)#478 |
| 12. | Pine Grove | 28.6% | 2.7%(+25.8)#12 | 1.2%(+27.4)#579 |
| 13. | Boardman | 26.8% | 2.7%(+24.1)#13 | 1.2%(+25.6)#648 |
| 14. | Silver Lake | 26.1% | 2.7%(+23.4)#14 | 1.2%(+24.9)#677 |
| 15. | Crane | 25.6% | 2.7%(+22.8)#15 | 1.2%(+24.4)#699 |
| 16. | Merrill | 24.1% | 2.7%(+21.4)#16 | 1.2%(+22.9)#759 |
| 17. | Neskowin | 23.0% | 2.7%(+20.3)#17 | 1.2%(+21.8)#819 |
| 18. | Ione | 22.8% | 2.7%(+20.1)#18 | 1.2%(+21.6)#826 |
| 19. | Terrebonne | 22.6% | 2.7%(+19.9)#19 | 1.2%(+21.4)#834 |
| 20. | Prairie City | 22.0% | 2.7%(+19.3)#20 | 1.2%(+20.8)#883 |
| 21. | Ukiah | 21.7% | 2.7%(+19.0)#21 | 1.2%(+20.5)#895 |
| 22. | Pleasant Valley | 21.2% | 2.7%(+18.5)#22 | 1.2%(+20.0)#926 |
| 23. | Williams | 20.5% | 2.7%(+17.8)#23 | 1.2%(+19.3)#969 |
| 24. | Long Creek | 20.5% | 2.7%(+17.7)#24 | 1.2%(+19.3)#973 |
| 25. | Grass Valley | 19.2% | 2.7%(+16.4)#25 | 1.2%(+18.0)#1,077 |
| 26. | Oakridge | 18.6% | 2.7%(+15.9)#26 | 1.2%(+17.4)#1,119 |
| 27. | Seneca | 18.4% | 2.7%(+15.7)#27 | 1.2%(+17.2)#1,130 |
| 28. | Melrose | 18.2% | 2.7%(+15.5)#28 | 1.2%(+17.0)#1,139 |
| 29. | Idaville | 17.9% | 2.7%(+15.2)#29 | 1.2%(+16.7)#1,166 |
| 30. | John Day | 17.6% | 2.7%(+14.9)#30 | 1.2%(+16.4)#1,202 |
| 31. | Alpine | 17.0% | 2.7%(+14.3)#31 | 1.2%(+15.8)#1,265 |
| 32. | Fair Oaks | 16.9% | 2.7%(+14.2)#32 | 1.2%(+15.7)#1,272 |
| 33. | Bunker Hill | 16.8% | 2.7%(+14.0)#33 | 1.2%(+15.6)#1,283 |
| 34. | Lostine | 16.2% | 2.7%(+13.5)#34 | 1.2%(+15.0)#1,352 |
| 35. | Labish Village | 16.1% | 2.7%(+13.3)#35 | 1.2%(+14.9)#1,373 |
| 36. | Wasco | 15.6% | 2.7%(+12.9)#36 | 1.2%(+14.4)#1,414 |
| 37. | Malin | 15.5% | 2.7%(+12.8)#37 | 1.2%(+14.3)#1,430 |
| 38. | Nyssa | 15.4% | 2.7%(+12.7)#38 | 1.2%(+14.2)#1,432 |
| 39. | Summerville | 15.3% | 2.7%(+12.5)#39 | 1.2%(+14.1)#1,459 |
| 40. | Canyon City | 15.2% | 2.7%(+12.4)#40 | 1.2%(+14.0)#1,466 |
| 41. | Lonerock | 14.3% | 2.7%(+11.6)#41 | 1.2%(+13.1)#1,582 |
| 42. | Echo | 13.8% | 2.7%(+11.1)#42 | 1.2%(+12.6)#1,633 |
| 43. | Dufur | 13.8% | 2.7%(+11.0)#43 | 1.2%(+12.6)#1,635 |
| 44. | Netarts | 13.6% | 2.7%(+10.9)#44 | 1.2%(+12.4)#1,644 |
| 45. | San Marine | 13.6% | 2.7%(+10.9)#45 | 1.2%(+12.4)#1,655 |
| 46. | Dayville | 13.5% | 2.7%(+10.7)#46 | 1.2%(+12.3)#1,677 |
| 47. | Adrian | 12.9% | 2.7%(+10.2)#47 | 1.2%(+11.7)#1,770 |
| 48. | Hines | 12.5% | 2.7%(+9.81)#48 | 1.2%(+11.3)#1,820 |
| 49. | Odell | 11.5% | 2.7%(+8.81)#49 | 1.2%(+10.3)#2,016 |
| 50. | Gervais | 11.4% | 2.7%(+8.67)#50 | 1.2%(+10.2)#2,053 |
| 51. | New Hope | 11.1% | 2.7%(+8.42)#51 | 1.2%(+9.94)#2,107 |
| 52. | Lakeview | 10.8% | 2.7%(+8.10)#52 | 1.2%(+9.62)#2,196 |
| 53. | Bonanza | 10.8% | 2.7%(+8.05)#53 | 1.2%(+9.57)#2,212 |
| 54. | Umapine | 10.7% | 2.7%(+7.96)#54 | 1.2%(+9.48)#2,237 |
| 55. | Monroe | 10.3% | 2.7%(+7.56)#55 | 1.2%(+9.08)#2,353 |
| 56. | St Paul | 10.2% | 2.7%(+7.46)#56 | 1.2%(+8.99)#2,391 |
| 57. | Ontario | 10.1% | 2.7%(+7.41)#57 | 1.2%(+8.94)#2,396 |
| 58. | Scotts Mills | 10.1% | 2.7%(+7.39)#58 | 1.2%(+8.91)#2,403 |
| 59. | Hermiston | 10.0% | 2.7%(+7.29)#59 | 1.2%(+8.82)#2,419 |
| 60. | Jefferson | 9.7% | 2.7%(+7.00)#60 | 1.2%(+8.53)#2,516 |
| 61. | Mount Angel | 9.6% | 2.7%(+6.89)#61 | 1.2%(+8.42)#2,548 |
| 62. | Umatilla | 9.5% | 2.7%(+6.77)#62 | 1.2%(+8.30)#2,591 |
| 63. | Manzanita | 9.3% | 2.7%(+6.61)#63 | 1.2%(+8.13)#2,647 |
| 64. | Fossil | 9.3% | 2.7%(+6.58)#64 | 1.2%(+8.10)#2,657 |
| 65. | Barview | 9.1% | 2.7%(+6.37)#65 | 1.2%(+7.89)#2,714 |
| 66. | Jordan Valley | 9.1% | 2.7%(+6.37)#66 | 1.2%(+7.89)#2,734 |
| 67. | Parkdale | 9.0% | 2.7%(+6.28)#67 | 1.2%(+7.80)#2,774 |
| 68. | Hayesville | 8.8% | 2.7%(+6.11)#68 | 1.2%(+7.64)#2,821 |
| 69. | Mosier | 8.8% | 2.7%(+6.10)#69 | 1.2%(+7.62)#2,824 |
| 70. | Metolius | 8.8% | 2.7%(+6.06)#70 | 1.2%(+7.59)#2,843 |
| 71. | Joseph | 8.5% | 2.7%(+5.75)#71 | 1.2%(+7.28)#2,957 |
| 72. | Woodburn | 8.2% | 2.7%(+5.44)#72 | 1.2%(+6.96)#3,084 |
| 73. | Myrtle Creek | 8.0% | 2.7%(+5.28)#73 | 1.2%(+6.81)#3,136 |
| 74. | Imbler | 7.9% | 2.7%(+5.16)#74 | 1.2%(+6.68)#3,185 |
| 75. | Lexington | 7.8% | 2.7%(+5.12)#75 | 1.2%(+6.64)#3,197 |
| 76. | Irrigon | 7.8% | 2.7%(+5.08)#76 | 1.2%(+6.60)#3,216 |
| 77. | Grand Ronde | 7.7% | 2.7%(+4.99)#77 | 1.2%(+6.52)#3,243 |
| 78. | Adams | 7.7% | 2.7%(+4.97)#78 | 1.2%(+6.49)#3,253 |
| 79. | Pacific City | 7.6% | 2.7%(+4.83)#79 | 1.2%(+6.36)#3,328 |
| 80. | Roseburg North | 7.5% | 2.7%(+4.79)#80 | 1.2%(+6.32)#3,348 |
| 81. | Wimer | 7.5% | 2.7%(+4.76)#81 | 1.2%(+6.28)#3,369 |
| 82. | Independence | 7.4% | 2.7%(+4.73)#82 | 1.2%(+6.25)#3,386 |
| 83. | Powers | 7.4% | 2.7%(+4.67)#83 | 1.2%(+6.19)#3,409 |
| 84. | Canyonville | 7.3% | 2.7%(+4.58)#84 | 1.2%(+6.11)#3,442 |
| 85. | Idanha | 7.3% | 2.7%(+4.55)#85 | 1.2%(+6.07)#3,457 |
| 86. | Sweet Home | 7.1% | 2.7%(+4.38)#86 | 1.2%(+5.90)#3,554 |
| 87. | Enterprise | 7.0% | 2.7%(+4.32)#87 | 1.2%(+5.85)#3,574 |
| 88. | Gopher Flats | 7.0% | 2.7%(+4.27)#88 | 1.2%(+5.79)#3,603 |
| 89. | Mitchell | 6.9% | 2.7%(+4.22)#89 | 1.2%(+5.75)#3,632 |
| 90. | Keno | 6.9% | 2.7%(+4.17)#90 | 1.2%(+5.70)#3,649 |
| 91. | Merlin | 6.8% | 2.7%(+4.06)#91 | 1.2%(+5.58)#3,700 |
| 92. | Lakeside | 6.7% | 2.7%(+4.02)#92 | 1.2%(+5.55)#3,719 |
| 93. | Days Creek | 6.6% | 2.7%(+3.83)#93 | 1.2%(+5.36)#3,820 |
| 94. | Huntington | 6.5% | 2.7%(+3.82)#94 | 1.2%(+5.34)#3,825 |
| 95. | Milton Freewater | 6.5% | 2.7%(+3.73)#95 | 1.2%(+5.25)#3,864 |
| 96. | Willamina | 6.4% | 2.7%(+3.67)#96 | 1.2%(+5.19)#3,897 |
| 97. | Sodaville | 6.3% | 2.7%(+3.61)#97 | 1.2%(+5.14)#3,929 |
| 98. | Glide | 6.1% | 2.7%(+3.36)#98 | 1.2%(+4.88)#4,068 |
| 99. | Vale | 6.0% | 2.7%(+3.24)#99 | 1.2%(+4.77)#4,140 |
| 100. | Bayshore | 5.9% | 2.7%(+3.22)#100 | 1.2%(+4.74)#4,152 |
Common Questions
What are the Top 10 Cities with the Highest Percentage of Population Employed in Agriculture, Fishing & Hunting in Oregon?
Top 10 Cities with the Highest Percentage of Population Employed in Agriculture, Fishing & Hunting in Oregon are:
#1
100.0%
#2
100.0%
#3
70.0%
#4
61.0%
#5
54.3%
#6
36.8%
#7
32.8%
#8
31.7%
#9
31.4%
#10
28.6%
What city has the Highest Percentage of Population Employed in Agriculture, Fishing & Hunting in Oregon?
Langlois has the Highest Percentage of Population Employed in Agriculture, Fishing & Hunting in Oregon with 100.0%.
What is the Percentage of Population Employed in Agriculture, Fishing & Hunting in the State of Oregon?
Percentage of Population Employed in Agriculture, Fishing & Hunting in Oregon is 2.7%.
What is the Percentage of Population Employed in Agriculture, Fishing & Hunting in the United States?
Percentage of Population Employed in Agriculture, Fishing & Hunting in the United States is 1.2%.