Cities with the Highest Percentage of Population Employed in Agriculture, Fishing & Hunting in Kentucky
RELATED REPORTS & OPTIONS
Agriculture, Fishing & Hunting
Kentucky
Compare Cities
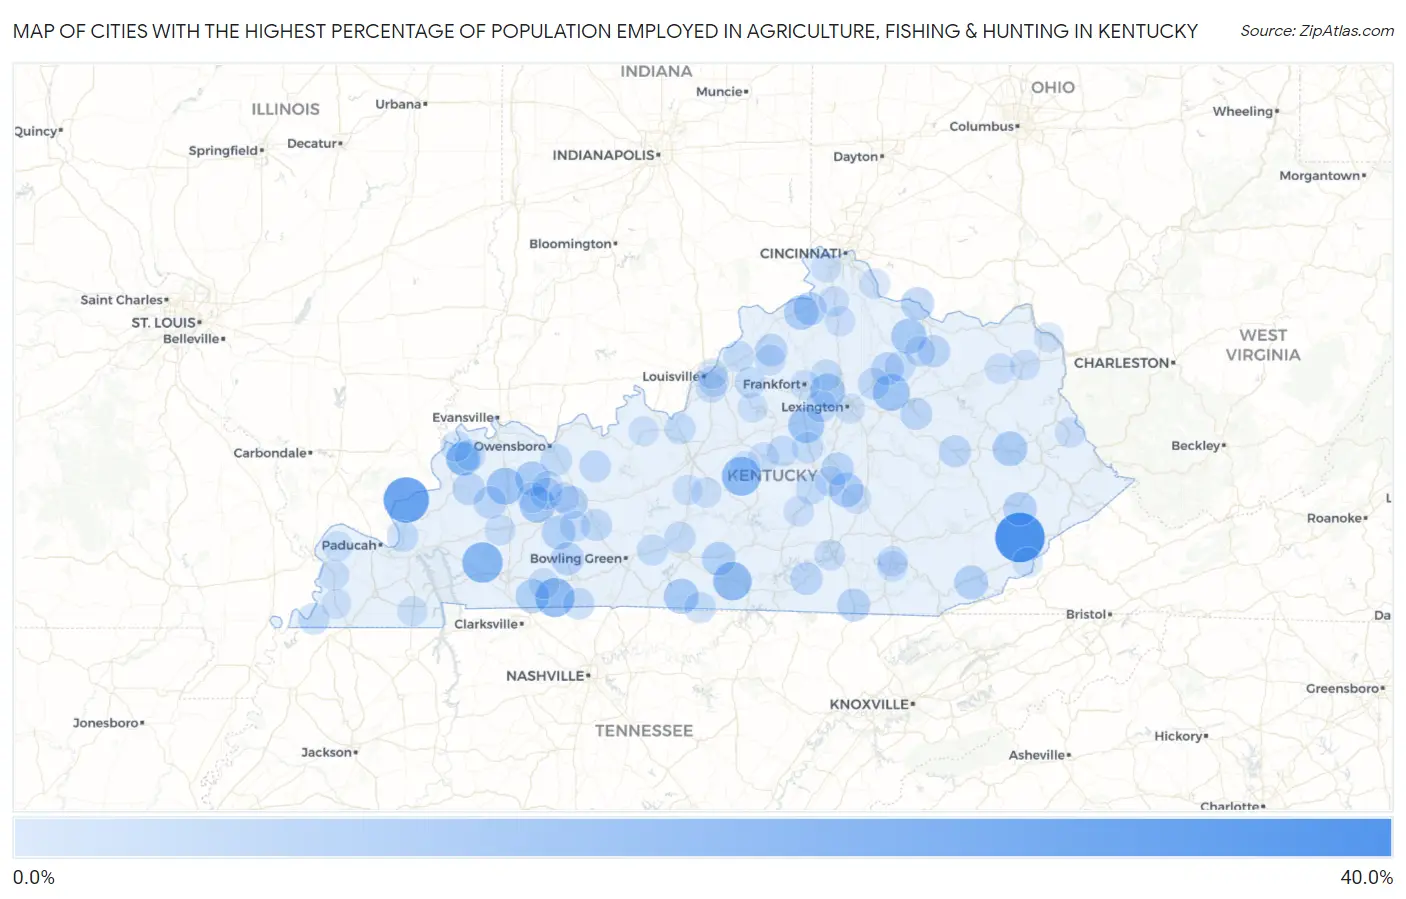
Map of Cities with the Highest Percentage of Population Employed in Agriculture, Fishing & Hunting in Kentucky
0.0%
40.0%
Cities with the Highest Percentage of Population Employed in Agriculture, Fishing & Hunting in Kentucky
| City | % Employed | vs State | vs National | |
| 1. | Blackey | 31.8% | 1.3%(+30.5)#1 | 1.2%(+30.6)#464 |
| 2. | Carrsville | 25.0% | 1.3%(+23.7)#2 | 1.2%(+23.8)#725 |
| 3. | Cerulean | 17.1% | 1.3%(+15.8)#3 | 1.2%(+15.9)#1,258 |
| 4. | Allensville | 15.1% | 1.3%(+13.8)#4 | 1.2%(+13.9)#1,478 |
| 5. | Raywick | 14.8% | 1.3%(+13.4)#5 | 1.2%(+13.6)#1,512 |
| 6. | Marrowbone | 14.0% | 1.3%(+12.7)#6 | 1.2%(+12.8)#1,607 |
| 7. | Slaughters | 11.5% | 1.3%(+10.2)#7 | 1.2%(+10.3)#2,019 |
| 8. | North Middletown | 11.5% | 1.3%(+10.1)#8 | 1.2%(+10.3)#2,039 |
| 9. | Salvisa | 10.4% | 1.3%(+9.06)#9 | 1.2%(+9.18)#2,314 |
| 10. | Bremen | 9.6% | 1.3%(+8.31)#10 | 1.2%(+8.43)#2,545 |
| 11. | Sardis | 9.1% | 1.3%(+7.78)#11 | 1.2%(+7.89)#2,741 |
| 12. | Midway | 9.0% | 1.3%(+7.71)#12 | 1.2%(+7.83)#2,764 |
| 13. | Fountain Run | 8.6% | 1.3%(+7.32)#13 | 1.2%(+7.43)#2,906 |
| 14. | Calhoun | 8.4% | 1.3%(+7.13)#14 | 1.2%(+7.25)#2,976 |
| 15. | Salyersville | 8.3% | 1.3%(+6.96)#15 | 1.2%(+7.07)#3,049 |
| 16. | Crab Orchard | 8.1% | 1.3%(+6.75)#16 | 1.2%(+6.87)#3,118 |
| 17. | Sparta | 7.9% | 1.3%(+6.58)#17 | 1.2%(+6.70)#3,182 |
| 18. | Breckinridge Center | 7.8% | 1.3%(+6.45)#18 | 1.2%(+6.57)#3,223 |
| 19. | South Wallins | 7.0% | 1.3%(+5.65)#19 | 1.2%(+5.77)#3,620 |
| 20. | Trenton | 6.9% | 1.3%(+5.60)#20 | 1.2%(+5.72)#3,643 |
| 21. | Edmonton | 6.6% | 1.3%(+5.28)#21 | 1.2%(+5.40)#3,803 |
| 22. | Beechmont | 6.6% | 1.3%(+5.25)#22 | 1.2%(+5.37)#3,814 |
| 23. | Hindman | 6.2% | 1.3%(+4.90)#23 | 1.2%(+5.01)#3,993 |
| 24. | Glencoe | 5.9% | 1.3%(+4.57)#24 | 1.2%(+4.68)#4,184 |
| 25. | Lewisburg | 5.8% | 1.3%(+4.46)#25 | 1.2%(+4.58)#4,256 |
| 26. | Dover | 5.7% | 1.3%(+4.35)#26 | 1.2%(+4.46)#4,332 |
| 27. | Mchenry | 5.6% | 1.3%(+4.28)#27 | 1.2%(+4.39)#4,395 |
| 28. | Pine Knot | 5.6% | 1.3%(+4.26)#28 | 1.2%(+4.38)#4,405 |
| 29. | Morganfield | 5.4% | 1.3%(+4.07)#29 | 1.2%(+4.18)#4,550 |
| 30. | Millersburg | 5.3% | 1.3%(+3.95)#30 | 1.2%(+4.06)#4,629 |
| 31. | Lancaster | 5.1% | 1.3%(+3.75)#31 | 1.2%(+3.86)#4,787 |
| 32. | Clay | 4.9% | 1.3%(+3.61)#32 | 1.2%(+3.73)#4,888 |
| 33. | Monticello | 4.9% | 1.3%(+3.57)#33 | 1.2%(+3.69)#4,922 |
| 34. | New Castle | 4.8% | 1.3%(+3.52)#34 | 1.2%(+3.63)#4,973 |
| 35. | Nebo | 4.8% | 1.3%(+3.45)#35 | 1.2%(+3.56)#5,033 |
| 36. | Flemingsburg | 4.5% | 1.3%(+3.23)#36 | 1.2%(+3.34)#5,222 |
| 37. | Sorgho | 4.4% | 1.3%(+3.12)#37 | 1.2%(+3.23)#5,326 |
| 38. | Camargo | 4.2% | 1.3%(+2.85)#38 | 1.2%(+2.97)#5,585 |
| 39. | Campton | 4.2% | 1.3%(+2.85)#39 | 1.2%(+2.97)#5,594 |
| 40. | Morgantown | 3.9% | 1.3%(+2.63)#40 | 1.2%(+2.75)#5,821 |
| 41. | Island | 3.9% | 1.3%(+2.61)#41 | 1.2%(+2.72)#5,855 |
| 42. | Versailles | 3.9% | 1.3%(+2.54)#42 | 1.2%(+2.65)#5,922 |
| 43. | Paris | 3.7% | 1.3%(+2.34)#43 | 1.2%(+2.45)#6,190 |
| 44. | Fordsville | 3.6% | 1.3%(+2.31)#44 | 1.2%(+2.43)#6,219 |
| 45. | Adairville | 3.5% | 1.3%(+2.19)#45 | 1.2%(+2.31)#6,362 |
| 46. | Smithland | 3.5% | 1.3%(+2.16)#46 | 1.2%(+2.28)#6,388 |
| 47. | Masonville | 3.5% | 1.3%(+2.16)#47 | 1.2%(+2.27)#6,396 |
| 48. | Gamaliel | 3.2% | 1.3%(+1.93)#48 | 1.2%(+2.04)#6,708 |
| 49. | Hickman | 3.2% | 1.3%(+1.90)#49 | 1.2%(+2.01)#6,752 |
| 50. | Stamping Ground | 3.0% | 1.3%(+1.70)#50 | 1.2%(+1.82)#7,016 |
| 51. | Cave City | 3.0% | 1.3%(+1.69)#51 | 1.2%(+1.80)#7,035 |
| 52. | Simpsonville | 2.8% | 1.3%(+1.53)#52 | 1.2%(+1.65)#7,278 |
| 53. | Buckner | 2.8% | 1.3%(+1.46)#53 | 1.2%(+1.58)#7,366 |
| 54. | Harrodsburg | 2.8% | 1.3%(+1.45)#54 | 1.2%(+1.57)#7,396 |
| 55. | Smiths Grove | 2.8% | 1.3%(+1.45)#55 | 1.2%(+1.56)#7,403 |
| 56. | Thruston | 2.7% | 1.3%(+1.41)#56 | 1.2%(+1.52)#7,462 |
| 57. | Waverly | 2.7% | 1.3%(+1.41)#57 | 1.2%(+1.52)#7,467 |
| 58. | Hustonville | 2.7% | 1.3%(+1.35)#58 | 1.2%(+1.47)#7,548 |
| 59. | Mackville | 2.6% | 1.3%(+1.29)#59 | 1.2%(+1.41)#7,656 |
| 60. | Fort Knox | 2.6% | 1.3%(+1.27)#60 | 1.2%(+1.39)#7,691 |
| 61. | Uniontown | 2.6% | 1.3%(+1.24)#61 | 1.2%(+1.36)#7,749 |
| 62. | Carlisle | 2.4% | 1.3%(+1.12)#62 | 1.2%(+1.24)#7,942 |
| 63. | Burnside | 2.4% | 1.3%(+1.09)#63 | 1.2%(+1.20)#8,032 |
| 64. | Eminence | 2.4% | 1.3%(+1.05)#64 | 1.2%(+1.16)#8,116 |
| 65. | Sacramento | 2.3% | 1.3%(+0.941)#65 | 1.2%(+1.06)#8,316 |
| 66. | Corbin | 2.2% | 1.3%(+0.905)#66 | 1.2%(+1.02)#8,399 |
| 67. | Bardwell | 2.2% | 1.3%(+0.859)#67 | 1.2%(+0.975)#8,496 |
| 68. | Rochester | 2.2% | 1.3%(+0.859)#68 | 1.2%(+0.975)#8,507 |
| 69. | Poplar Hills | 2.1% | 1.3%(+0.820)#69 | 1.2%(+0.936)#8,572 |
| 70. | Kingsley | 2.1% | 1.3%(+0.786)#70 | 1.2%(+0.901)#8,643 |
| 71. | Ewing | 2.0% | 1.3%(+0.665)#71 | 1.2%(+0.781)#8,895 |
| 72. | Elkton | 2.0% | 1.3%(+0.664)#72 | 1.2%(+0.780)#8,899 |
| 73. | Livermore | 2.0% | 1.3%(+0.661)#73 | 1.2%(+0.777)#8,906 |
| 74. | St Charles | 2.0% | 1.3%(+0.646)#74 | 1.2%(+0.761)#8,937 |
| 75. | Stanford | 1.9% | 1.3%(+0.596)#75 | 1.2%(+0.711)#9,054 |
| 76. | Olive Hill | 1.9% | 1.3%(+0.569)#76 | 1.2%(+0.685)#9,127 |
| 77. | North Corbin | 1.8% | 1.3%(+0.532)#77 | 1.2%(+0.648)#9,216 |
| 78. | Springfield | 1.8% | 1.3%(+0.518)#78 | 1.2%(+0.634)#9,245 |
| 79. | Grayson | 1.8% | 1.3%(+0.484)#79 | 1.2%(+0.600)#9,324 |
| 80. | Inez | 1.8% | 1.3%(+0.450)#80 | 1.2%(+0.565)#9,398 |
| 81. | Magnolia | 1.8% | 1.3%(+0.445)#81 | 1.2%(+0.560)#9,415 |
| 82. | Mockingbird Valley | 1.7% | 1.3%(+0.409)#82 | 1.2%(+0.525)#9,510 |
| 83. | Centertown | 1.7% | 1.3%(+0.352)#83 | 1.2%(+0.467)#9,643 |
| 84. | Mentor | 1.7% | 1.3%(+0.338)#84 | 1.2%(+0.454)#9,694 |
| 85. | Crittenden | 1.6% | 1.3%(+0.259)#85 | 1.2%(+0.375)#9,896 |
| 86. | Murray | 1.6% | 1.3%(+0.249)#86 | 1.2%(+0.365)#9,917 |
| 87. | Upton | 1.5% | 1.3%(+0.228)#87 | 1.2%(+0.344)#9,974 |
| 88. | Liberty | 1.5% | 1.3%(+0.219)#88 | 1.2%(+0.335)#10,005 |
| 89. | Williamstown | 1.5% | 1.3%(+0.179)#89 | 1.2%(+0.294)#10,122 |
| 90. | Loretto | 1.5% | 1.3%(+0.140)#90 | 1.2%(+0.255)#10,241 |
| 91. | La Center | 1.4% | 1.3%(+0.134)#91 | 1.2%(+0.250)#10,254 |
| 92. | Frankfort | 1.4% | 1.3%(+0.118)#92 | 1.2%(+0.234)#10,302 |
| 93. | Taylorsville | 1.4% | 1.3%(+0.109)#93 | 1.2%(+0.225)#10,331 |
| 94. | Lynch | 1.4% | 1.3%(+0.068)#94 | 1.2%(+0.183)#10,436 |
| 95. | Lexington | 1.3% | 1.3%(-0.028)#95 | 1.2%(+0.087)#10,747 |
| 96. | Brodhead | 1.3% | 1.3%(-0.044)#96 | 1.2%(+0.072)#10,791 |
| 97. | Oakbrook | 1.2% | 1.3%(-0.096)#97 | 1.2%(+0.020)#10,957 |
| 98. | Flatwoods | 1.2% | 1.3%(-0.115)#98 | 1.2%(+0.000)#11,032 |
| 99. | Irvington | 1.2% | 1.3%(-0.118)#99 | 1.2%(-0.003)#11,051 |
| 100. | Clinton | 1.2% | 1.3%(-0.135)#100 | 1.2%(-0.019)#11,118 |
Common Questions
What are the Top 10 Cities with the Highest Percentage of Population Employed in Agriculture, Fishing & Hunting in Kentucky?
Top 10 Cities with the Highest Percentage of Population Employed in Agriculture, Fishing & Hunting in Kentucky are:
#1
31.8%
#2
25.0%
#3
17.1%
#4
15.1%
#5
14.8%
#6
14.0%
#7
11.5%
#8
11.5%
#9
10.4%
#10
9.6%
What city has the Highest Percentage of Population Employed in Agriculture, Fishing & Hunting in Kentucky?
Blackey has the Highest Percentage of Population Employed in Agriculture, Fishing & Hunting in Kentucky with 31.8%.
What is the Percentage of Population Employed in Agriculture, Fishing & Hunting in the State of Kentucky?
Percentage of Population Employed in Agriculture, Fishing & Hunting in Kentucky is 1.3%.
What is the Percentage of Population Employed in Agriculture, Fishing & Hunting in the United States?
Percentage of Population Employed in Agriculture, Fishing & Hunting in the United States is 1.2%.