Zip Codes with the Highest Percentage of Population Employed in Agriculture, Fishing & Hunting in Desert Hot Springs, CA
RELATED REPORTS & OPTIONS
Agriculture, Fishing & Hunting
Desert Hot Springs
Compare Zip Codes
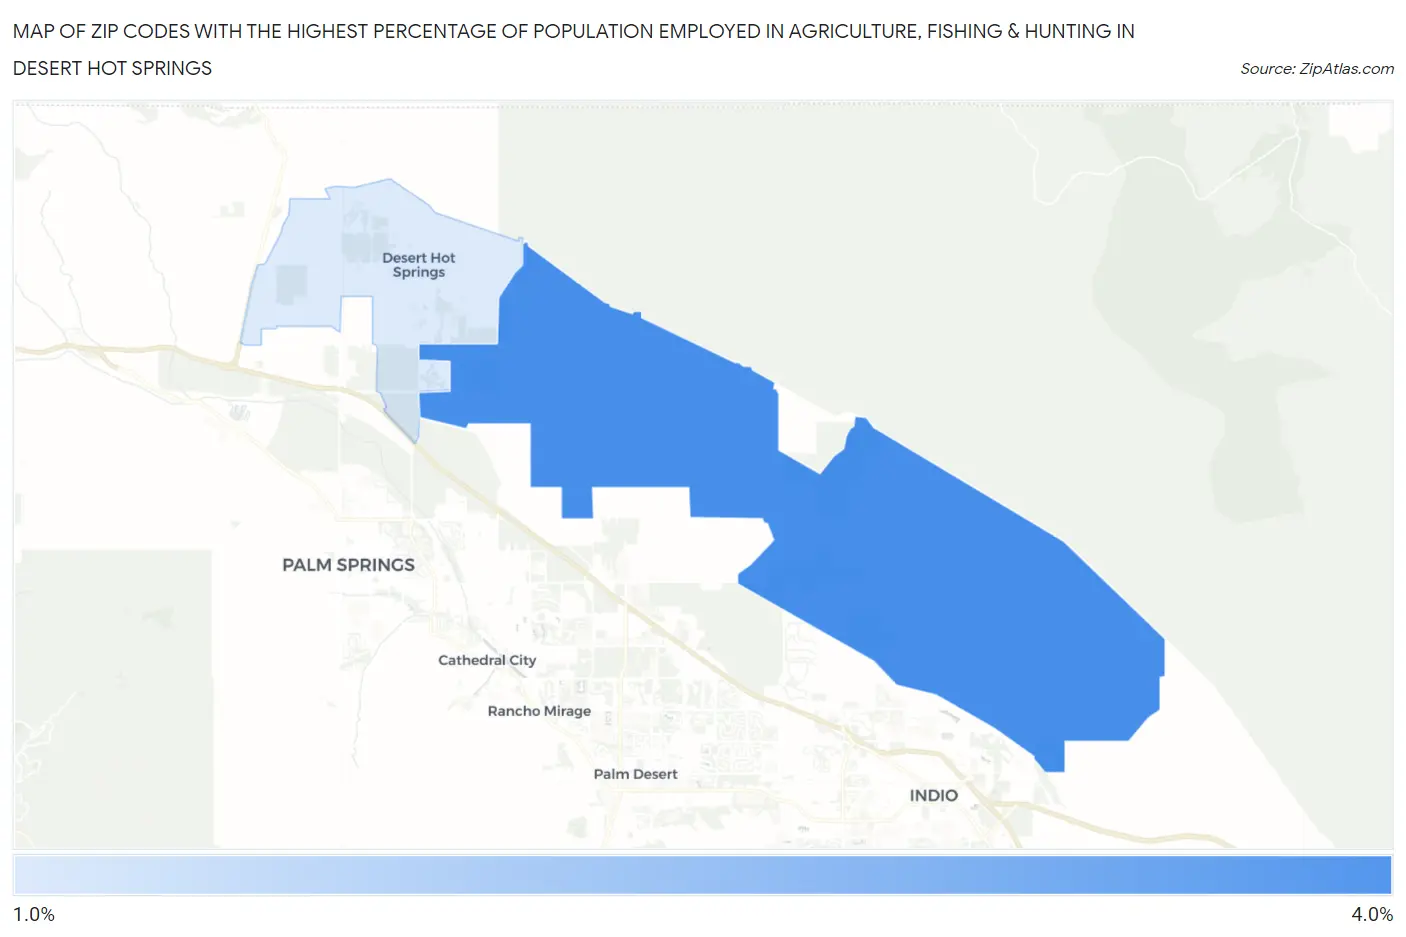
Map of Zip Codes with the Highest Percentage of Population Employed in Agriculture, Fishing & Hunting in Desert Hot Springs
1.3%
3.1%
Zip Codes with the Highest Percentage of Population Employed in Agriculture, Fishing & Hunting in Desert Hot Springs, CA
| Zip Code | % Employed | vs State | vs National | |
| 1. | 92241 | 3.1% | 2.0%(+1.13)#477 | 1.2%(+1.92)#10,357 |
| 2. | 92240 | 1.3% | 2.0%(-0.735)#672 | 1.2%(+0.051)#15,209 |
1
Common Questions
What are the Top Zip Codes with the Highest Percentage of Population Employed in Agriculture, Fishing & Hunting in Desert Hot Springs, CA?
Top Zip Codes with the Highest Percentage of Population Employed in Agriculture, Fishing & Hunting in Desert Hot Springs, CA are:
What zip code has the Highest Percentage of Population Employed in Agriculture, Fishing & Hunting in Desert Hot Springs, CA?
92241 has the Highest Percentage of Population Employed in Agriculture, Fishing & Hunting in Desert Hot Springs, CA with 3.1%.
What is the Percentage of Population Employed in Agriculture, Fishing & Hunting in Desert Hot Springs, CA?
Percentage of Population Employed in Agriculture, Fishing & Hunting in Desert Hot Springs is 1.2%.
What is the Percentage of Population Employed in Agriculture, Fishing & Hunting in California?
Percentage of Population Employed in Agriculture, Fishing & Hunting in California is 2.0%.
What is the Percentage of Population Employed in Agriculture, Fishing & Hunting in the United States?
Percentage of Population Employed in Agriculture, Fishing & Hunting in the United States is 1.2%.