Zip Codes with the Highest Percentage of Population Employed in Agriculture, Fishing & Hunting in Citrus Heights, CA
RELATED REPORTS & OPTIONS
Agriculture, Fishing & Hunting
Citrus Heights
Compare Zip Codes
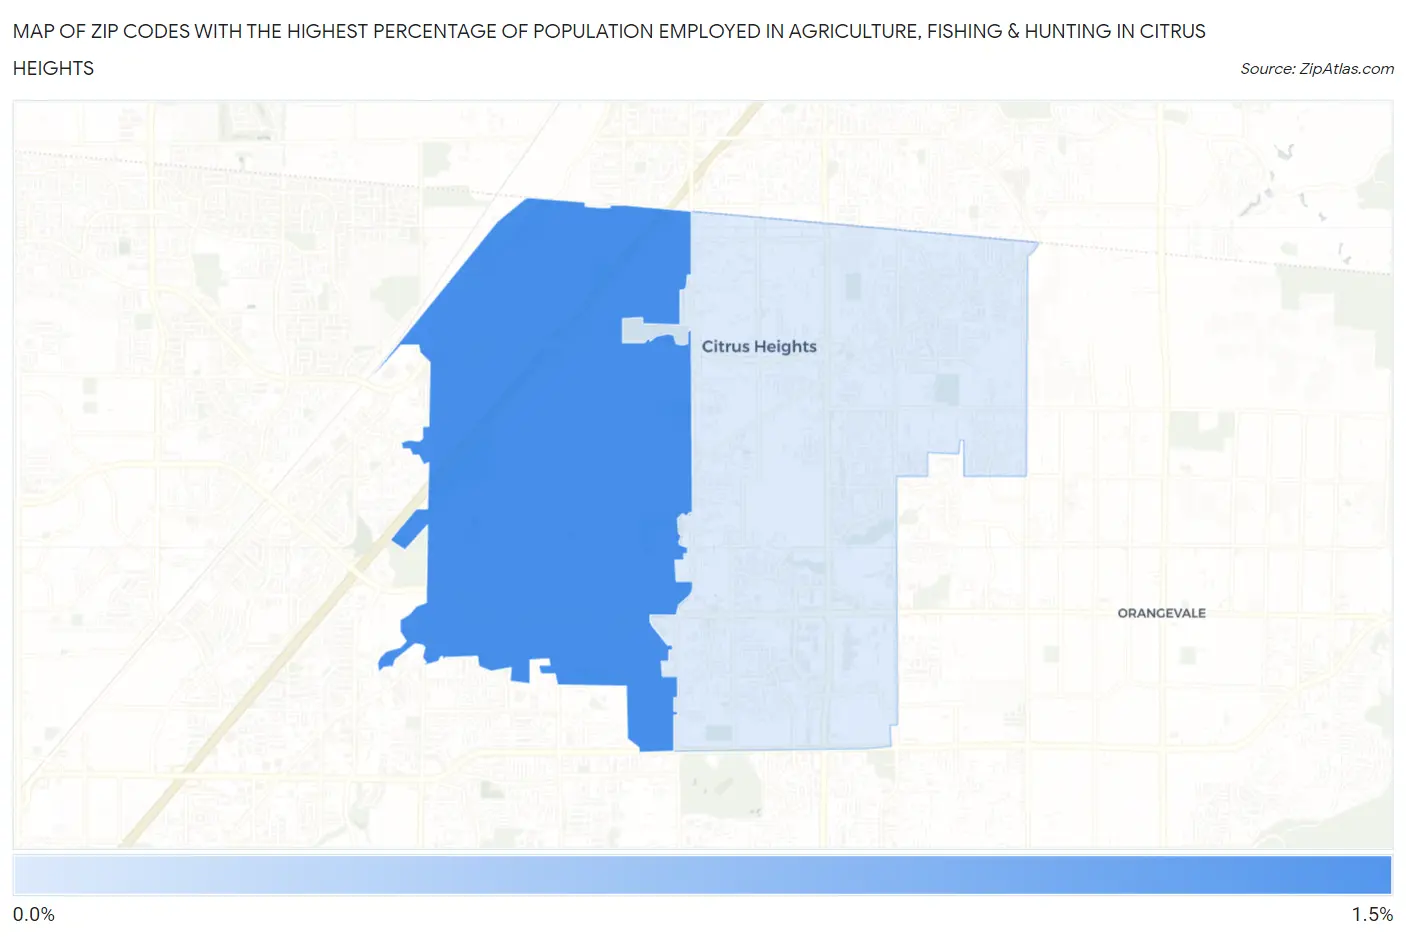
Map of Zip Codes with the Highest Percentage of Population Employed in Agriculture, Fishing & Hunting in Citrus Heights
0.44%
1.3%
Zip Codes with the Highest Percentage of Population Employed in Agriculture, Fishing & Hunting in Citrus Heights, CA
| Zip Code | % Employed | vs State | vs National | |
| 1. | 95621 | 1.3% | 2.0%(-0.639)#657 | 1.2%(+0.147)#14,845 |
| 2. | 95610 | 0.44% | 2.0%(-1.55)#1,013 | 1.2%(-0.761)#19,813 |
1
Common Questions
What are the Top Zip Codes with the Highest Percentage of Population Employed in Agriculture, Fishing & Hunting in Citrus Heights, CA?
Top Zip Codes with the Highest Percentage of Population Employed in Agriculture, Fishing & Hunting in Citrus Heights, CA are:
What zip code has the Highest Percentage of Population Employed in Agriculture, Fishing & Hunting in Citrus Heights, CA?
95621 has the Highest Percentage of Population Employed in Agriculture, Fishing & Hunting in Citrus Heights, CA with 1.3%.
What is the Percentage of Population Employed in Agriculture, Fishing & Hunting in Citrus Heights, CA?
Percentage of Population Employed in Agriculture, Fishing & Hunting in Citrus Heights is 0.88%.
What is the Percentage of Population Employed in Agriculture, Fishing & Hunting in California?
Percentage of Population Employed in Agriculture, Fishing & Hunting in California is 2.0%.
What is the Percentage of Population Employed in Agriculture, Fishing & Hunting in the United States?
Percentage of Population Employed in Agriculture, Fishing & Hunting in the United States is 1.2%.