Zip Codes with the Highest Percentage of Population Employed in Agriculture, Fishing & Hunting in Rocklin, CA
RELATED REPORTS & OPTIONS
Agriculture, Fishing & Hunting
Rocklin
Compare Zip Codes
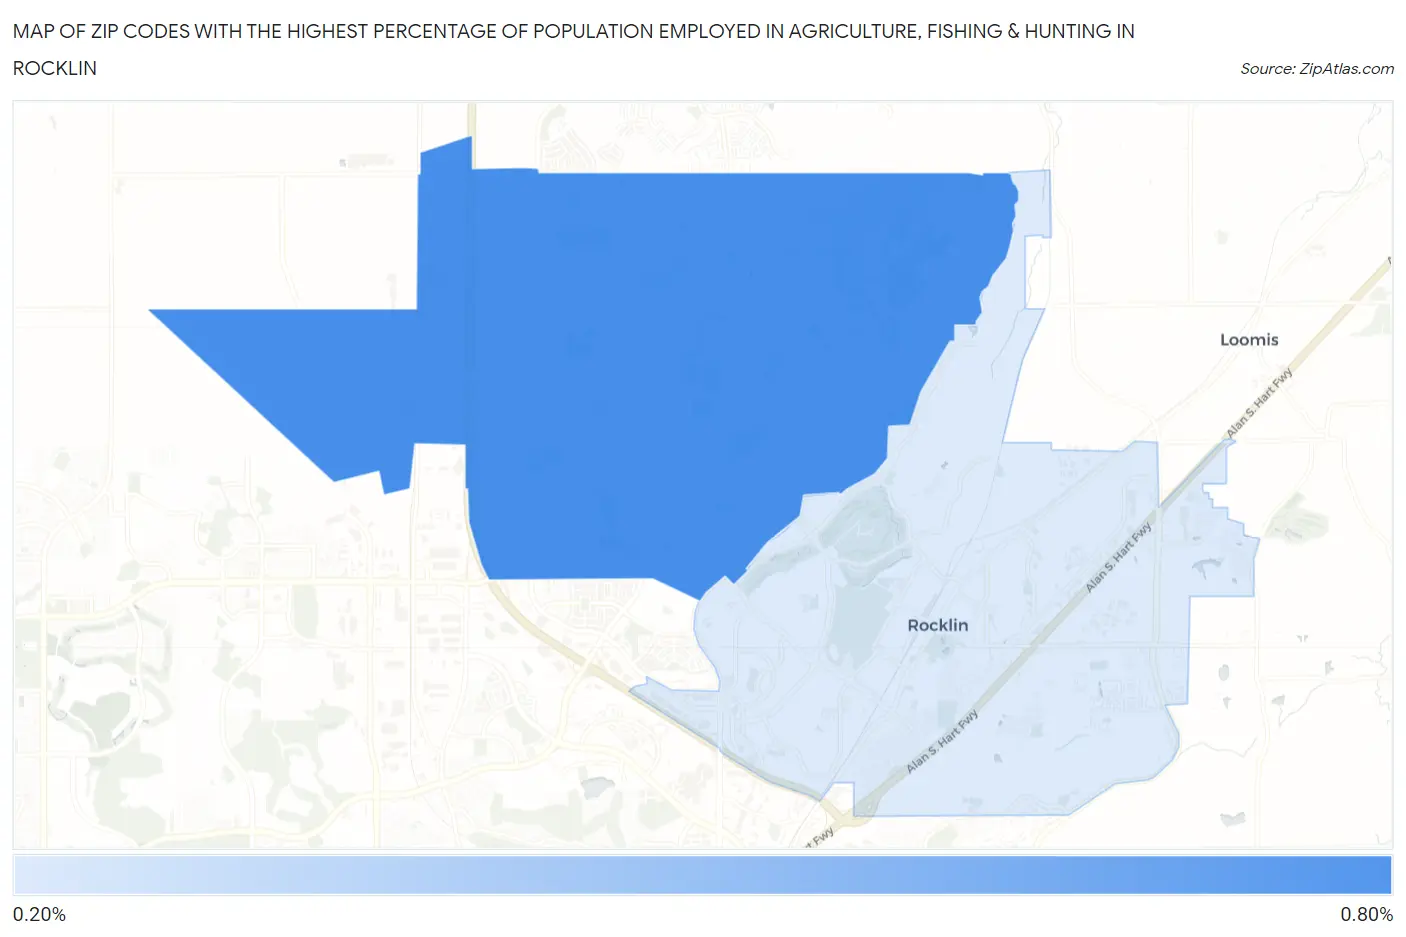
Map of Zip Codes with the Highest Percentage of Population Employed in Agriculture, Fishing & Hunting in Rocklin
0.28%
0.75%
Zip Codes with the Highest Percentage of Population Employed in Agriculture, Fishing & Hunting in Rocklin, CA
| Zip Code | % Employed | vs State | vs National | |
| 1. | 95765 | 0.75% | 2.0%(-1.23)#816 | 1.2%(-0.447)#17,521 |
| 2. | 95677 | 0.28% | 2.0%(-1.71)#1,141 | 1.2%(-0.923)#21,458 |
1
Common Questions
What are the Top Zip Codes with the Highest Percentage of Population Employed in Agriculture, Fishing & Hunting in Rocklin, CA?
Top Zip Codes with the Highest Percentage of Population Employed in Agriculture, Fishing & Hunting in Rocklin, CA are:
What zip code has the Highest Percentage of Population Employed in Agriculture, Fishing & Hunting in Rocklin, CA?
95765 has the Highest Percentage of Population Employed in Agriculture, Fishing & Hunting in Rocklin, CA with 0.75%.
What is the Percentage of Population Employed in Agriculture, Fishing & Hunting in Rocklin, CA?
Percentage of Population Employed in Agriculture, Fishing & Hunting in Rocklin is 0.56%.
What is the Percentage of Population Employed in Agriculture, Fishing & Hunting in California?
Percentage of Population Employed in Agriculture, Fishing & Hunting in California is 2.0%.
What is the Percentage of Population Employed in Agriculture, Fishing & Hunting in the United States?
Percentage of Population Employed in Agriculture, Fishing & Hunting in the United States is 1.2%.