Cities with the Highest Percentage of Population Employed in Agriculture, Fishing & Hunting in Ohio
RELATED REPORTS & OPTIONS
Agriculture, Fishing & Hunting
Ohio
Compare Cities
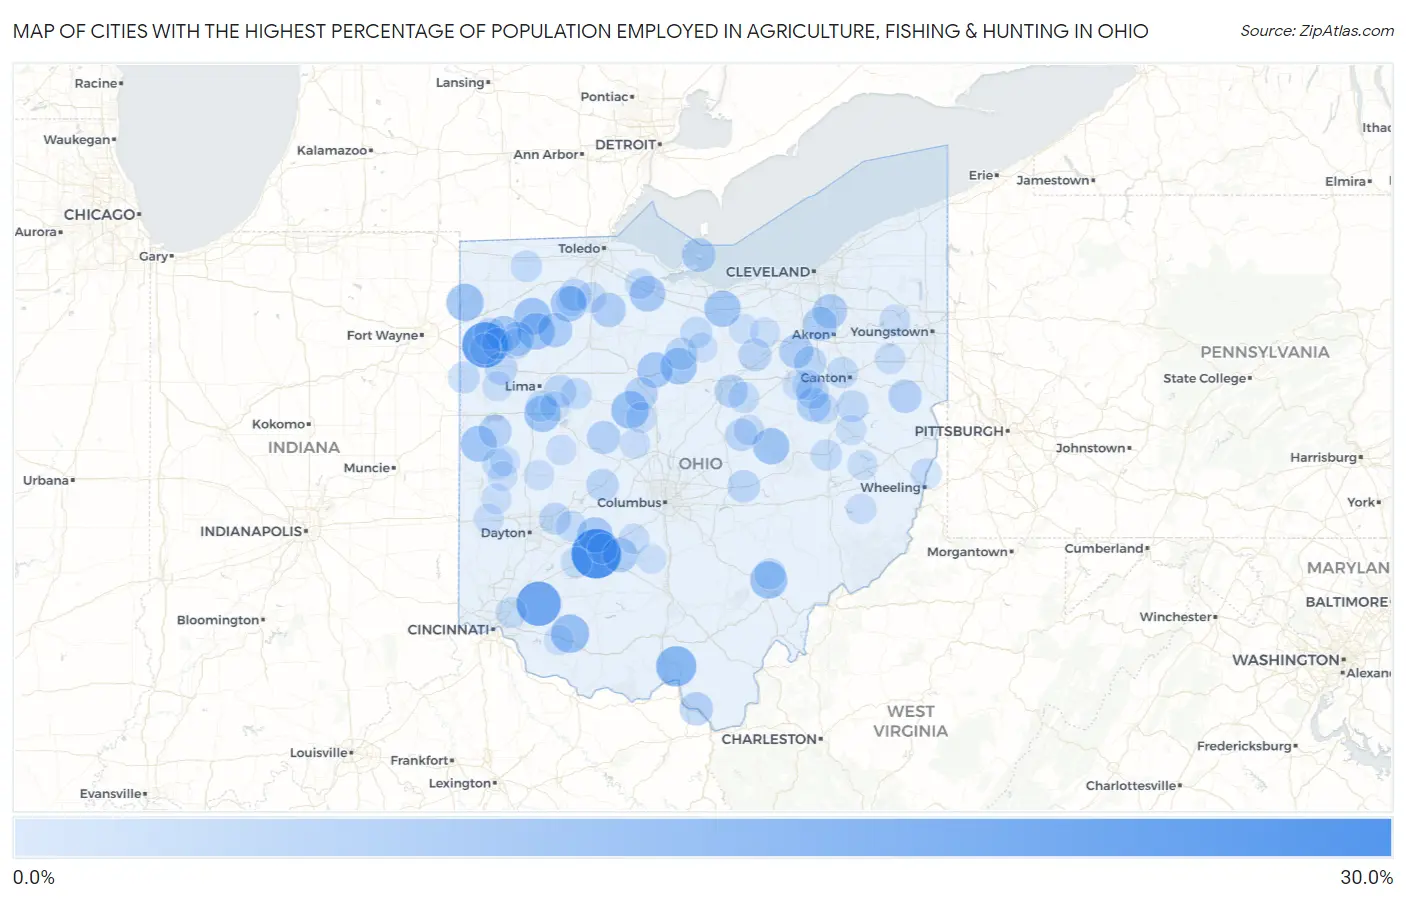
Map of Cities with the Highest Percentage of Population Employed in Agriculture, Fishing & Hunting in Ohio
0.0%
30.0%
Cities with the Highest Percentage of Population Employed in Agriculture, Fishing & Hunting in Ohio
| City | % Employed | vs State | vs National | |
| 1. | Ai | 27.3% | 0.71%(+26.6)#1 | 1.2%(+26.1)#622 |
| 2. | Octa | 27.3% | 0.71%(+26.6)#2 | 1.2%(+26.1)#625 |
| 3. | Haviland | 22.2% | 0.71%(+21.5)#3 | 1.2%(+21.0)#857 |
| 4. | Pleasant Plain | 20.4% | 0.71%(+19.7)#4 | 1.2%(+19.2)#980 |
| 5. | Oakwood Village Paulding County | 18.3% | 0.71%(+17.6)#5 | 1.2%(+17.1)#1,138 |
| 6. | Clarktown | 15.3% | 0.71%(+14.5)#6 | 1.2%(+14.1)#1,455 |
| 7. | Buford | 12.7% | 0.71%(+12.0)#7 | 1.2%(+11.5)#1,795 |
| 8. | Gomer | 12.4% | 0.71%(+11.7)#8 | 1.2%(+11.2)#1,861 |
| 9. | New Bloomington | 11.8% | 0.71%(+11.1)#9 | 1.2%(+10.6)#1,950 |
| 10. | Hicksville | 11.4% | 0.71%(+10.7)#10 | 1.2%(+10.2)#2,043 |
| 11. | Millfield | 11.3% | 0.71%(+10.6)#11 | 1.2%(+10.1)#2,065 |
| 12. | New Bavaria | 10.9% | 0.71%(+10.2)#12 | 1.2%(+9.74)#2,165 |
| 13. | Miller City | 10.8% | 0.71%(+10.1)#13 | 1.2%(+9.57)#2,213 |
| 14. | St Johns | 10.4% | 0.71%(+9.73)#14 | 1.2%(+9.25)#2,291 |
| 15. | Sulphur Springs | 10.3% | 0.71%(+9.63)#15 | 1.2%(+9.15)#2,329 |
| 16. | Nellie | 10.3% | 0.71%(+9.59)#16 | 1.2%(+9.11)#2,342 |
| 17. | Collins | 10.2% | 0.71%(+9.50)#17 | 1.2%(+9.01)#2,384 |
| 18. | Burkettsville | 9.8% | 0.71%(+9.10)#18 | 1.2%(+8.62)#2,487 |
| 19. | Custar | 9.7% | 0.71%(+8.96)#19 | 1.2%(+8.48)#2,525 |
| 20. | Melrose | 9.5% | 0.71%(+8.81)#20 | 1.2%(+8.32)#2,572 |
| 21. | Stony Prairie | 9.4% | 0.71%(+8.66)#21 | 1.2%(+8.18)#2,627 |
| 22. | South Solon | 9.2% | 0.71%(+8.53)#22 | 1.2%(+8.05)#2,678 |
| 23. | Oceola | 9.2% | 0.71%(+8.44)#23 | 1.2%(+7.96)#2,706 |
| 24. | Bloomingburg | 8.4% | 0.71%(+7.68)#24 | 1.2%(+7.20)#2,997 |
| 25. | Leipsic | 8.0% | 0.71%(+7.32)#25 | 1.2%(+6.84)#3,130 |
| 26. | Peninsula | 7.7% | 0.71%(+6.98)#26 | 1.2%(+6.49)#3,250 |
| 27. | West Millgrove | 7.7% | 0.71%(+6.98)#27 | 1.2%(+6.49)#3,268 |
| 28. | Montrose Ghent | 7.6% | 0.71%(+6.91)#28 | 1.2%(+6.42)#3,304 |
| 29. | Sterling | 7.3% | 0.71%(+6.63)#29 | 1.2%(+6.15)#3,425 |
| 30. | Dupont | 7.3% | 0.71%(+6.54)#30 | 1.2%(+6.06)#3,464 |
| 31. | Kelleys Island | 7.2% | 0.71%(+6.51)#31 | 1.2%(+6.03)#3,479 |
| 32. | Winesburg | 7.2% | 0.71%(+6.47)#32 | 1.2%(+5.99)#3,499 |
| 33. | Summitville | 6.7% | 0.71%(+5.95)#33 | 1.2%(+5.47)#3,761 |
| 34. | Hanging Rock | 6.7% | 0.71%(+5.95)#34 | 1.2%(+5.47)#3,765 |
| 35. | West Mansfield | 6.5% | 0.71%(+5.83)#35 | 1.2%(+5.35)#3,823 |
| 36. | Chickasaw | 6.4% | 0.71%(+5.67)#36 | 1.2%(+5.18)#3,902 |
| 37. | Morral | 6.3% | 0.71%(+5.63)#37 | 1.2%(+5.14)#3,925 |
| 38. | Sullivan | 6.2% | 0.71%(+5.49)#38 | 1.2%(+5.01)#3,996 |
| 39. | Lucas | 6.2% | 0.71%(+5.49)#39 | 1.2%(+5.00)#3,999 |
| 40. | Polk | 6.0% | 0.71%(+5.26)#40 | 1.2%(+4.77)#4,133 |
| 41. | Mount Eaton | 5.8% | 0.71%(+5.10)#41 | 1.2%(+4.61)#4,238 |
| 42. | Maria Stein | 5.7% | 0.71%(+4.99)#42 | 1.2%(+4.51)#4,300 |
| 43. | Harrod | 5.6% | 0.71%(+4.86)#43 | 1.2%(+4.38)#4,406 |
| 44. | Mechanicsburg | 5.6% | 0.71%(+4.85)#44 | 1.2%(+4.37)#4,411 |
| 45. | Marne | 5.6% | 0.71%(+4.84)#45 | 1.2%(+4.36)#4,426 |
| 46. | Weston | 5.4% | 0.71%(+4.73)#46 | 1.2%(+4.25)#4,510 |
| 47. | Howard | 5.4% | 0.71%(+4.68)#47 | 1.2%(+4.19)#4,543 |
| 48. | Marshallville | 5.4% | 0.71%(+4.65)#48 | 1.2%(+4.17)#4,558 |
| 49. | New Washington | 5.1% | 0.71%(+4.36)#49 | 1.2%(+3.88)#4,774 |
| 50. | Middle Point | 5.1% | 0.71%(+4.35)#50 | 1.2%(+3.87)#4,783 |
| 51. | Broughton | 5.0% | 0.71%(+4.29)#51 | 1.2%(+3.80)#4,848 |
| 52. | Holiday Valley | 4.9% | 0.71%(+4.17)#52 | 1.2%(+3.69)#4,924 |
| 53. | Mineral City | 4.8% | 0.71%(+4.11)#53 | 1.2%(+3.62)#4,981 |
| 54. | Wren | 4.5% | 0.71%(+3.78)#54 | 1.2%(+3.30)#5,271 |
| 55. | Holiday Lakes | 4.4% | 0.71%(+3.71)#55 | 1.2%(+3.23)#5,327 |
| 56. | Uniopolis | 4.3% | 0.71%(+3.61)#56 | 1.2%(+3.12)#5,449 |
| 57. | Pettisville | 4.2% | 0.71%(+3.48)#57 | 1.2%(+3.00)#5,546 |
| 58. | Hills And Dales | 4.2% | 0.71%(+3.45)#58 | 1.2%(+2.97)#5,593 |
| 59. | Newcomerstown | 4.1% | 0.71%(+3.41)#59 | 1.2%(+2.92)#5,648 |
| 60. | Mcguffey | 4.0% | 0.71%(+3.31)#60 | 1.2%(+2.82)#5,740 |
| 61. | Port William | 4.0% | 0.71%(+3.25)#61 | 1.2%(+2.76)#5,806 |
| 62. | Jacksonville | 3.9% | 0.71%(+3.23)#62 | 1.2%(+2.75)#5,826 |
| 63. | Concorde Hills | 3.9% | 0.71%(+3.17)#63 | 1.2%(+2.69)#5,887 |
| 64. | Clifton | 3.9% | 0.71%(+3.17)#64 | 1.2%(+2.68)#5,894 |
| 65. | Grover Hill | 3.9% | 0.71%(+3.16)#65 | 1.2%(+2.67)#5,905 |
| 66. | Perrysville | 3.8% | 0.71%(+3.11)#66 | 1.2%(+2.63)#5,968 |
| 67. | Yorkville | 3.8% | 0.71%(+3.10)#67 | 1.2%(+2.62)#5,981 |
| 68. | Versailles | 3.7% | 0.71%(+3.01)#68 | 1.2%(+2.53)#6,087 |
| 69. | Guilford Lake | 3.7% | 0.71%(+3.01)#69 | 1.2%(+2.52)#6,089 |
| 70. | South Canal | 3.6% | 0.71%(+2.93)#70 | 1.2%(+2.44)#6,205 |
| 71. | Cloverdale | 3.6% | 0.71%(+2.86)#71 | 1.2%(+2.37)#6,298 |
| 72. | Green Camp | 3.5% | 0.71%(+2.81)#72 | 1.2%(+2.32)#6,351 |
| 73. | Sebring | 3.5% | 0.71%(+2.79)#73 | 1.2%(+2.30)#6,368 |
| 74. | Portage | 3.4% | 0.71%(+2.70)#74 | 1.2%(+2.22)#6,467 |
| 75. | Danville | 3.4% | 0.71%(+2.67)#75 | 1.2%(+2.19)#6,512 |
| 76. | Lindsey | 3.3% | 0.71%(+2.62)#76 | 1.2%(+2.13)#6,581 |
| 77. | Scott | 3.3% | 0.71%(+2.60)#77 | 1.2%(+2.11)#6,619 |
| 78. | Mount Sterling | 3.3% | 0.71%(+2.59)#78 | 1.2%(+2.10)#6,633 |
| 79. | Dundee | 3.3% | 0.71%(+2.58)#79 | 1.2%(+2.09)#6,645 |
| 80. | De Graff | 3.2% | 0.71%(+2.48)#80 | 1.2%(+1.99)#6,775 |
| 81. | Magnetic Springs | 3.1% | 0.71%(+2.41)#81 | 1.2%(+1.93)#6,859 |
| 82. | Milton Center | 3.1% | 0.71%(+2.41)#82 | 1.2%(+1.93)#6,864 |
| 83. | Pitsburg | 3.1% | 0.71%(+2.39)#83 | 1.2%(+1.91)#6,889 |
| 84. | Kidron | 3.1% | 0.71%(+2.35)#84 | 1.2%(+1.87)#6,950 |
| 85. | Fletcher | 3.0% | 0.71%(+2.30)#85 | 1.2%(+1.82)#7,018 |
| 86. | Lewisburg | 3.0% | 0.71%(+2.30)#86 | 1.2%(+1.81)#7,025 |
| 87. | Freeport | 2.9% | 0.71%(+2.23)#87 | 1.2%(+1.74)#7,123 |
| 88. | Batesville | 2.9% | 0.71%(+2.23)#88 | 1.2%(+1.74)#7,133 |
| 89. | Barnhill | 2.9% | 0.71%(+2.17)#89 | 1.2%(+1.68)#7,215 |
| 90. | Elgin | 2.9% | 0.71%(+2.14)#90 | 1.2%(+1.66)#7,261 |
| 91. | Rochester | 2.8% | 0.71%(+2.10)#91 | 1.2%(+1.62)#7,325 |
| 92. | Russia | 2.8% | 0.71%(+2.05)#92 | 1.2%(+1.57)#7,390 |
| 93. | Spencer | 2.7% | 0.71%(+2.02)#93 | 1.2%(+1.54)#7,449 |
| 94. | Mount Orab | 2.7% | 0.71%(+1.98)#94 | 1.2%(+1.49)#7,509 |
| 95. | Jeffersonville | 2.7% | 0.71%(+1.97)#95 | 1.2%(+1.49)#7,515 |
| 96. | Apple Creek | 2.7% | 0.71%(+1.97)#96 | 1.2%(+1.48)#7,527 |
| 97. | Waynesfield | 2.6% | 0.71%(+1.93)#97 | 1.2%(+1.44)#7,587 |
| 98. | Bradford | 2.6% | 0.71%(+1.91)#98 | 1.2%(+1.42)#7,623 |
| 99. | Williamsport | 2.6% | 0.71%(+1.90)#99 | 1.2%(+1.42)#7,641 |
| 100. | Plymouth | 2.6% | 0.71%(+1.90)#100 | 1.2%(+1.41)#7,646 |
Common Questions
What are the Top 10 Cities with the Highest Percentage of Population Employed in Agriculture, Fishing & Hunting in Ohio?
Top 10 Cities with the Highest Percentage of Population Employed in Agriculture, Fishing & Hunting in Ohio are:
#1
27.3%
#2
22.2%
#3
20.4%
#4
15.3%
#5
12.7%
#6
11.8%
#7
11.4%
#8
11.3%
#9
10.9%
#10
10.8%
What city has the Highest Percentage of Population Employed in Agriculture, Fishing & Hunting in Ohio?
Octa has the Highest Percentage of Population Employed in Agriculture, Fishing & Hunting in Ohio with 27.3%.
What is the Percentage of Population Employed in Agriculture, Fishing & Hunting in the State of Ohio?
Percentage of Population Employed in Agriculture, Fishing & Hunting in Ohio is 0.71%.
What is the Percentage of Population Employed in Agriculture, Fishing & Hunting in the United States?
Percentage of Population Employed in Agriculture, Fishing & Hunting in the United States is 1.2%.