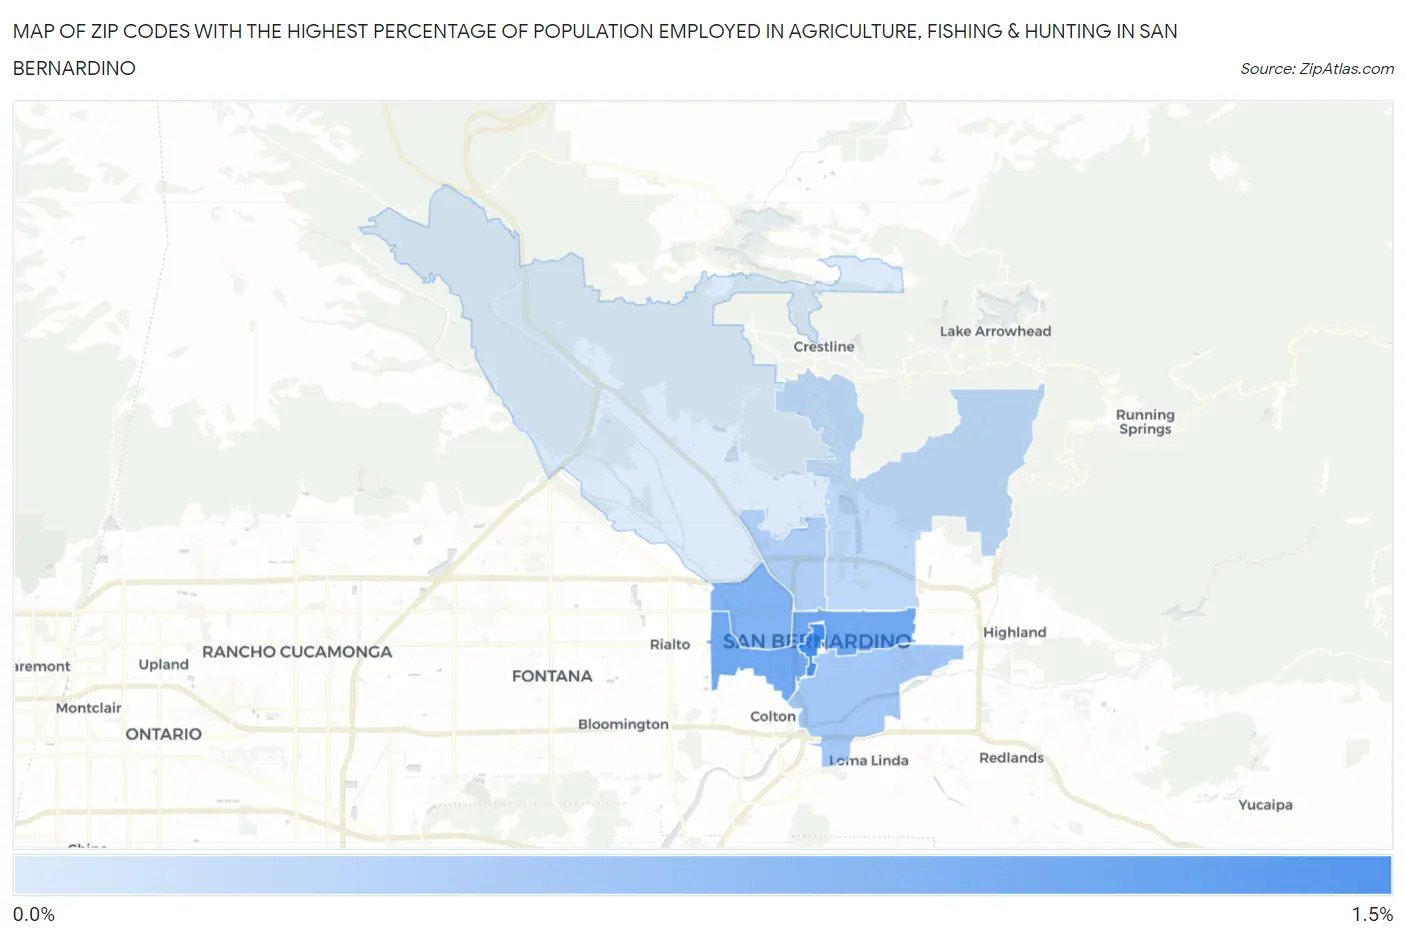
Zip Codes with the Highest Percentage of Population Employed in Agriculture, Fishing & Hunting in San Bernardino, CA
RELATED REPORTS & OPTIONS
Agriculture, Fishing & Hunting
San Bernardino
Compare Zip Codes
Map of Zip Codes with the Highest Percentage of Population Employed in Agriculture, Fishing & Hunting in San Bernardino
0.17%
1.3%

Zip Codes with the Highest Percentage of Population Employed in Agriculture, Fishing & Hunting in San Bernardino, CA
| Zip Code | % Employed | vs State | vs National | |
| 1. | 92401 | 1.3% | 2.0%(-0.637)#654 | 1.2%(+0.149)#14,830 |
| 2. | 92410 | 1.0% | 2.0%(-0.961)#720 | 1.2%(-0.175)#16,110 |
| 3. | 92411 | 0.89% | 2.0%(-1.09)#756 | 1.2%(-0.304)#16,735 |
| 4. | 92408 | 0.63% | 2.0%(-1.36)#882 | 1.2%(-0.573)#18,296 |
| 5. | 92405 | 0.53% | 2.0%(-1.46)#944 | 1.2%(-0.674)#19,054 |
| 6. | 92404 | 0.39% | 2.0%(-1.59)#1,043 | 1.2%(-0.805)#20,216 |
| 7. | 92407 | 0.17% | 2.0%(-1.82)#1,259 | 1.2%(-1.03)#22,776 |
1
Common Questions
What are the Top 5 Zip Codes with the Highest Percentage of Population Employed in Agriculture, Fishing & Hunting in San Bernardino, CA?
Top 5 Zip Codes with the Highest Percentage of Population Employed in Agriculture, Fishing & Hunting in San Bernardino, CA are:
What zip code has the Highest Percentage of Population Employed in Agriculture, Fishing & Hunting in San Bernardino, CA?
92401 has the Highest Percentage of Population Employed in Agriculture, Fishing & Hunting in San Bernardino, CA with 1.3%.
What is the Percentage of Population Employed in Agriculture, Fishing & Hunting in San Bernardino, CA?
Percentage of Population Employed in Agriculture, Fishing & Hunting in San Bernardino is 0.46%.
What is the Percentage of Population Employed in Agriculture, Fishing & Hunting in California?
Percentage of Population Employed in Agriculture, Fishing & Hunting in California is 2.0%.
What is the Percentage of Population Employed in Agriculture, Fishing & Hunting in the United States?
Percentage of Population Employed in Agriculture, Fishing & Hunting in the United States is 1.2%.