Cities with the Highest Percentage of Population Employed in Agriculture, Fishing & Hunting in West Virginia
RELATED REPORTS & OPTIONS
Agriculture, Fishing & Hunting
West Virginia
Compare Cities
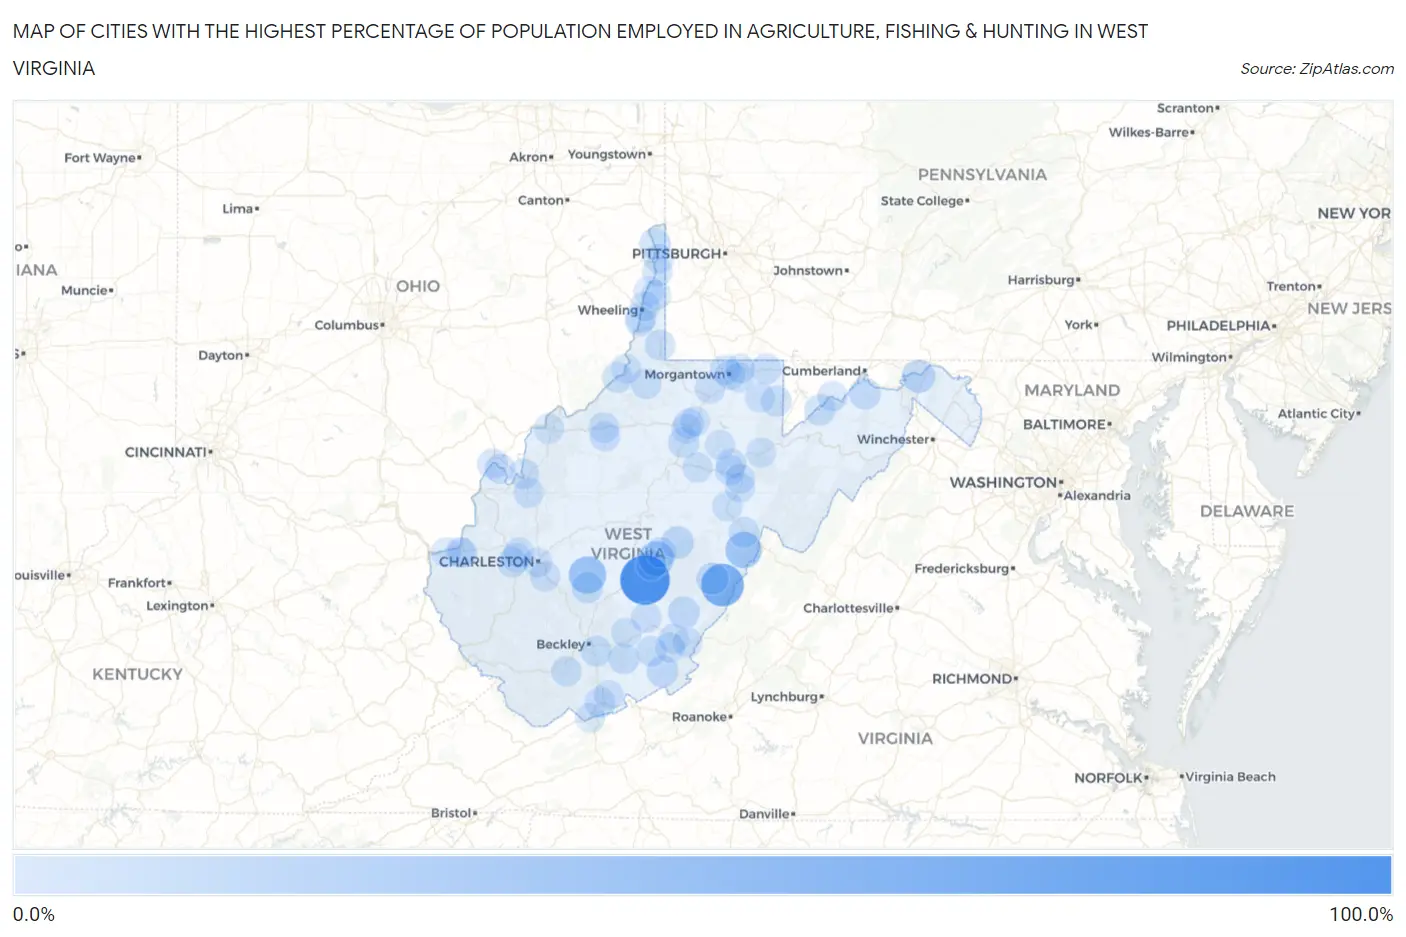
Map of Cities with the Highest Percentage of Population Employed in Agriculture, Fishing & Hunting in West Virginia
0.0%
100.0%
Cities with the Highest Percentage of Population Employed in Agriculture, Fishing & Hunting in West Virginia
| City | % Employed | vs State | vs National | |
| 1. | Nettie | 100.0% | 0.68%(+99.3)#1 | 1.2%(+98.8)#4 |
| 2. | Huntersville | 63.6% | 0.68%(+63.0)#2 | 1.2%(+62.4)#122 |
| 3. | Dixie | 36.2% | 0.68%(+35.5)#3 | 1.2%(+35.0)#365 |
| 4. | Green Bank | 31.2% | 0.68%(+30.6)#4 | 1.2%(+30.1)#481 |
| 5. | Camden On Gauley | 26.4% | 0.68%(+25.7)#5 | 1.2%(+25.2)#668 |
| 6. | Great Cacapon | 15.5% | 0.68%(+14.8)#6 | 1.2%(+14.3)#1,426 |
| 7. | Addison Webster Springs | 12.1% | 0.68%(+11.4)#7 | 1.2%(+10.9)#1,902 |
| 8. | Marlinton | 11.3% | 0.68%(+10.6)#8 | 1.2%(+10.1)#2,071 |
| 9. | Falling Spring | 8.3% | 0.68%(+7.65)#9 | 1.2%(+7.13)#3,028 |
| 10. | Union | 8.3% | 0.68%(+7.59)#10 | 1.2%(+7.08)#3,046 |
| 11. | Fort Ashby | 7.0% | 0.68%(+6.36)#11 | 1.2%(+5.84)#3,576 |
| 12. | Gauley Bridge | 6.5% | 0.68%(+5.81)#12 | 1.2%(+5.29)#3,849 |
| 13. | New Cumberland | 6.1% | 0.68%(+5.41)#13 | 1.2%(+4.89)#4,061 |
| 14. | Lost Creek | 5.8% | 0.68%(+5.08)#14 | 1.2%(+4.56)#4,270 |
| 15. | Hinton | 5.4% | 0.68%(+4.75)#15 | 1.2%(+4.24)#4,513 |
| 16. | Elk Garden | 5.1% | 0.68%(+4.38)#16 | 1.2%(+3.86)#4,794 |
| 17. | Daniels | 4.6% | 0.68%(+3.94)#17 | 1.2%(+3.42)#5,140 |
| 18. | Durbin | 3.8% | 0.68%(+3.13)#18 | 1.2%(+2.62)#5,982 |
| 19. | Princeton | 3.8% | 0.68%(+3.09)#19 | 1.2%(+2.58)#6,027 |
| 20. | Terra Alta | 3.3% | 0.68%(+2.61)#20 | 1.2%(+2.09)#6,644 |
| 21. | Brandonville | 3.0% | 0.68%(+2.29)#21 | 1.2%(+1.77)#7,087 |
| 22. | Cameron | 3.0% | 0.68%(+2.27)#22 | 1.2%(+1.76)#7,100 |
| 23. | Paden City | 2.9% | 0.68%(+2.19)#23 | 1.2%(+1.67)#7,230 |
| 24. | Alderson | 2.7% | 0.68%(+2.07)#24 | 1.2%(+1.55)#7,420 |
| 25. | Cowen | 2.7% | 0.68%(+2.02)#25 | 1.2%(+1.50)#7,489 |
| 26. | Pine Grove | 2.5% | 0.68%(+1.85)#26 | 1.2%(+1.33)#7,785 |
| 27. | Ellenboro | 2.3% | 0.68%(+1.59)#27 | 1.2%(+1.07)#8,279 |
| 28. | Mullens | 2.2% | 0.68%(+1.52)#28 | 1.2%(+1.01)#8,419 |
| 29. | Rupert | 2.0% | 0.68%(+1.36)#29 | 1.2%(+0.846)#8,743 |
| 30. | Ravenswood | 1.9% | 0.68%(+1.22)#30 | 1.2%(+0.705)#9,061 |
| 31. | Harrisville | 1.8% | 0.68%(+1.11)#31 | 1.2%(+0.593)#9,340 |
| 32. | Belington | 1.8% | 0.68%(+1.08)#32 | 1.2%(+0.570)#9,385 |
| 33. | Craigsville | 1.8% | 0.68%(+1.07)#33 | 1.2%(+0.552)#9,436 |
| 34. | Mason | 1.7% | 0.68%(+1.01)#34 | 1.2%(+0.496)#9,574 |
| 35. | Tornado | 1.5% | 0.68%(+0.838)#35 | 1.2%(+0.322)#10,045 |
| 36. | Ripley | 1.5% | 0.68%(+0.837)#36 | 1.2%(+0.322)#10,048 |
| 37. | New Haven | 1.5% | 0.68%(+0.810)#37 | 1.2%(+0.295)#10,121 |
| 38. | Buckhannon | 1.4% | 0.68%(+0.724)#38 | 1.2%(+0.208)#10,382 |
| 39. | Lewisburg | 1.4% | 0.68%(+0.681)#39 | 1.2%(+0.166)#10,499 |
| 40. | Despard | 1.3% | 0.68%(+0.610)#40 | 1.2%(+0.095)#10,711 |
| 41. | Junior | 1.2% | 0.68%(+0.479)#41 | 1.2%(-0.037)#11,192 |
| 42. | Rivesville | 1.1% | 0.68%(+0.452)#42 | 1.2%(-0.063)#11,263 |
| 43. | Star City | 1.1% | 0.68%(+0.435)#43 | 1.2%(-0.080)#11,325 |
| 44. | Hooverson Heights | 1.1% | 0.68%(+0.432)#44 | 1.2%(-0.084)#11,345 |
| 45. | Mill Creek | 1.1% | 0.68%(+0.395)#45 | 1.2%(-0.120)#11,487 |
| 46. | Marmet | 1.1% | 0.68%(+0.376)#46 | 1.2%(-0.139)#11,552 |
| 47. | Ranson Corporation | 1.1% | 0.68%(+0.368)#47 | 1.2%(-0.147)#11,590 |
| 48. | Piedmont | 0.94% | 0.68%(+0.256)#48 | 1.2%(-0.260)#12,028 |
| 49. | Benwood | 0.93% | 0.68%(+0.249)#49 | 1.2%(-0.266)#12,047 |
| 50. | Athens | 0.74% | 0.68%(+0.057)#50 | 1.2%(-0.459)#12,886 |
| 51. | Nutter Fort | 0.72% | 0.68%(+0.040)#51 | 1.2%(-0.476)#12,982 |
| 52. | Philippi | 0.71% | 0.68%(+0.023)#52 | 1.2%(-0.493)#13,063 |
| 53. | Meadow Bridge | 0.68% | 0.68%(-0.008)#53 | 1.2%(-0.524)#13,228 |
| 54. | Windsor Heights | 0.65% | 0.68%(-0.030)#54 | 1.2%(-0.546)#13,343 |
| 55. | Ronceverte | 0.65% | 0.68%(-0.031)#55 | 1.2%(-0.547)#13,351 |
| 56. | Nitro | 0.65% | 0.68%(-0.032)#56 | 1.2%(-0.548)#13,356 |
| 57. | Huntington | 0.59% | 0.68%(-0.093)#57 | 1.2%(-0.608)#13,724 |
| 58. | Kingwood | 0.59% | 0.68%(-0.094)#58 | 1.2%(-0.609)#13,728 |
| 59. | Beverly | 0.54% | 0.68%(-0.144)#59 | 1.2%(-0.659)#14,033 |
| 60. | Pea Ridge | 0.48% | 0.68%(-0.201)#60 | 1.2%(-0.716)#14,379 |
| 61. | St Albans | 0.48% | 0.68%(-0.207)#61 | 1.2%(-0.722)#14,418 |
| 62. | Brookhaven | 0.44% | 0.68%(-0.247)#62 | 1.2%(-0.763)#14,651 |
| 63. | New Martinsville | 0.39% | 0.68%(-0.290)#63 | 1.2%(-0.806)#14,935 |
| 64. | Mcmechen | 0.37% | 0.68%(-0.315)#64 | 1.2%(-0.830)#15,096 |
| 65. | Parsons | 0.36% | 0.68%(-0.325)#65 | 1.2%(-0.840)#15,159 |
| 66. | West Liberty | 0.34% | 0.68%(-0.339)#66 | 1.2%(-0.855)#15,267 |
| 67. | Elkins | 0.33% | 0.68%(-0.354)#67 | 1.2%(-0.869)#15,391 |
| 68. | Parkersburg | 0.29% | 0.68%(-0.392)#68 | 1.2%(-0.908)#15,670 |
| 69. | Bridgeport | 0.28% | 0.68%(-0.404)#69 | 1.2%(-0.919)#15,756 |
| 70. | White Sulphur Springs | 0.28% | 0.68%(-0.406)#70 | 1.2%(-0.922)#15,770 |
| 71. | Barboursville | 0.24% | 0.68%(-0.440)#71 | 1.2%(-0.956)#16,013 |
| 72. | Morgantown | 0.17% | 0.68%(-0.509)#72 | 1.2%(-1.02)#16,483 |
| 73. | Charleston | 0.17% | 0.68%(-0.519)#73 | 1.2%(-1.03)#16,554 |
| 74. | Cheat Lake | 0.15% | 0.68%(-0.539)#74 | 1.2%(-1.05)#16,692 |
| 75. | Weirton | 0.14% | 0.68%(-0.545)#75 | 1.2%(-1.06)#16,741 |
| 76. | Bluefield | 0.027% | 0.68%(-0.657)#76 | 1.2%(-1.17)#17,273 |
| 77. | Wheeling | 0.027% | 0.68%(-0.658)#77 | 1.2%(-1.17)#17,274 |
Common Questions
What are the Top 10 Cities with the Highest Percentage of Population Employed in Agriculture, Fishing & Hunting in West Virginia?
Top 10 Cities with the Highest Percentage of Population Employed in Agriculture, Fishing & Hunting in West Virginia are:
#1
100.0%
#2
63.6%
#3
36.2%
#4
31.2%
#5
26.4%
#6
15.5%
#7
12.1%
#8
11.3%
#9
8.3%
#10
8.3%
What city has the Highest Percentage of Population Employed in Agriculture, Fishing & Hunting in West Virginia?
Nettie has the Highest Percentage of Population Employed in Agriculture, Fishing & Hunting in West Virginia with 100.0%.
What is the Percentage of Population Employed in Agriculture, Fishing & Hunting in the State of West Virginia?
Percentage of Population Employed in Agriculture, Fishing & Hunting in West Virginia is 0.68%.
What is the Percentage of Population Employed in Agriculture, Fishing & Hunting in the United States?
Percentage of Population Employed in Agriculture, Fishing & Hunting in the United States is 1.2%.