Zip Codes with the Highest Percentage of Population Employed in Agriculture, Fishing & Hunting in San Leandro, CA
RELATED REPORTS & OPTIONS
Agriculture, Fishing & Hunting
San Leandro
Compare Zip Codes
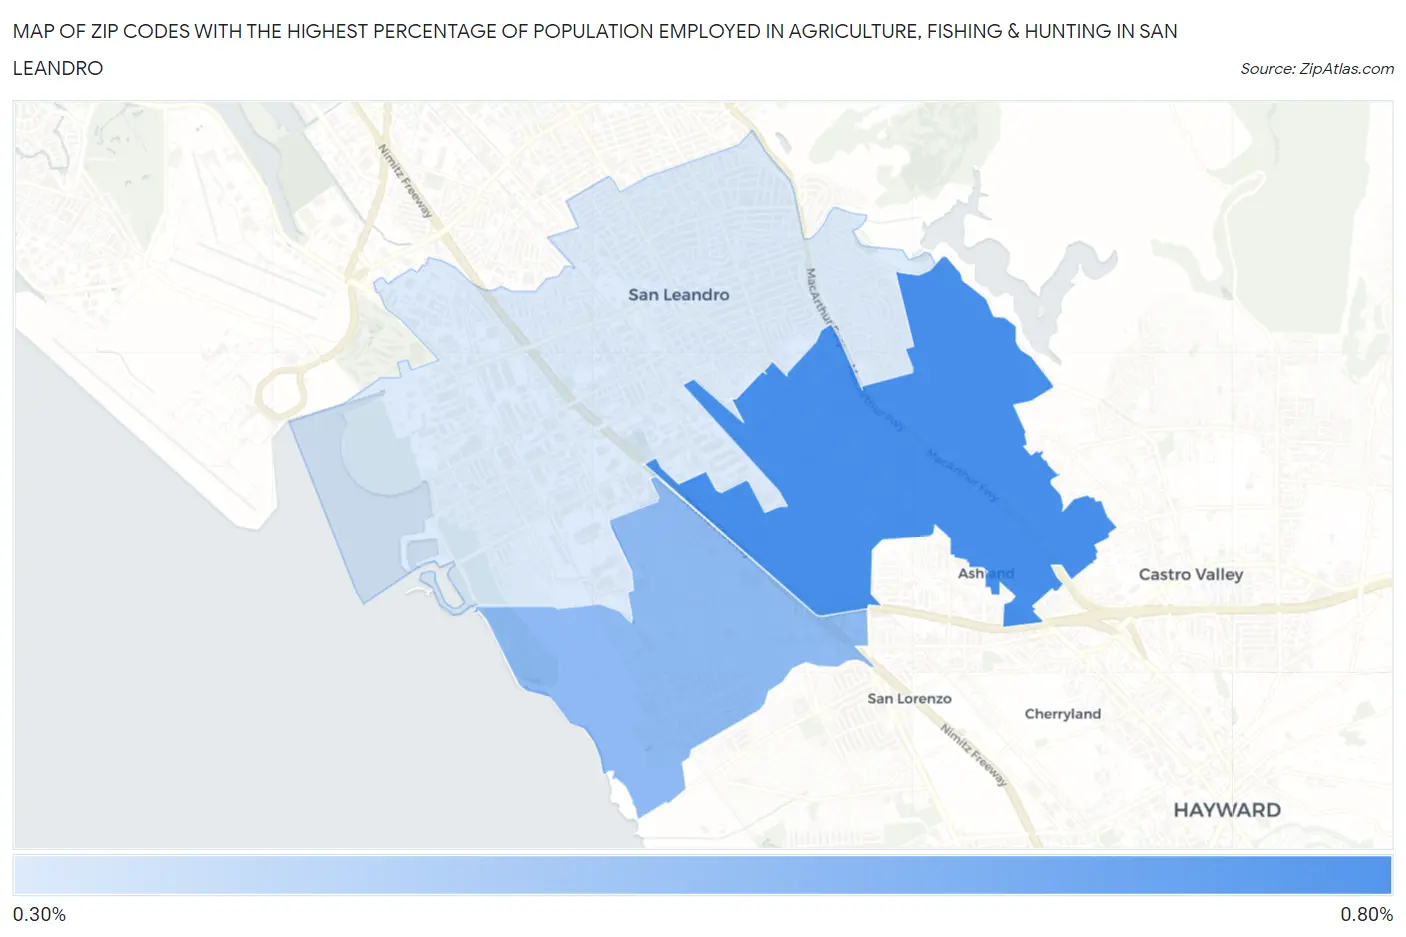
Map of Zip Codes with the Highest Percentage of Population Employed in Agriculture, Fishing & Hunting in San Leandro
0.36%
0.79%
Zip Codes with the Highest Percentage of Population Employed in Agriculture, Fishing & Hunting in San Leandro, CA
| Zip Code | % Employed | vs State | vs National | |
| 1. | 94578 | 0.79% | 2.0%(-1.20)#795 | 1.2%(-0.410)#17,305 |
| 2. | 94579 | 0.58% | 2.0%(-1.40)#910 | 1.2%(-0.617)#18,615 |
| 3. | 94577 | 0.36% | 2.0%(-1.63)#1,068 | 1.2%(-0.840)#20,557 |
1
Common Questions
What are the Top Zip Codes with the Highest Percentage of Population Employed in Agriculture, Fishing & Hunting in San Leandro, CA?
Top Zip Codes with the Highest Percentage of Population Employed in Agriculture, Fishing & Hunting in San Leandro, CA are:
What zip code has the Highest Percentage of Population Employed in Agriculture, Fishing & Hunting in San Leandro, CA?
94578 has the Highest Percentage of Population Employed in Agriculture, Fishing & Hunting in San Leandro, CA with 0.79%.
What is the Percentage of Population Employed in Agriculture, Fishing & Hunting in San Leandro, CA?
Percentage of Population Employed in Agriculture, Fishing & Hunting in San Leandro is 0.63%.
What is the Percentage of Population Employed in Agriculture, Fishing & Hunting in California?
Percentage of Population Employed in Agriculture, Fishing & Hunting in California is 2.0%.
What is the Percentage of Population Employed in Agriculture, Fishing & Hunting in the United States?
Percentage of Population Employed in Agriculture, Fishing & Hunting in the United States is 1.2%.