Cities with the Highest Percentage of Population Employed in Agriculture, Fishing & Hunting in Michigan
RELATED REPORTS & OPTIONS
Agriculture, Fishing & Hunting
Michigan
Compare Cities
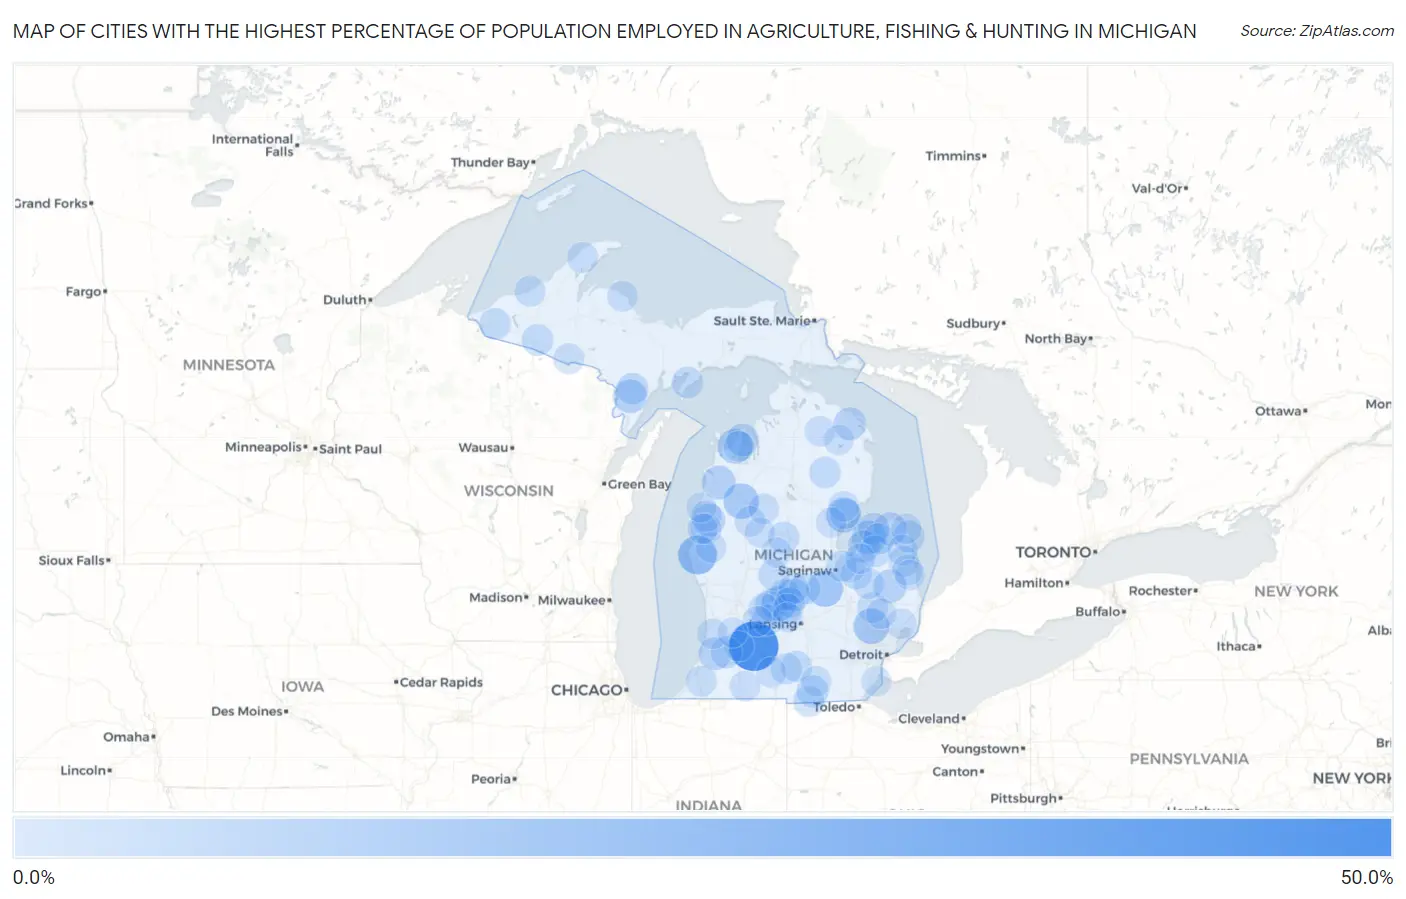
Map of Cities with the Highest Percentage of Population Employed in Agriculture, Fishing & Hunting in Michigan
0.0%
50.0%
Cities with the Highest Percentage of Population Employed in Agriculture, Fishing & Hunting in Michigan
| City | % Employed | vs State | vs National | |
| 1. | Hickory Corners | 40.9% | 0.98%(+39.9)#1 | 1.2%(+39.7)#292 |
| 2. | Falmouth | 30.7% | 0.98%(+29.7)#2 | 1.2%(+29.5)#510 |
| 3. | Naubinway | 21.4% | 0.98%(+20.4)#3 | 1.2%(+20.2)#910 |
| 4. | Shelby | 19.4% | 0.98%(+18.4)#4 | 1.2%(+18.2)#1,053 |
| 5. | Chesaning | 14.4% | 0.98%(+13.5)#5 | 1.2%(+13.2)#1,550 |
| 6. | Lake Angelus | 13.3% | 0.98%(+12.3)#6 | 1.2%(+12.1)#1,690 |
| 7. | Boon | 13.0% | 0.98%(+12.1)#7 | 1.2%(+11.8)#1,749 |
| 8. | Twining | 12.3% | 0.98%(+11.3)#8 | 1.2%(+11.1)#1,869 |
| 9. | Lyons | 12.0% | 0.98%(+11.0)#9 | 1.2%(+10.8)#1,914 |
| 10. | Lake Leelanau | 11.7% | 0.98%(+10.7)#10 | 1.2%(+10.5)#1,992 |
| 11. | Skanee | 10.3% | 0.98%(+9.27)#11 | 1.2%(+9.06)#2,365 |
| 12. | Bay Port | 10.2% | 0.98%(+9.19)#12 | 1.2%(+8.97)#2,393 |
| 13. | Crystal Mountain | 9.8% | 0.98%(+8.82)#13 | 1.2%(+8.60)#2,490 |
| 14. | Carney | 9.8% | 0.98%(+8.80)#14 | 1.2%(+8.58)#2,497 |
| 15. | Palo | 9.2% | 0.98%(+8.23)#15 | 1.2%(+8.01)#2,690 |
| 16. | Brown City | 9.2% | 0.98%(+8.17)#16 | 1.2%(+7.95)#2,707 |
| 17. | Painesdale | 9.0% | 0.98%(+8.04)#17 | 1.2%(+7.82)#2,765 |
| 18. | Posen | 8.2% | 0.98%(+7.25)#18 | 1.2%(+7.04)#3,054 |
| 19. | Kinde | 8.2% | 0.98%(+7.24)#19 | 1.2%(+7.03)#3,058 |
| 20. | Breedsville | 8.1% | 0.98%(+7.12)#20 | 1.2%(+6.91)#3,098 |
| 21. | Fountain | 8.1% | 0.98%(+7.12)#21 | 1.2%(+6.91)#3,099 |
| 22. | Hermansville | 7.9% | 0.98%(+6.94)#22 | 1.2%(+6.72)#3,168 |
| 23. | Maple Rapids | 7.9% | 0.98%(+6.93)#23 | 1.2%(+6.72)#3,169 |
| 24. | Omena | 7.7% | 0.98%(+6.71)#24 | 1.2%(+6.49)#3,260 |
| 25. | Rockland | 7.6% | 0.98%(+6.59)#25 | 1.2%(+6.38)#3,322 |
| 26. | Ionia | 7.3% | 0.98%(+6.35)#26 | 1.2%(+6.13)#3,428 |
| 27. | Sebewaing | 6.9% | 0.98%(+5.93)#27 | 1.2%(+5.72)#3,640 |
| 28. | Hudson | 6.7% | 0.98%(+5.69)#28 | 1.2%(+5.47)#3,748 |
| 29. | Harbor Beach | 6.6% | 0.98%(+5.63)#29 | 1.2%(+5.41)#3,796 |
| 30. | Elm Hall | 6.6% | 0.98%(+5.57)#30 | 1.2%(+5.36)#3,819 |
| 31. | Caseville | 6.5% | 0.98%(+5.55)#31 | 1.2%(+5.34)#3,828 |
| 32. | Powers | 6.5% | 0.98%(+5.47)#32 | 1.2%(+5.25)#3,868 |
| 33. | Gobles | 6.0% | 0.98%(+5.01)#33 | 1.2%(+4.79)#4,119 |
| 34. | Gagetown | 5.9% | 0.98%(+4.90)#34 | 1.2%(+4.68)#4,185 |
| 35. | Watersmeet | 5.9% | 0.98%(+4.90)#35 | 1.2%(+4.68)#4,187 |
| 36. | Bruce Crossing | 5.8% | 0.98%(+4.79)#36 | 1.2%(+4.57)#4,261 |
| 37. | Mass | 5.7% | 0.98%(+4.73)#37 | 1.2%(+4.51)#4,294 |
| 38. | Garden | 5.7% | 0.98%(+4.73)#38 | 1.2%(+4.51)#4,295 |
| 39. | Wakefield | 5.6% | 0.98%(+4.66)#39 | 1.2%(+4.45)#4,340 |
| 40. | Hubbardston | 5.5% | 0.98%(+4.50)#40 | 1.2%(+4.28)#4,490 |
| 41. | Grand Marais | 5.5% | 0.98%(+4.50)#41 | 1.2%(+4.28)#4,491 |
| 42. | Farwell | 5.5% | 0.98%(+4.48)#42 | 1.2%(+4.27)#4,496 |
| 43. | Mio | 5.4% | 0.98%(+4.40)#43 | 1.2%(+4.18)#4,552 |
| 44. | Waldron | 5.3% | 0.98%(+4.30)#44 | 1.2%(+4.08)#4,622 |
| 45. | Lake Odessa | 5.2% | 0.98%(+4.20)#45 | 1.2%(+3.98)#4,698 |
| 46. | Ashley | 5.1% | 0.98%(+4.16)#46 | 1.2%(+3.94)#4,733 |
| 47. | Elkton | 5.0% | 0.98%(+4.02)#47 | 1.2%(+3.80)#4,833 |
| 48. | Homer | 4.9% | 0.98%(+3.96)#48 | 1.2%(+3.75)#4,876 |
| 49. | Mcbride | 4.9% | 0.98%(+3.95)#49 | 1.2%(+3.74)#4,884 |
| 50. | Concord | 4.9% | 0.98%(+3.95)#50 | 1.2%(+3.73)#4,885 |
| 51. | Vassar | 4.9% | 0.98%(+3.92)#51 | 1.2%(+3.71)#4,907 |
| 52. | Robin Glen Indiantown | 4.9% | 0.98%(+3.92)#52 | 1.2%(+3.71)#4,909 |
| 53. | Free Soil | 4.8% | 0.98%(+3.78)#53 | 1.2%(+3.56)#5,037 |
| 54. | Metamora | 4.6% | 0.98%(+3.65)#54 | 1.2%(+3.43)#5,136 |
| 55. | Copper City | 4.6% | 0.98%(+3.63)#55 | 1.2%(+3.42)#5,149 |
| 56. | Fostoria | 4.5% | 0.98%(+3.54)#56 | 1.2%(+3.33)#5,234 |
| 57. | Eau Claire | 4.5% | 0.98%(+3.53)#57 | 1.2%(+3.32)#5,249 |
| 58. | Saranac | 4.5% | 0.98%(+3.47)#58 | 1.2%(+3.26)#5,302 |
| 59. | Le Roy | 4.4% | 0.98%(+3.46)#59 | 1.2%(+3.25)#5,311 |
| 60. | Big Bay | 4.3% | 0.98%(+3.36)#60 | 1.2%(+3.15)#5,411 |
| 61. | Ontonagon | 4.3% | 0.98%(+3.31)#61 | 1.2%(+3.10)#5,479 |
| 62. | Caspian | 4.3% | 0.98%(+3.29)#62 | 1.2%(+3.07)#5,494 |
| 63. | Deckerville | 4.3% | 0.98%(+3.27)#63 | 1.2%(+3.06)#5,507 |
| 64. | Minden City | 4.2% | 0.98%(+3.18)#64 | 1.2%(+2.97)#5,595 |
| 65. | Turner | 4.2% | 0.98%(+3.18)#65 | 1.2%(+2.97)#5,605 |
| 66. | Freeport | 4.1% | 0.98%(+3.15)#66 | 1.2%(+2.93)#5,641 |
| 67. | New Haven | 4.1% | 0.98%(+3.14)#67 | 1.2%(+2.93)#5,644 |
| 68. | Custer | 4.1% | 0.98%(+3.10)#68 | 1.2%(+2.88)#5,685 |
| 69. | Centreville | 4.1% | 0.98%(+3.07)#69 | 1.2%(+2.85)#5,705 |
| 70. | Burlington | 4.0% | 0.98%(+3.06)#70 | 1.2%(+2.84)#5,718 |
| 71. | Whittemore | 4.0% | 0.98%(+3.02)#71 | 1.2%(+2.80)#5,762 |
| 72. | Walkerville | 4.0% | 0.98%(+3.02)#72 | 1.2%(+2.80)#5,765 |
| 73. | Carsonville | 4.0% | 0.98%(+2.99)#73 | 1.2%(+2.78)#5,787 |
| 74. | Mcbain | 4.0% | 0.98%(+2.98)#74 | 1.2%(+2.76)#5,800 |
| 75. | Greenland | 3.9% | 0.98%(+2.96)#75 | 1.2%(+2.75)#5,830 |
| 76. | Port Hope | 3.8% | 0.98%(+2.86)#76 | 1.2%(+2.65)#5,935 |
| 77. | Fennville | 3.8% | 0.98%(+2.81)#77 | 1.2%(+2.60)#6,002 |
| 78. | Fowler | 3.8% | 0.98%(+2.80)#78 | 1.2%(+2.58)#6,024 |
| 79. | Scottville | 3.8% | 0.98%(+2.78)#79 | 1.2%(+2.57)#6,039 |
| 80. | Lamont | 3.8% | 0.98%(+2.78)#80 | 1.2%(+2.57)#6,041 |
| 81. | Lake Isabella | 3.7% | 0.98%(+2.71)#81 | 1.2%(+2.50)#6,124 |
| 82. | Reese | 3.7% | 0.98%(+2.71)#82 | 1.2%(+2.49)#6,127 |
| 83. | Sterling | 3.7% | 0.98%(+2.70)#83 | 1.2%(+2.49)#6,134 |
| 84. | Leonard | 3.7% | 0.98%(+2.69)#84 | 1.2%(+2.48)#6,153 |
| 85. | Manitou Beach Devils Lake | 3.7% | 0.98%(+2.69)#85 | 1.2%(+2.47)#6,159 |
| 86. | Suttons Bay | 3.7% | 0.98%(+2.69)#86 | 1.2%(+2.47)#6,160 |
| 87. | Canada Creek Ranch | 3.7% | 0.98%(+2.67)#87 | 1.2%(+2.46)#6,175 |
| 88. | Perrinton | 3.6% | 0.98%(+2.64)#88 | 1.2%(+2.43)#6,224 |
| 89. | Hillman | 3.6% | 0.98%(+2.64)#89 | 1.2%(+2.42)#6,230 |
| 90. | Akron | 3.6% | 0.98%(+2.57)#90 | 1.2%(+2.35)#6,323 |
| 91. | Estral Beach | 3.5% | 0.98%(+2.55)#91 | 1.2%(+2.34)#6,339 |
| 92. | Applegate | 3.5% | 0.98%(+2.49)#92 | 1.2%(+2.28)#6,389 |
| 93. | Shaftsburg | 3.4% | 0.98%(+2.39)#93 | 1.2%(+2.18)#6,520 |
| 94. | Plainwell | 3.3% | 0.98%(+2.35)#94 | 1.2%(+2.13)#6,596 |
| 95. | Chassell | 3.3% | 0.98%(+2.30)#95 | 1.2%(+2.09)#6,654 |
| 96. | Hopkins | 3.3% | 0.98%(+2.29)#96 | 1.2%(+2.08)#6,662 |
| 97. | Oak Hill | 3.2% | 0.98%(+2.25)#97 | 1.2%(+2.04)#6,713 |
| 98. | Evart | 3.2% | 0.98%(+2.25)#98 | 1.2%(+2.03)#6,720 |
| 99. | Westphalia | 3.2% | 0.98%(+2.24)#99 | 1.2%(+2.03)#6,723 |
| 100. | Eagle | 3.2% | 0.98%(+2.24)#100 | 1.2%(+2.03)#6,736 |
Common Questions
What are the Top 10 Cities with the Highest Percentage of Population Employed in Agriculture, Fishing & Hunting in Michigan?
Top 10 Cities with the Highest Percentage of Population Employed in Agriculture, Fishing & Hunting in Michigan are:
#1
40.9%
#2
19.4%
#3
14.4%
#4
13.3%
#5
13.0%
#6
12.3%
#7
12.0%
#8
11.7%
#9
10.2%
#10
9.8%
What city has the Highest Percentage of Population Employed in Agriculture, Fishing & Hunting in Michigan?
Hickory Corners has the Highest Percentage of Population Employed in Agriculture, Fishing & Hunting in Michigan with 40.9%.
What is the Percentage of Population Employed in Agriculture, Fishing & Hunting in the State of Michigan?
Percentage of Population Employed in Agriculture, Fishing & Hunting in Michigan is 0.98%.
What is the Percentage of Population Employed in Agriculture, Fishing & Hunting in the United States?
Percentage of Population Employed in Agriculture, Fishing & Hunting in the United States is 1.2%.