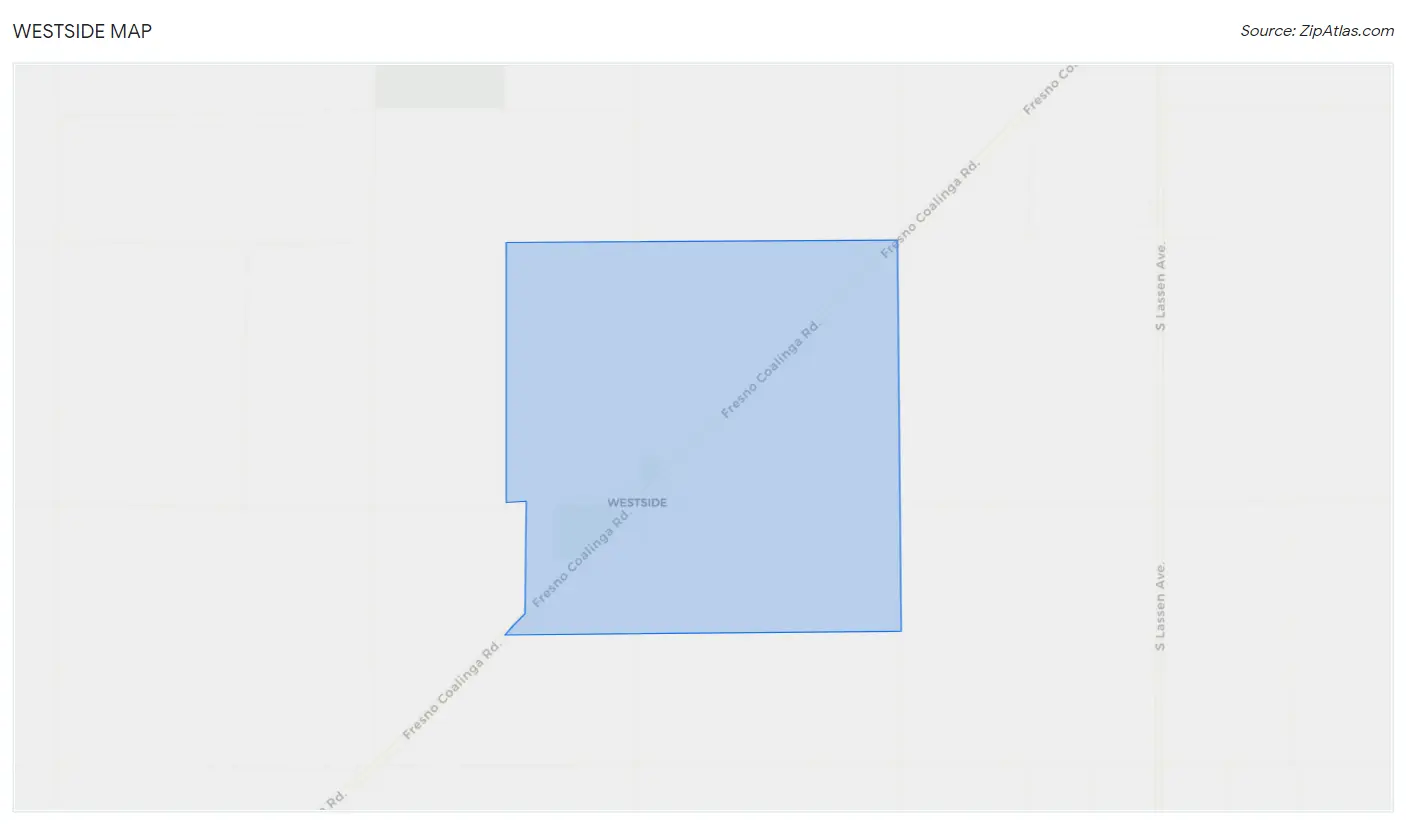
Westside, CA Map & Demographics
Westside Map
Westside Overview
$13,076
PER CAPITA INCOME
10.6%
WAGE / INCOME GAP [ % ]
89.4¢/ $1
WAGE / INCOME GAP [ $ ]
0.22
INEQUALITY / GINI INDEX
191
TOTAL POPULATION
98
MALE POPULATION
93
FEMALE POPULATION
105.38
MALES / 100 FEMALES
94.90
FEMALES / 100 MALES
22.4
MEDIAN AGE
6.0
AVG FAMILY SIZE
6.2
AVG HOUSEHOLD SIZE
78
LABOR FORCE [ PEOPLE ]
47.0%
PERCENT IN LABOR FORCE
Income in Westside
Income Overview in Westside
| Characteristic | Number | Measure |
| Per Capita Income | 191 | $13,076 |
| Median Family Income | 31 | $0 |
| Mean Family Income | 31 | $66,484 |
| Median Household Income | 31 | $0 |
| Mean Household Income | 31 | $68,474 |
| Income Deficit | 31 | $0 |
| Wage / Income Gap (%) | 191 | 10.59% |
| Wage / Income Gap ($) | 191 | 89.41¢ per $1 |
| Gini / Inequality Index | 191 | 0.22 |
Earnings by Sex in Westside
Average Earnings in Westside are $15,385, $16,154 for men and $14,444 for women, a difference of 10.6%.
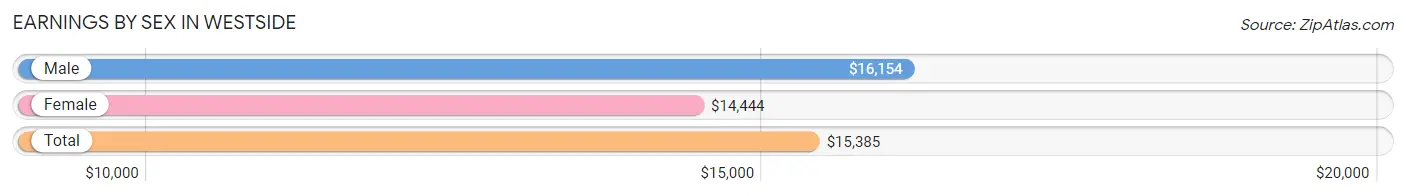
| Sex | Number | Average Earnings |
| Male | 68 (70.8%) | $16,154 |
| Female | 28 (29.2%) | $14,444 |
| Total | 96 (100.0%) | $15,385 |
Earnings by Sex by Income Bracket in Westside
The most common earnings brackets in Westside are $5,000 to $7,499 for men (18 | 26.5%) and $12,500 to $14,999 for women (18 | 64.3%).
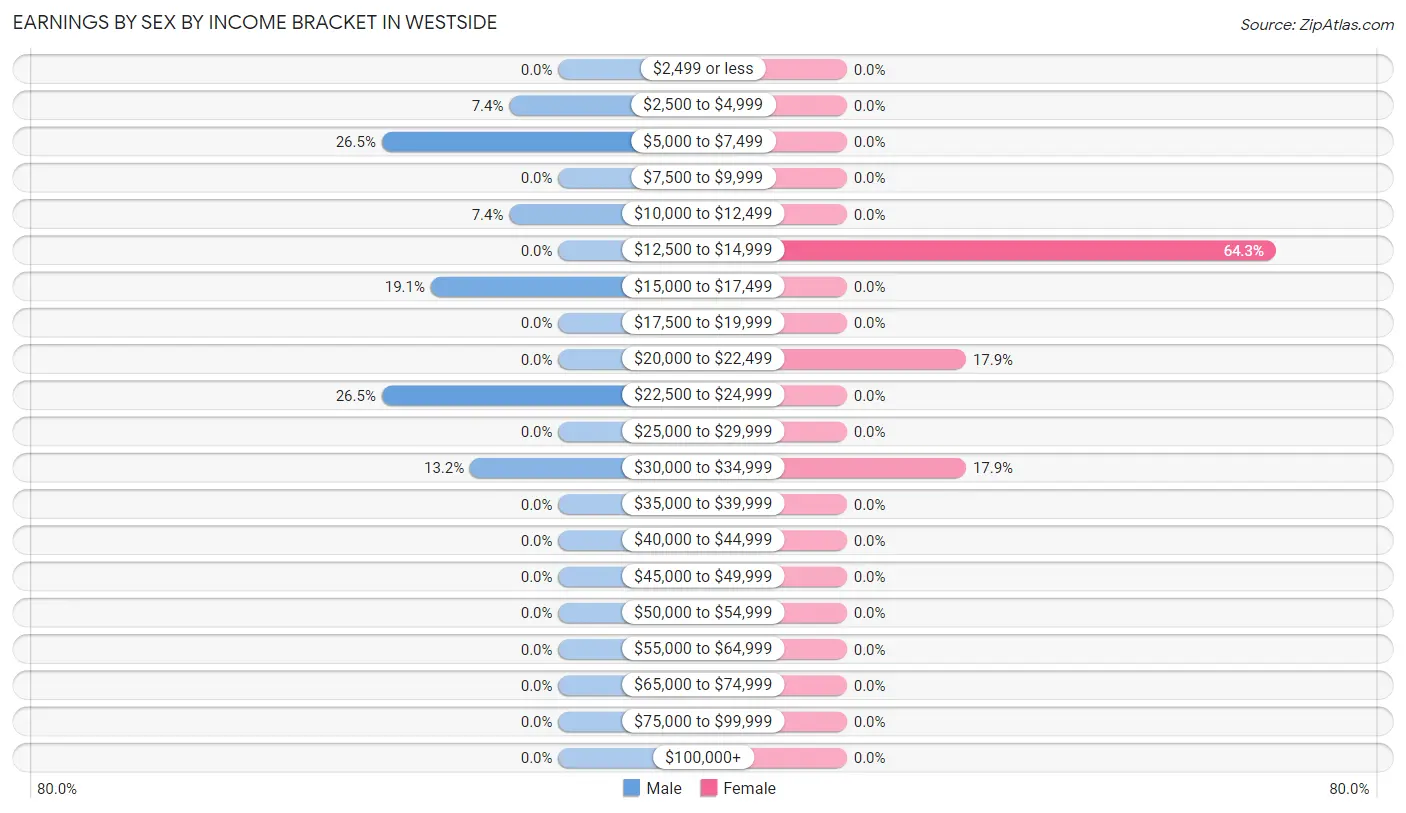
| Income | Male | Female |
| $2,499 or less | 0 (0.0%) | 0 (0.0%) |
| $2,500 to $4,999 | 5 (7.3%) | 0 (0.0%) |
| $5,000 to $7,499 | 18 (26.5%) | 0 (0.0%) |
| $7,500 to $9,999 | 0 (0.0%) | 0 (0.0%) |
| $10,000 to $12,499 | 5 (7.3%) | 0 (0.0%) |
| $12,500 to $14,999 | 0 (0.0%) | 18 (64.3%) |
| $15,000 to $17,499 | 13 (19.1%) | 0 (0.0%) |
| $17,500 to $19,999 | 0 (0.0%) | 0 (0.0%) |
| $20,000 to $22,499 | 0 (0.0%) | 5 (17.9%) |
| $22,500 to $24,999 | 18 (26.5%) | 0 (0.0%) |
| $25,000 to $29,999 | 0 (0.0%) | 0 (0.0%) |
| $30,000 to $34,999 | 9 (13.2%) | 5 (17.9%) |
| $35,000 to $39,999 | 0 (0.0%) | 0 (0.0%) |
| $40,000 to $44,999 | 0 (0.0%) | 0 (0.0%) |
| $45,000 to $49,999 | 0 (0.0%) | 0 (0.0%) |
| $50,000 to $54,999 | 0 (0.0%) | 0 (0.0%) |
| $55,000 to $64,999 | 0 (0.0%) | 0 (0.0%) |
| $65,000 to $74,999 | 0 (0.0%) | 0 (0.0%) |
| $75,000 to $99,999 | 0 (0.0%) | 0 (0.0%) |
| $100,000+ | 0 (0.0%) | 0 (0.0%) |
| Total | 68 (100.0%) | 28 (100.0%) |
Earnings by Sex by Educational Attainment in Westside
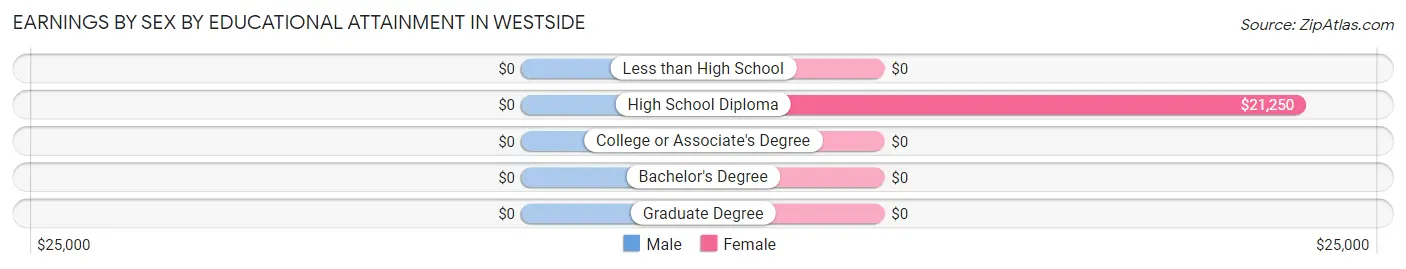
| Educational Attainment | Male Income | Female Income |
| Less than High School | - | - |
| High School Diploma | - | - |
| College or Associate's Degree | - | - |
| Bachelor's Degree | - | - |
| Graduate Degree | - | - |
| Total | $16,154 | $14,444 |
Family Income in Westside
Family Income Brackets in Westside
According to the Westside family income data, there are 13 families falling into the $75,000 to $99,999 income range, which is the most common income bracket and makes up 41.9% of all families.
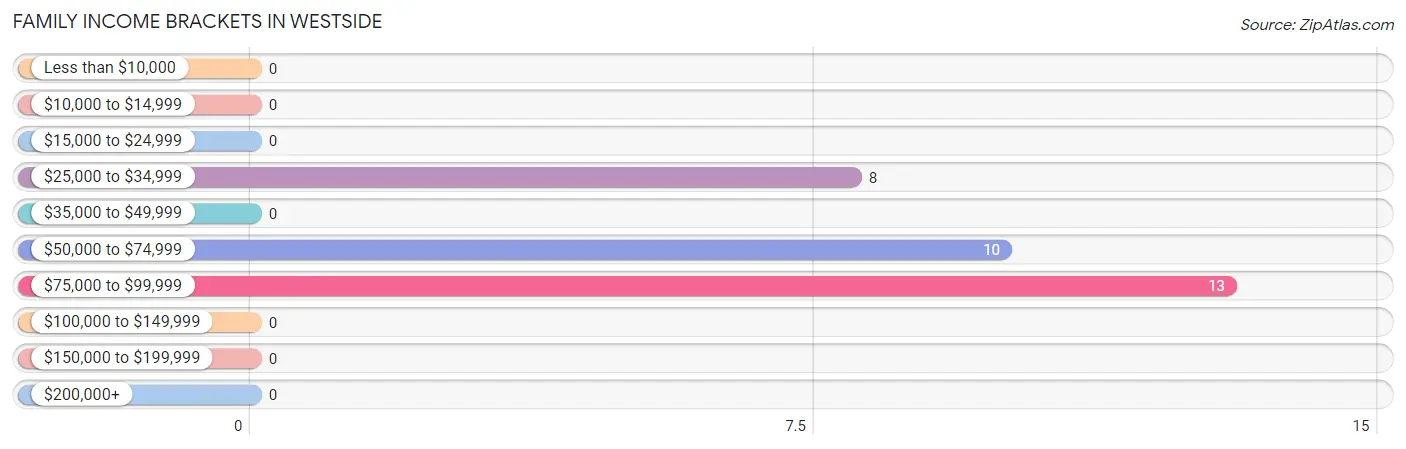
| Income Bracket | # Families | % Families |
| Less than $10,000 | 0 | 0.0% |
| $10,000 to $14,999 | 0 | 0.0% |
| $15,000 to $24,999 | 0 | 0.0% |
| $25,000 to $34,999 | 8 | 25.8% |
| $35,000 to $49,999 | 0 | 0.0% |
| $50,000 to $74,999 | 10 | 32.3% |
| $75,000 to $99,999 | 13 | 41.9% |
| $100,000 to $149,999 | 0 | 0.0% |
| $150,000 to $199,999 | 0 | 0.0% |
| $200,000+ | 0 | 0.0% |
Family Income by Famaliy Size in Westside
| Income Bracket | # Families | Median Income |
| 2-Person Families | 10 (32.3%) | $0 |
| 3-Person Families | 3 (9.7%) | $0 |
| 4-Person Families | 0 (0.0%) | $0 |
| 5-Person Families | 5 (16.1%) | $0 |
| 6-Person Families | 0 (0.0%) | $0 |
| 7+ Person Families | 13 (41.9%) | $0 |
| Total | 31 (100.0%) | $0 |
Family Income by Number of Earners in Westside
| Number of Earners | # Families | Median Income |
| No Earners | 0 (0.0%) | $0 |
| 1 Earner | 8 (25.8%) | $0 |
| 2 Earners | 10 (32.3%) | $0 |
| 3+ Earners | 13 (41.9%) | $0 |
| Total | 31 (100.0%) | $0 |
Household Income in Westside
Household Income Brackets in Westside
With 13 households falling in the category, the $75,000 to $99,999 income range is the most frequent in Westside, accounting for 41.9% of all households.
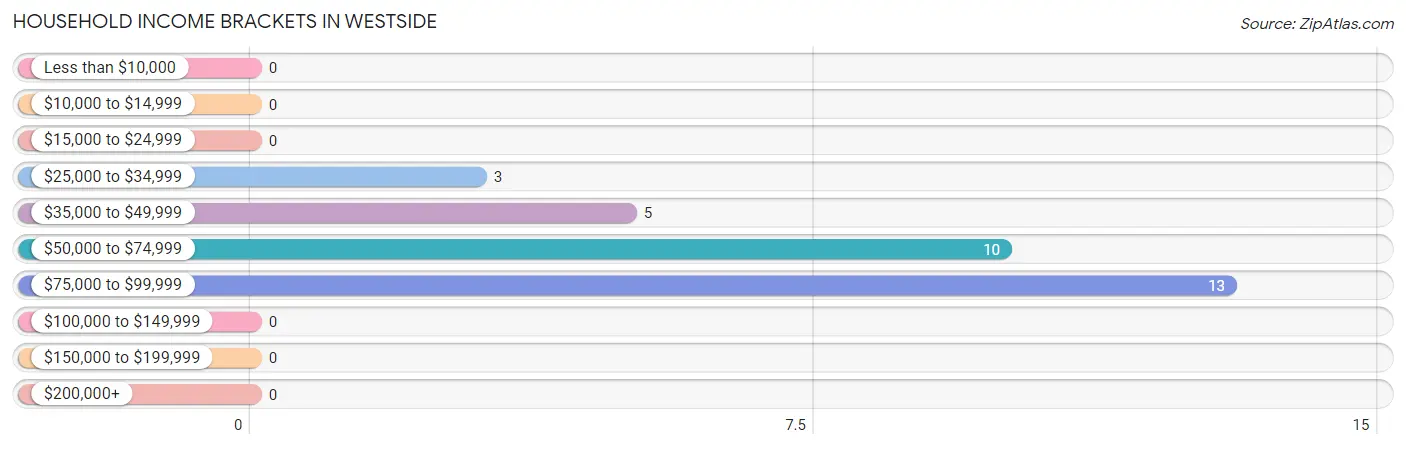
| Income Bracket | # Households | % Households |
| Less than $10,000 | 0 | 0.0% |
| $10,000 to $14,999 | 0 | 0.0% |
| $15,000 to $24,999 | 0 | 0.0% |
| $25,000 to $34,999 | 3 | 9.7% |
| $35,000 to $49,999 | 5 | 16.1% |
| $50,000 to $74,999 | 10 | 32.3% |
| $75,000 to $99,999 | 13 | 41.9% |
| $100,000 to $149,999 | 0 | 0.0% |
| $150,000 to $199,999 | 0 | 0.0% |
| $200,000+ | 0 | 0.0% |
Household Income by Householder Age in Westside
The median household income in Westside is $0, with the highest median household income of $80,000 found in the 45 to 64 years age bracket for the primary householder. A total of 26 households (83.9%) fall into this category.
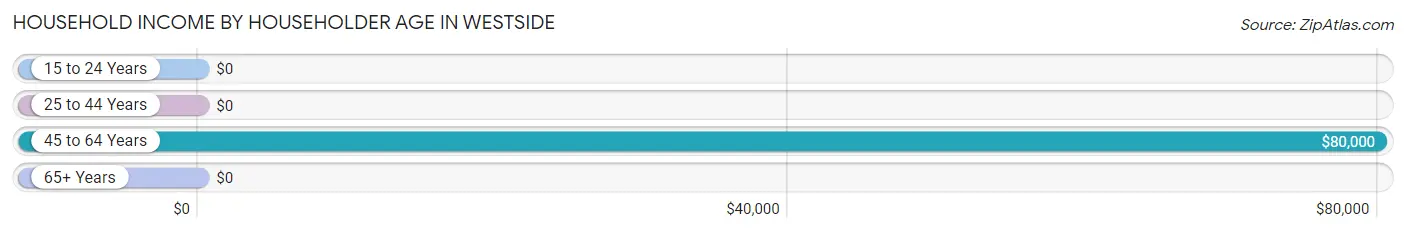
| Income Bracket | # Households | Median Income |
| 15 to 24 Years | 0 (0.0%) | $0 |
| 25 to 44 Years | 5 (16.1%) | $0 |
| 45 to 64 Years | 26 (83.9%) | $80,000 |
| 65+ Years | 0 (0.0%) | $0 |
| Total | 31 (100.0%) | $0 |
Poverty in Westside
Income Below Poverty by Sex and Age in Westside
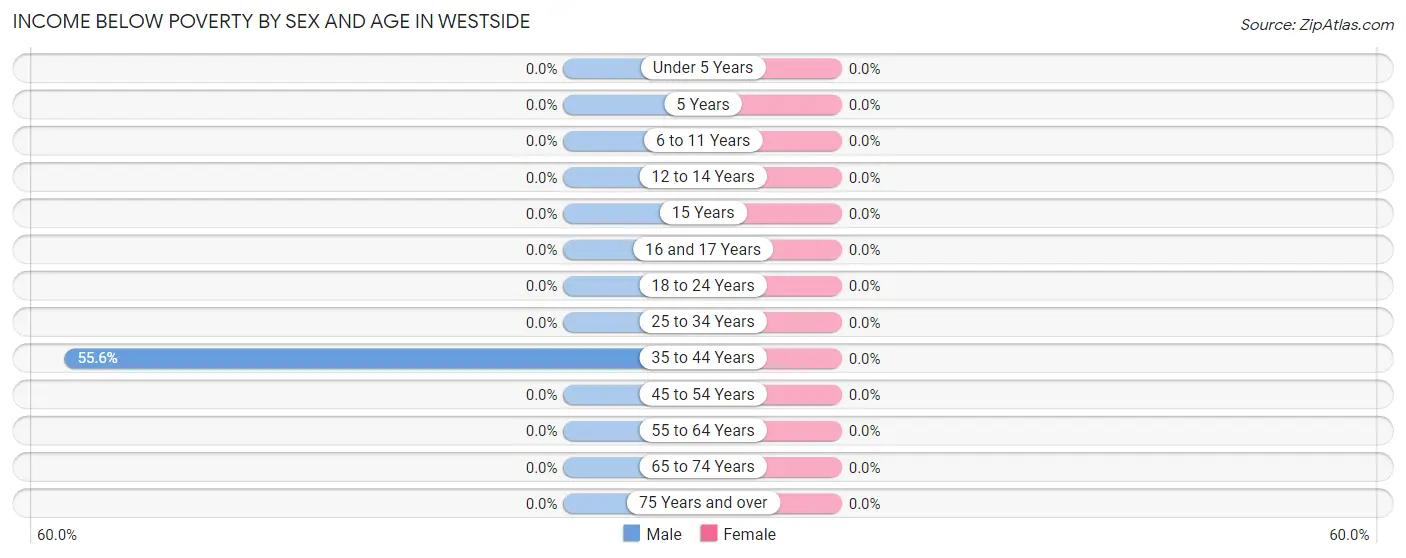
| Age Bracket | Male | Female |
| Under 5 Years | 0 (0.0%) | 0 (0.0%) |
| 5 Years | 0 (0.0%) | 0 (0.0%) |
| 6 to 11 Years | 0 (0.0%) | 0 (0.0%) |
| 12 to 14 Years | 0 (0.0%) | 0 (0.0%) |
| 15 Years | 0 (0.0%) | 0 (0.0%) |
| 16 and 17 Years | 0 (0.0%) | 0 (0.0%) |
| 18 to 24 Years | 0 (0.0%) | 0 (0.0%) |
| 25 to 34 Years | 0 (0.0%) | 0 (0.0%) |
| 35 to 44 Years | 5 (55.6%) | 0 (0.0%) |
| 45 to 54 Years | 0 (0.0%) | 0 (0.0%) |
| 55 to 64 Years | 0 (0.0%) | 0 (0.0%) |
| 65 to 74 Years | 0 (0.0%) | 0 (0.0%) |
| 75 Years and over | 0 (0.0%) | 0 (0.0%) |
| Total | 5 (5.1%) | 0 (0.0%) |
Income Above Poverty by Sex and Age in Westside
According to the poverty statistics in Westside, males aged under 5 years and females aged under 5 years are the age groups that are most secure financially, with 100.0% of males and 100.0% of females in these age groups living above the poverty line.
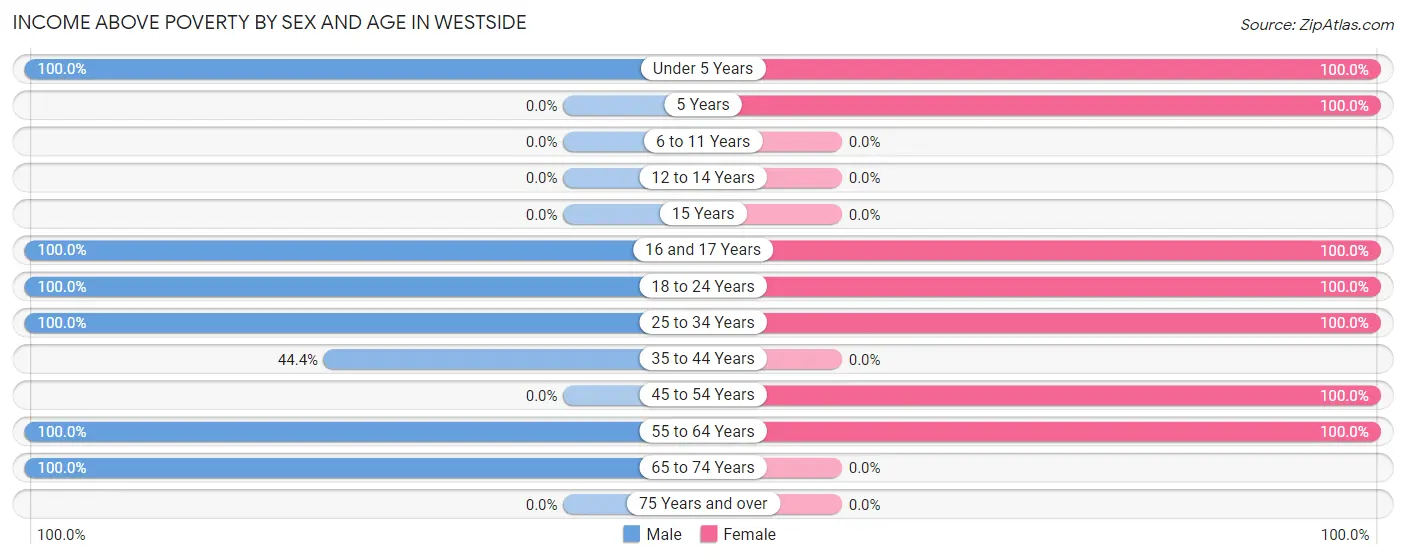
| Age Bracket | Male | Female |
| Under 5 Years | 5 (100.0%) | 15 (100.0%) |
| 5 Years | 0 (0.0%) | 5 (100.0%) |
| 6 to 11 Years | 0 (0.0%) | 0 (0.0%) |
| 12 to 14 Years | 0 (0.0%) | 0 (0.0%) |
| 15 Years | 0 (0.0%) | 0 (0.0%) |
| 16 and 17 Years | 4 (100.0%) | 17 (100.0%) |
| 18 to 24 Years | 36 (100.0%) | 25 (100.0%) |
| 25 to 34 Years | 10 (100.0%) | 5 (100.0%) |
| 35 to 44 Years | 4 (44.4%) | 0 (0.0%) |
| 45 to 54 Years | 0 (0.0%) | 23 (100.0%) |
| 55 to 64 Years | 13 (100.0%) | 3 (100.0%) |
| 65 to 74 Years | 21 (100.0%) | 0 (0.0%) |
| 75 Years and over | 0 (0.0%) | 0 (0.0%) |
| Total | 93 (94.9%) | 93 (100.0%) |
Income Below Poverty Among Married-Couple Families in Westside
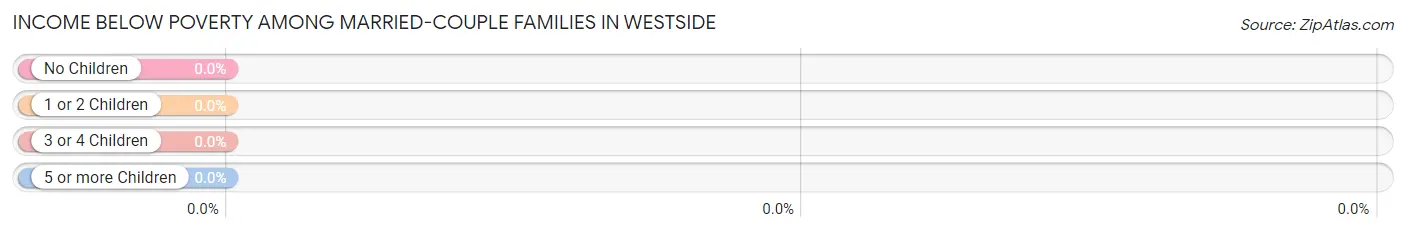
| Children | Above Poverty | Below Poverty |
| No Children | 8 (100.0%) | 0 (0.0%) |
| 1 or 2 Children | 13 (100.0%) | 0 (0.0%) |
| 3 or 4 Children | 5 (100.0%) | 0 (0.0%) |
| 5 or more Children | 0 (0.0%) | 0 (0.0%) |
| Total | 26 (100.0%) | 0 (0.0%) |
Income Below Poverty Among Single-Parent Households in Westside
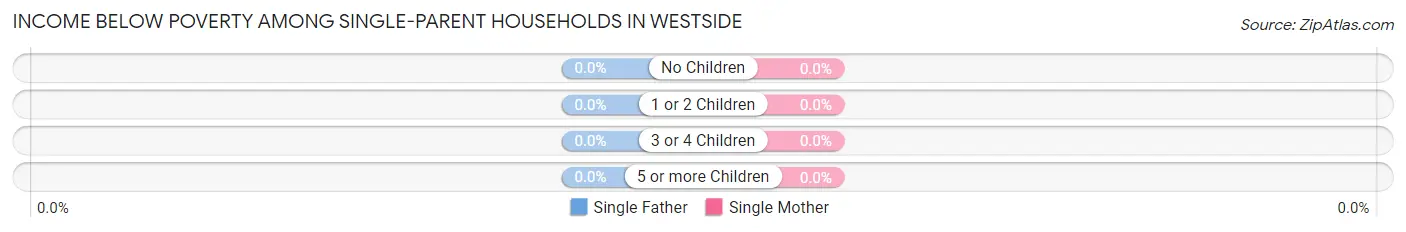
| Children | Single Father | Single Mother |
| No Children | 0 (0.0%) | 0 (0.0%) |
| 1 or 2 Children | 0 (0.0%) | 0 (0.0%) |
| 3 or 4 Children | 0 (0.0%) | 0 (0.0%) |
| 5 or more Children | 0 (0.0%) | 0 (0.0%) |
| Total | 0 (0.0%) | 0 (0.0%) |
Income Below Poverty Among Married-Couple vs Single-Parent Households in Westside
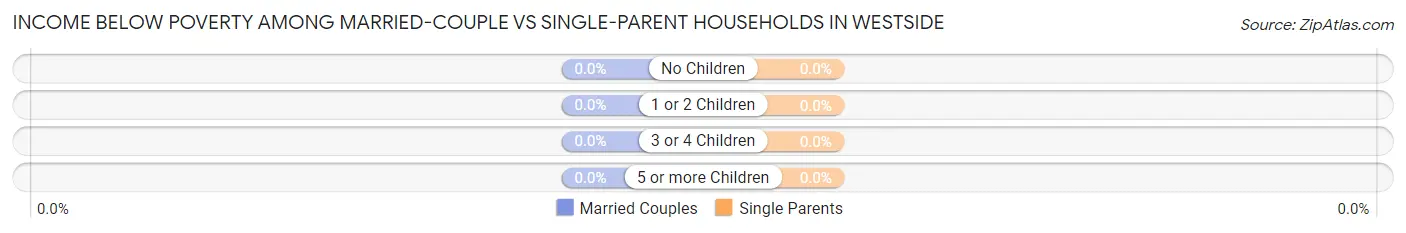
| Children | Married-Couple Families | Single-Parent Households |
| No Children | 0 (0.0%) | 0 (0.0%) |
| 1 or 2 Children | 0 (0.0%) | 0 (0.0%) |
| 3 or 4 Children | 0 (0.0%) | 0 (0.0%) |
| 5 or more Children | 0 (0.0%) | 0 (0.0%) |
| Total | 0 (0.0%) | 0 (0.0%) |
Race in Westside
The most populous races in Westside are Hispanic or Latino (191 | 100.0%), and Some other Race (191 | 100.0%).
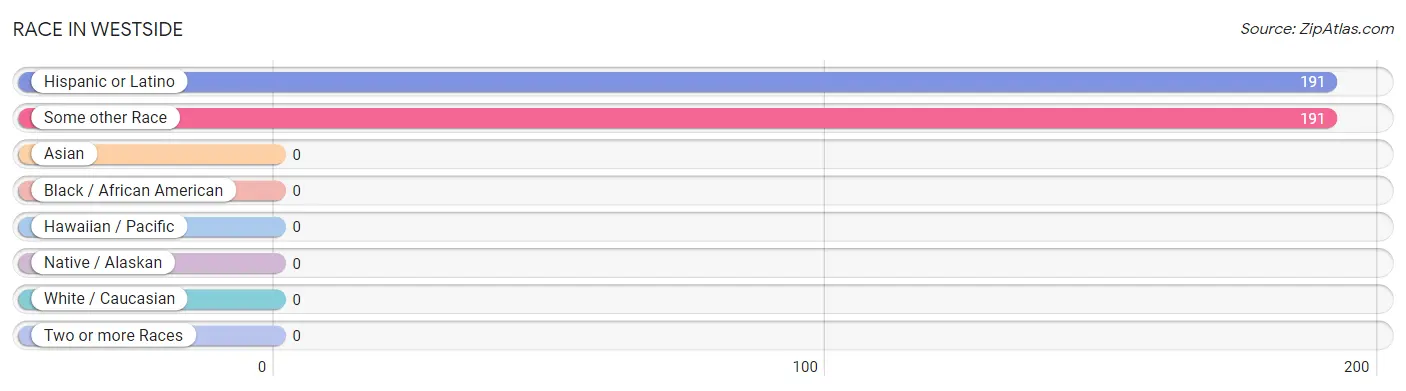
| Race | # Population | % Population |
| Asian | 0 | 0.0% |
| Black / African American | 0 | 0.0% |
| Hawaiian / Pacific | 0 | 0.0% |
| Hispanic or Latino | 191 | 100.0% |
| Native / Alaskan | 0 | 0.0% |
| White / Caucasian | 0 | 0.0% |
| Two or more Races | 0 | 0.0% |
| Some other Race | 191 | 100.0% |
| Total | 191 | 100.0% |
Ancestry in Westside
The most populous ancestries reported in Westside are , and Mexican (191 | 100.0%), together accounting for 100.0% of all Westside residents.

| Ancestry | # Population | % Population |
| Mexican | 191 | 100.0% | View All 1 Rows |
Immigrants in Westside
The most numerous immigrant groups reported in Westside came from Central America (97 | 50.8%), Latin America (97 | 50.8%), and Mexico (97 | 50.8%), together accounting for 152.4% of all Westside residents.
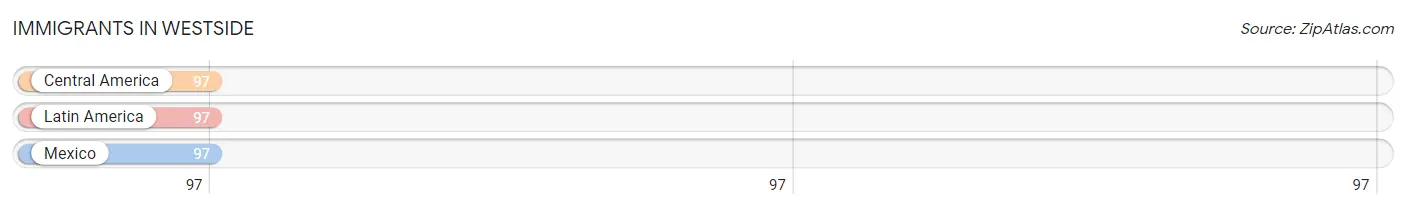
| Immigration Origin | # Population | % Population |
| Central America | 97 | 50.8% |
| Latin America | 97 | 50.8% |
| Mexico | 97 | 50.8% | View All 3 Rows |
Sex and Age in Westside
Sex and Age in Westside
The most populous age groups in Westside are 20 to 24 Years (36 | 36.7%) for men and 20 to 24 Years (25 | 26.9%) for women.
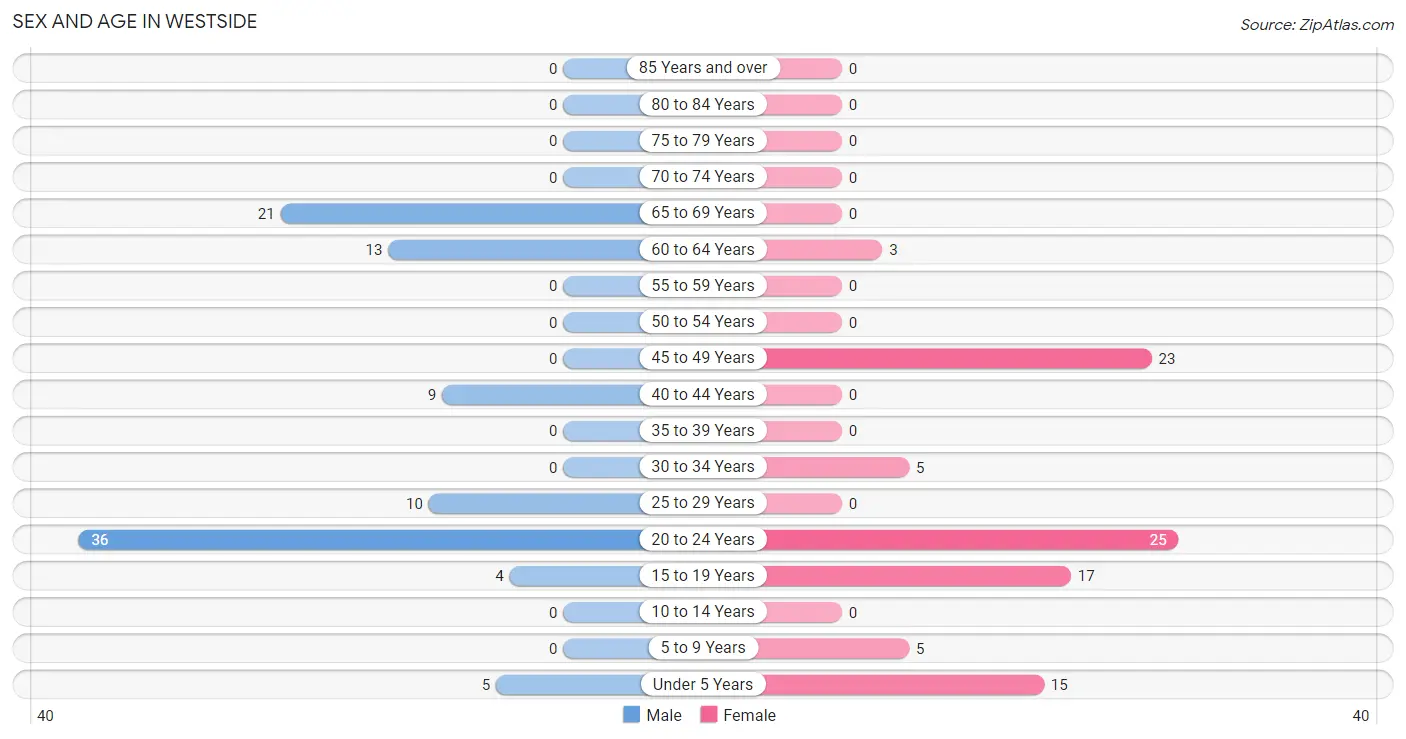
| Age Bracket | Male | Female |
| Under 5 Years | 5 (5.1%) | 15 (16.1%) |
| 5 to 9 Years | 0 (0.0%) | 5 (5.4%) |
| 10 to 14 Years | 0 (0.0%) | 0 (0.0%) |
| 15 to 19 Years | 4 (4.1%) | 17 (18.3%) |
| 20 to 24 Years | 36 (36.7%) | 25 (26.9%) |
| 25 to 29 Years | 10 (10.2%) | 0 (0.0%) |
| 30 to 34 Years | 0 (0.0%) | 5 (5.4%) |
| 35 to 39 Years | 0 (0.0%) | 0 (0.0%) |
| 40 to 44 Years | 9 (9.2%) | 0 (0.0%) |
| 45 to 49 Years | 0 (0.0%) | 23 (24.7%) |
| 50 to 54 Years | 0 (0.0%) | 0 (0.0%) |
| 55 to 59 Years | 0 (0.0%) | 0 (0.0%) |
| 60 to 64 Years | 13 (13.3%) | 3 (3.2%) |
| 65 to 69 Years | 21 (21.4%) | 0 (0.0%) |
| 70 to 74 Years | 0 (0.0%) | 0 (0.0%) |
| 75 to 79 Years | 0 (0.0%) | 0 (0.0%) |
| 80 to 84 Years | 0 (0.0%) | 0 (0.0%) |
| 85 Years and over | 0 (0.0%) | 0 (0.0%) |
| Total | 98 (100.0%) | 93 (100.0%) |
Families and Households in Westside
Median Family Size in Westside
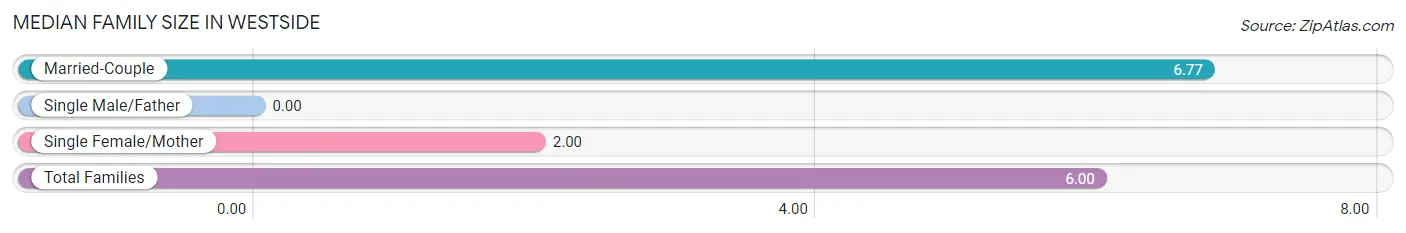
| Family Type | # Families | Family Size |
| Married-Couple | 26 (83.9%) | 6.77 |
| Single Male/Father | 0 (0.0%) | - |
| Single Female/Mother | 5 (16.1%) | 2.00 |
| Total Families | 31 (100.0%) | 6.00 |
Median Household Size in Westside
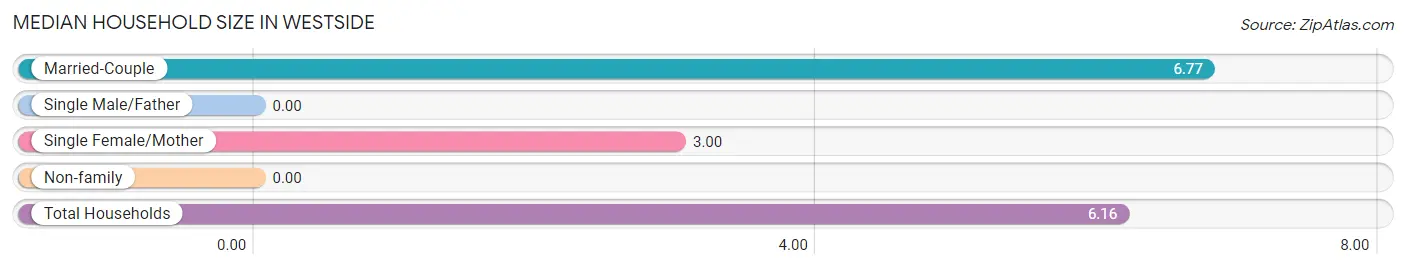
| Household Type | # Households | Household Size |
| Married-Couple | 26 (83.9%) | 6.77 |
| Single Male/Father | 0 (0.0%) | - |
| Single Female/Mother | 5 (16.1%) | 3.00 |
| Non-family | 0 (0.0%) | - |
| Total Households | 31 (100.0%) | 6.16 |
Household Size by Marriage Status in Westside
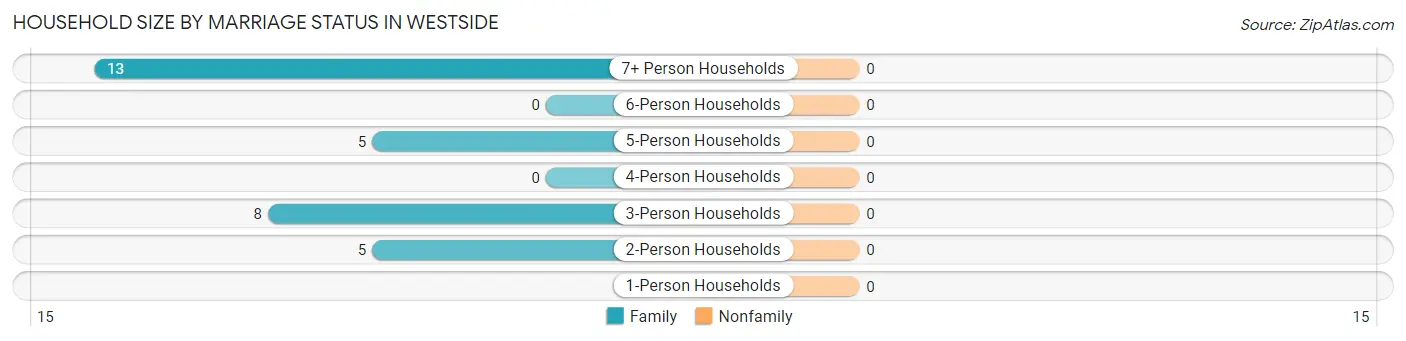
| Household Size | Family Households | Nonfamily Households |
| 1-Person Households | - | 0 (0.0%) |
| 2-Person Households | 5 (16.1%) | 0 (0.0%) |
| 3-Person Households | 8 (25.8%) | 0 (0.0%) |
| 4-Person Households | 0 (0.0%) | 0 (0.0%) |
| 5-Person Households | 5 (16.1%) | 0 (0.0%) |
| 6-Person Households | 0 (0.0%) | 0 (0.0%) |
| 7+ Person Households | 13 (41.9%) | 0 (0.0%) |
| Total | 31 (100.0%) | 0 (0.0%) |
Female Fertility in Westside
Fertility by Age in Westside
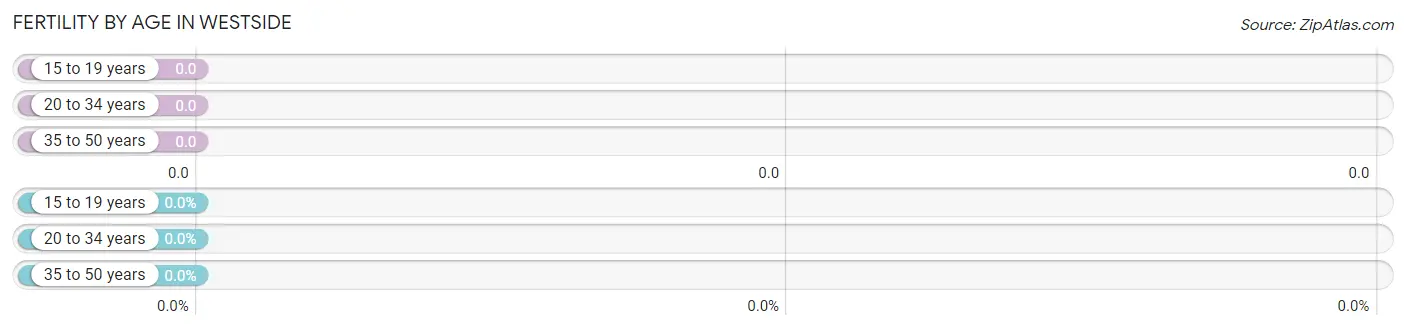
| Age Bracket | Women with Births | Births / 1,000 Women |
| 15 to 19 years | 0 (0.0%) | 0.0 |
| 20 to 34 years | 0 (0.0%) | 0.0 |
| 35 to 50 years | 0 (0.0%) | 0.0 |
| Total | 0 (0.0%) | 0.0 |
Fertility by Age by Marriage Status in Westside
| Age Bracket | Married | Unmarried |
| 15 to 19 years | 0 (0.0%) | 0 (0.0%) |
| 20 to 34 years | 0 (0.0%) | 0 (0.0%) |
| 35 to 50 years | 0 (0.0%) | 0 (0.0%) |
| Total | 0 (0.0%) | 0 (0.0%) |
Fertility by Education in Westside
| Educational Attainment | Women with Births | Births / 1,000 Women |
| Less than High School | 0 (0.0%) | 0.0 |
| High School Diploma | 0 (0.0%) | 0.0 |
| College or Associate's Degree | 0 (0.0%) | 0.0 |
| Bachelor's Degree | 0 (0.0%) | 0.0 |
| Graduate Degree | 0 (0.0%) | 0.0 |
| Total | 0 (0.0%) | 0.0 |
Fertility by Education by Marriage Status in Westside
| Educational Attainment | Married | Unmarried |
| Less than High School | 0 (0.0%) | 0 (0.0%) |
| High School Diploma | 0 (0.0%) | 0 (0.0%) |
| College or Associate's Degree | 0 (0.0%) | 0 (0.0%) |
| Bachelor's Degree | 0 (0.0%) | 0 (0.0%) |
| Graduate Degree | 0 (0.0%) | 0 (0.0%) |
| Total | 0 (0.0%) | 0 (0.0%) |
Employment Characteristics in Westside
Employment by Class of Employer in Westside
Among the 34 employed individuals in Westside, , and private company employees (34 | 100.0%) make up the most common classes of employment.
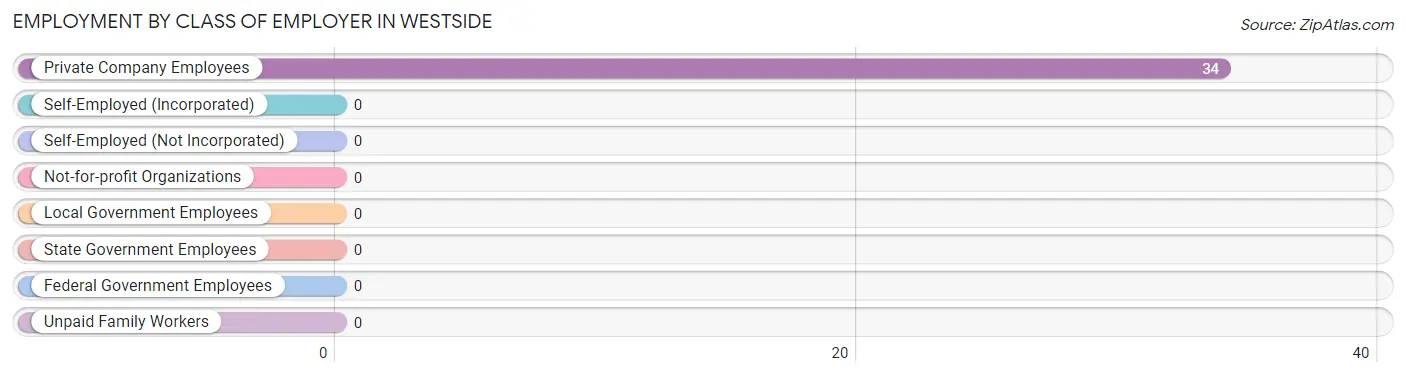
| Employer Class | # Employees | % Employees |
| Private Company Employees | 34 | 100.0% |
| Self-Employed (Incorporated) | 0 | 0.0% |
| Self-Employed (Not Incorporated) | 0 | 0.0% |
| Not-for-profit Organizations | 0 | 0.0% |
| Local Government Employees | 0 | 0.0% |
| State Government Employees | 0 | 0.0% |
| Federal Government Employees | 0 | 0.0% |
| Unpaid Family Workers | 0 | 0.0% |
| Total | 34 | 100.0% |
Employment Status by Age in Westside
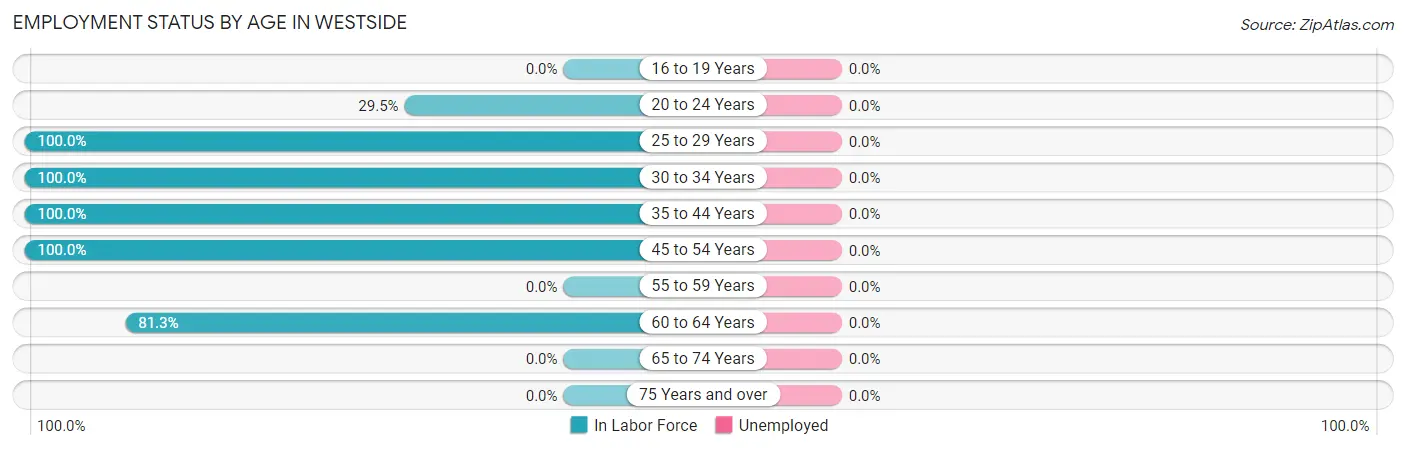
| Age Bracket | In Labor Force | Unemployed |
| 16 to 19 Years | 0 (0.0%) | 0 (0.0%) |
| 20 to 24 Years | 18 (29.5%) | 0 (0.0%) |
| 25 to 29 Years | 10 (100.0%) | 0 (0.0%) |
| 30 to 34 Years | 5 (100.0%) | 0 (0.0%) |
| 35 to 44 Years | 9 (100.0%) | 0 (0.0%) |
| 45 to 54 Years | 23 (100.0%) | 0 (0.0%) |
| 55 to 59 Years | 0 (0.0%) | 0 (0.0%) |
| 60 to 64 Years | 13 (81.3%) | 0 (0.0%) |
| 65 to 74 Years | 0 (0.0%) | 0 (0.0%) |
| 75 Years and over | 0 (0.0%) | 0 (0.0%) |
| Total | 78 (47.0%) | 0 (0.0%) |
Employment Status by Educational Attainment in Westside
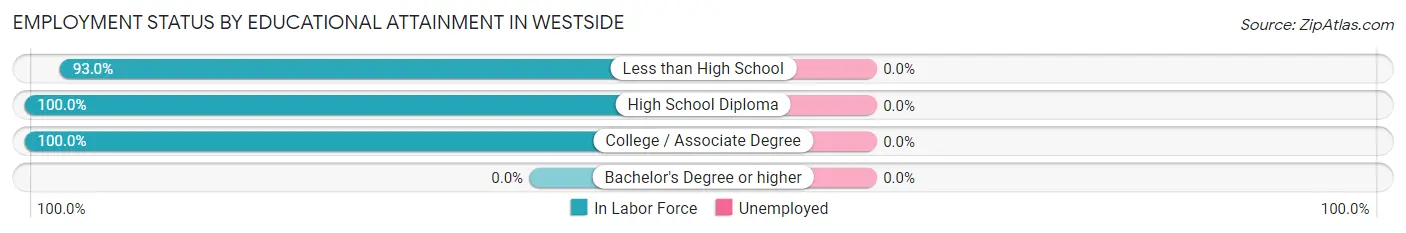
| Educational Attainment | In Labor Force | Unemployed |
| Less than High School | 40 (93.0%) | 0 (0.0%) |
| High School Diploma | 15 (100.0%) | 0 (0.0%) |
| College / Associate Degree | 5 (100.0%) | 0 (0.0%) |
| Bachelor's Degree or higher | 0 (0.0%) | 0 (0.0%) |
| Total | 60 (95.2%) | 0 (0.0%) |
Employment Occupations by Sex in Westside
Management, Business, Science and Arts Occupations
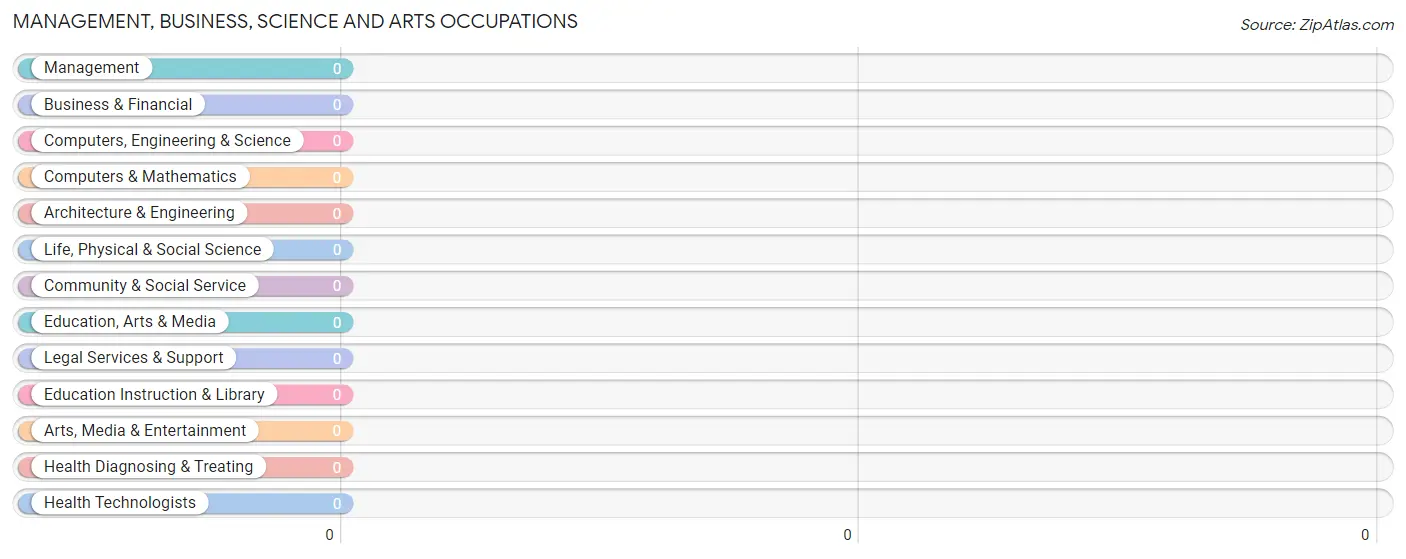
Management, Business, Science and Arts Occupations by Sex
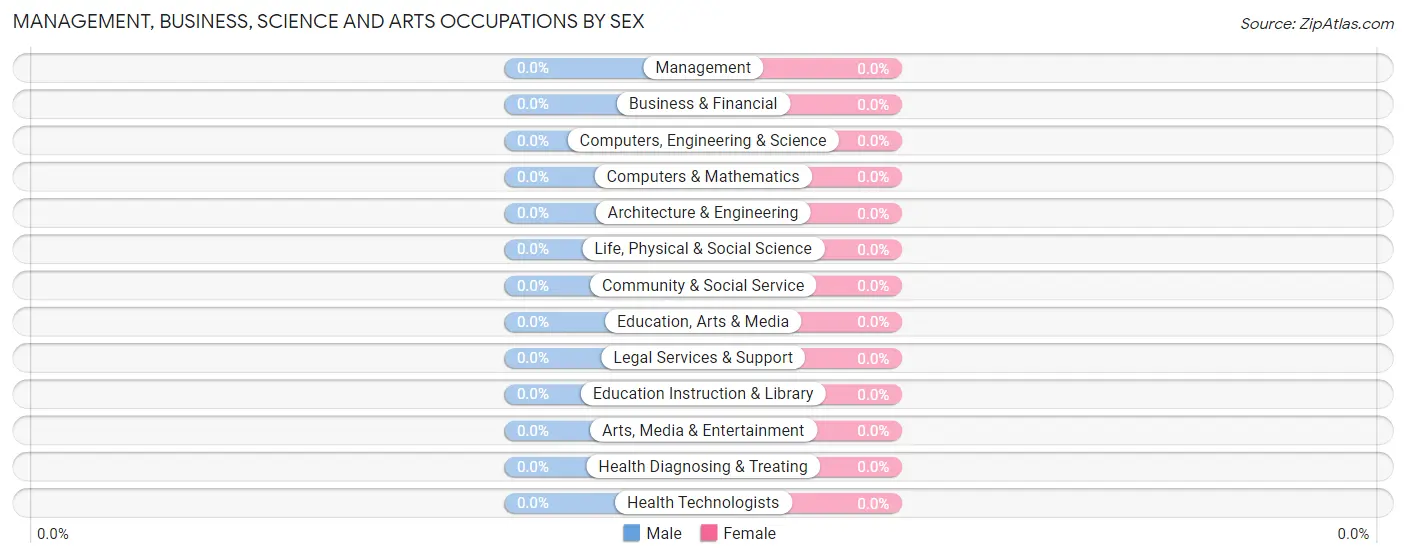
| Occupation | Male | Female |
| Management | 0 (0.0%) | 0 (0.0%) |
| Business & Financial | 0 (0.0%) | 0 (0.0%) |
| Computers, Engineering & Science | 0 (0.0%) | 0 (0.0%) |
| Computers & Mathematics | 0 (0.0%) | 0 (0.0%) |
| Architecture & Engineering | 0 (0.0%) | 0 (0.0%) |
| Life, Physical & Social Science | 0 (0.0%) | 0 (0.0%) |
| Community & Social Service | 0 (0.0%) | 0 (0.0%) |
| Education, Arts & Media | 0 (0.0%) | 0 (0.0%) |
| Legal Services & Support | 0 (0.0%) | 0 (0.0%) |
| Education Instruction & Library | 0 (0.0%) | 0 (0.0%) |
| Arts, Media & Entertainment | 0 (0.0%) | 0 (0.0%) |
| Health Diagnosing & Treating | 0 (0.0%) | 0 (0.0%) |
| Health Technologists | 0 (0.0%) | 0 (0.0%) |
| Total (Category) | 0 (0.0%) | 0 (0.0%) |
| Total (Overall) | 50 (64.1%) | 28 (35.9%) |
Services Occupations
Services Occupations by Sex
| Occupation | Male | Female |
| Healthcare Support | 0 (0.0%) | 0 (0.0%) |
| Security & Protection | 0 (0.0%) | 0 (0.0%) |
| Firefighting & Prevention | 0 (0.0%) | 0 (0.0%) |
| Law Enforcement | 0 (0.0%) | 0 (0.0%) |
| Food Preparation & Serving | 0 (0.0%) | 0 (0.0%) |
| Cleaning & Maintenance | 0 (0.0%) | 0 (0.0%) |
| Personal Care & Service | 0 (0.0%) | 0 (0.0%) |
| Total (Category) | 0 (0.0%) | 0 (0.0%) |
| Total (Overall) | 50 (64.1%) | 28 (35.9%) |
Sales and Office Occupations
Sales and Office Occupations by Sex
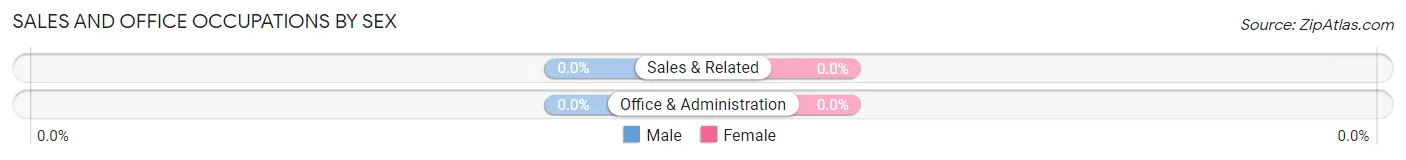
| Occupation | Male | Female |
| Sales & Related | 0 (0.0%) | 0 (0.0%) |
| Office & Administration | 0 (0.0%) | 0 (0.0%) |
| Total (Category) | 0 (0.0%) | 0 (0.0%) |
| Total (Overall) | 50 (64.1%) | 28 (35.9%) |
Natural Resources, Construction and Maintenance Occupations
The most common Natural Resources, Construction and Maintenance occupations in Westside are , and Farming, Fishing & Forestry (73 | 93.6%).
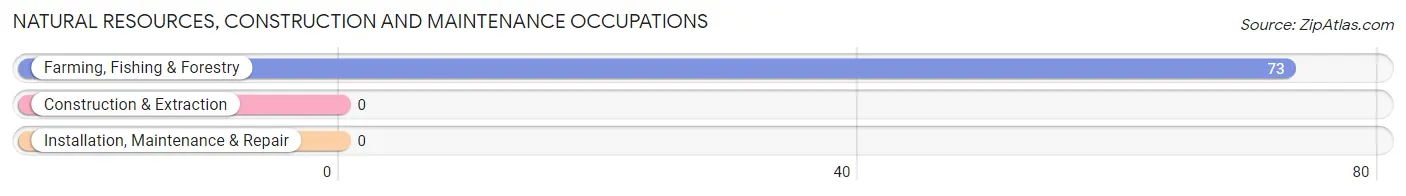
Natural Resources, Construction and Maintenance Occupations by Sex
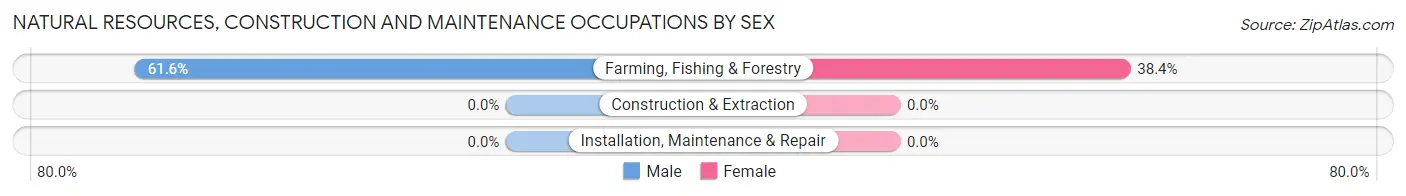
| Occupation | Male | Female |
| Farming, Fishing & Forestry | 45 (61.6%) | 28 (38.4%) |
| Construction & Extraction | 0 (0.0%) | 0 (0.0%) |
| Installation, Maintenance & Repair | 0 (0.0%) | 0 (0.0%) |
| Total (Category) | 45 (61.6%) | 28 (38.4%) |
| Total (Overall) | 50 (64.1%) | 28 (35.9%) |
Production, Transportation and Moving Occupations
The most common Production, Transportation and Moving occupations in Westside are , and Material Moving (5 | 6.4%).
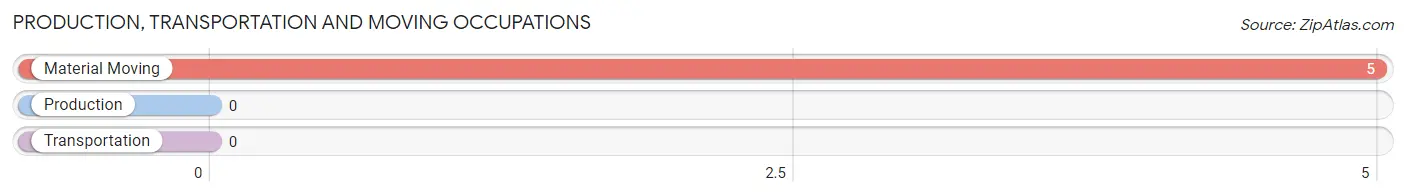
Production, Transportation and Moving Occupations by Sex
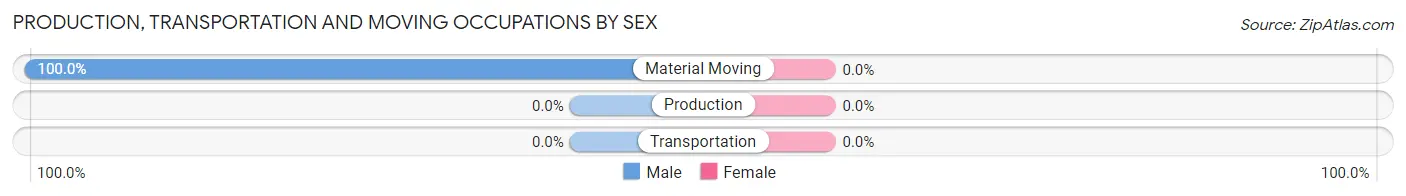
| Occupation | Male | Female |
| Production | 0 (0.0%) | 0 (0.0%) |
| Transportation | 0 (0.0%) | 0 (0.0%) |
| Material Moving | 5 (100.0%) | 0 (0.0%) |
| Total (Category) | 5 (100.0%) | 0 (0.0%) |
| Total (Overall) | 50 (64.1%) | 28 (35.9%) |
Employment Industries by Sex in Westside
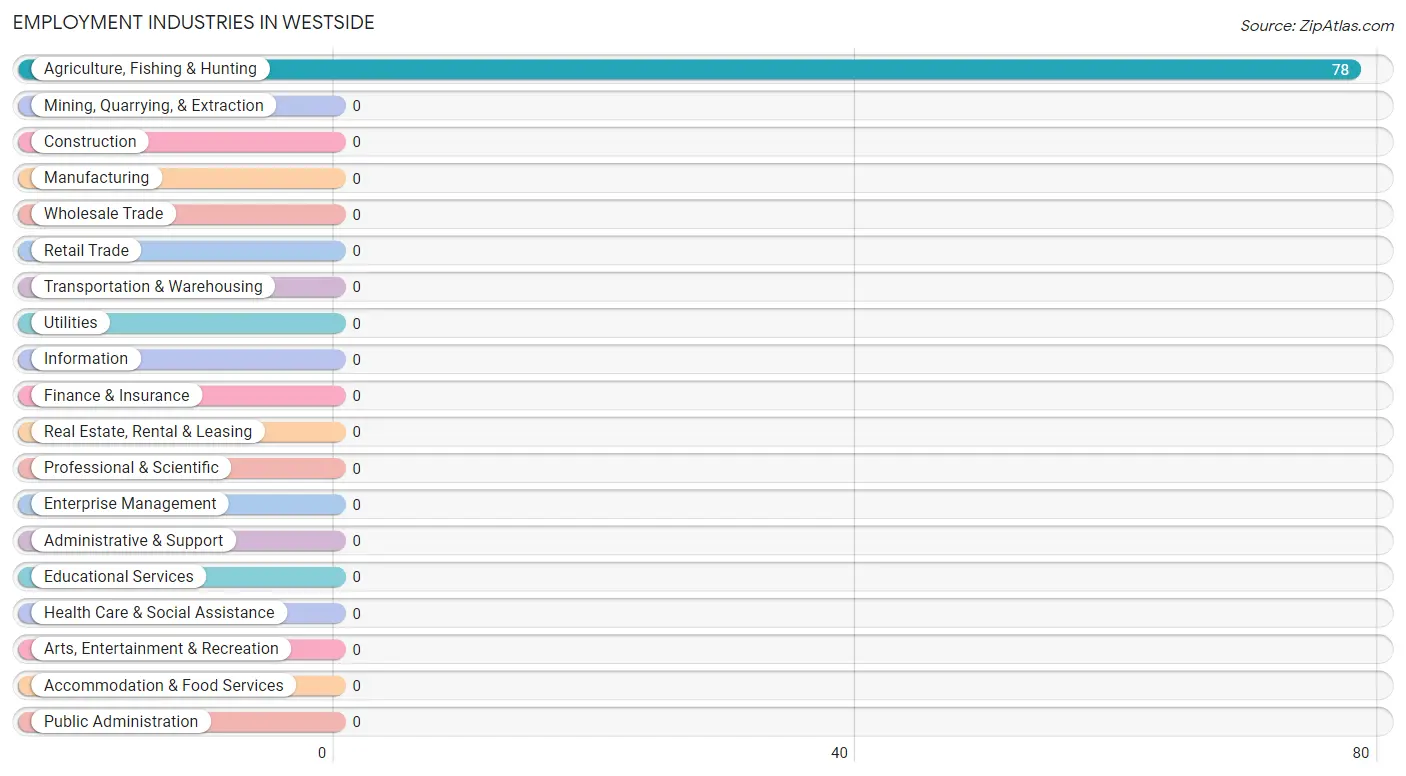
Employment Industries in Westside
The major employment industries in Westside include , and Agriculture, Fishing & Hunting (78 | 100.0%).
Employment Industries by Sex in Westside
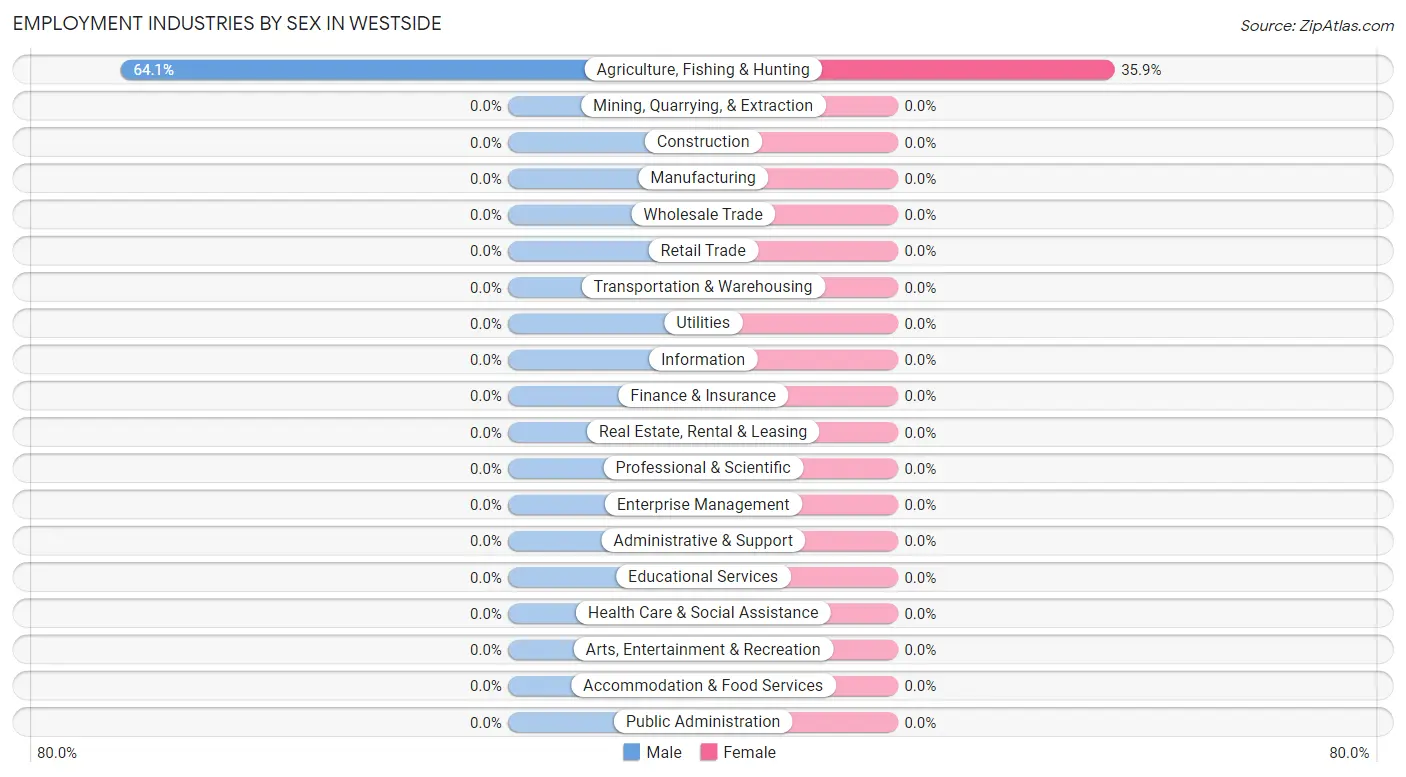
| Industry | Male | Female |
| Agriculture, Fishing & Hunting | 50 (64.1%) | 28 (35.9%) |
| Mining, Quarrying, & Extraction | 0 (0.0%) | 0 (0.0%) |
| Construction | 0 (0.0%) | 0 (0.0%) |
| Manufacturing | 0 (0.0%) | 0 (0.0%) |
| Wholesale Trade | 0 (0.0%) | 0 (0.0%) |
| Retail Trade | 0 (0.0%) | 0 (0.0%) |
| Transportation & Warehousing | 0 (0.0%) | 0 (0.0%) |
| Utilities | 0 (0.0%) | 0 (0.0%) |
| Information | 0 (0.0%) | 0 (0.0%) |
| Finance & Insurance | 0 (0.0%) | 0 (0.0%) |
| Real Estate, Rental & Leasing | 0 (0.0%) | 0 (0.0%) |
| Professional & Scientific | 0 (0.0%) | 0 (0.0%) |
| Enterprise Management | 0 (0.0%) | 0 (0.0%) |
| Administrative & Support | 0 (0.0%) | 0 (0.0%) |
| Educational Services | 0 (0.0%) | 0 (0.0%) |
| Health Care & Social Assistance | 0 (0.0%) | 0 (0.0%) |
| Arts, Entertainment & Recreation | 0 (0.0%) | 0 (0.0%) |
| Accommodation & Food Services | 0 (0.0%) | 0 (0.0%) |
| Public Administration | 0 (0.0%) | 0 (0.0%) |
| Total | 50 (64.1%) | 28 (35.9%) |
Education in Westside
School Enrollment in Westside
The most common levels of schooling among the 14 students in Westside are nursery / preschool (5 | 35.7%), kindergarten (5 | 35.7%), and high school (4 | 28.6%).
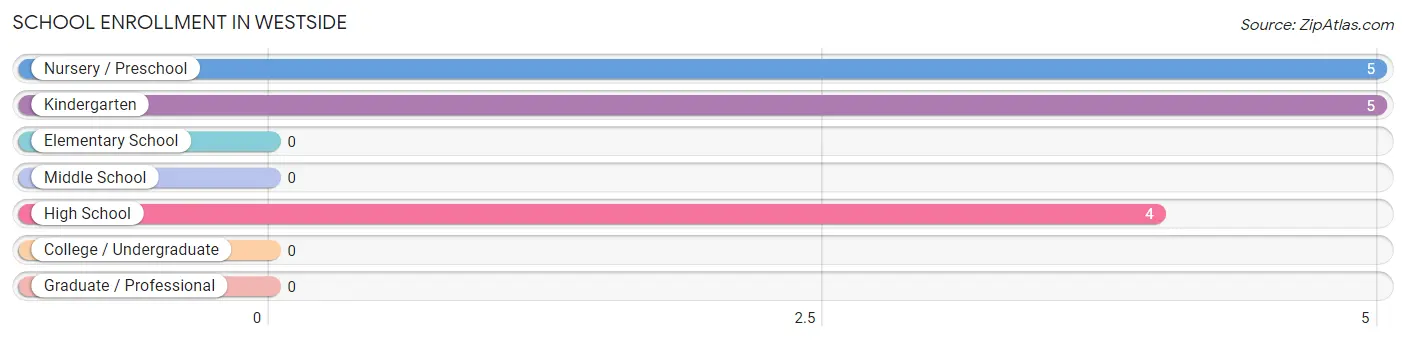
| School Level | # Students | % Students |
| Nursery / Preschool | 5 | 35.7% |
| Kindergarten | 5 | 35.7% |
| Elementary School | 0 | 0.0% |
| Middle School | 0 | 0.0% |
| High School | 4 | 28.6% |
| College / Undergraduate | 0 | 0.0% |
| Graduate / Professional | 0 | 0.0% |
| Total | 14 | 100.0% |
School Enrollment by Age by Funding Source in Westside
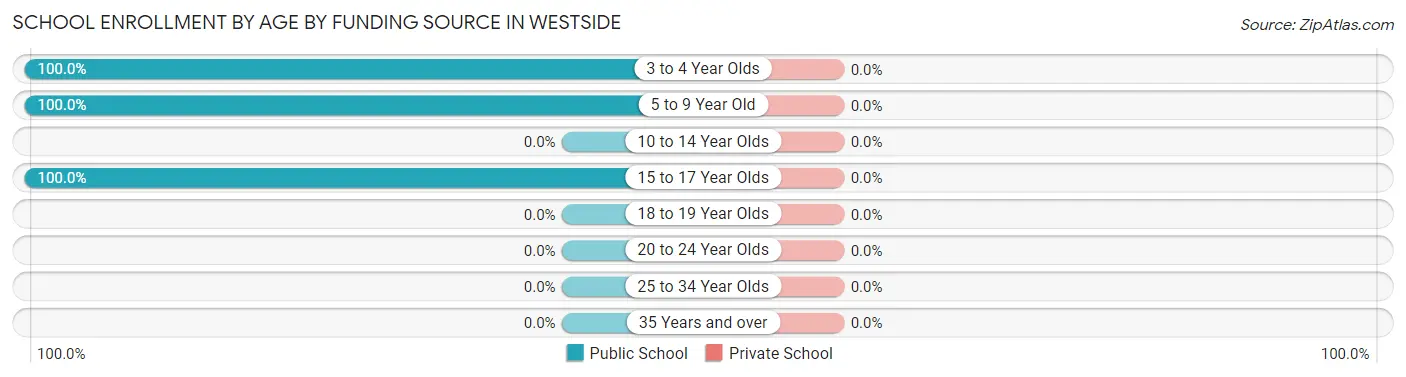
| Age Bracket | Public School | Private School |
| 3 to 4 Year Olds | 5 (100.0%) | 0 (0.0%) |
| 5 to 9 Year Old | 5 (100.0%) | 0 (0.0%) |
| 10 to 14 Year Olds | 0 (0.0%) | 0 (0.0%) |
| 15 to 17 Year Olds | 4 (100.0%) | 0 (0.0%) |
| 18 to 19 Year Olds | 0 (0.0%) | 0 (0.0%) |
| 20 to 24 Year Olds | 0 (0.0%) | 0 (0.0%) |
| 25 to 34 Year Olds | 0 (0.0%) | 0 (0.0%) |
| 35 Years and over | 0 (0.0%) | 0 (0.0%) |
| Total | 14 (100.0%) | 0 (0.0%) |
Educational Attainment by Field of Study in Westside
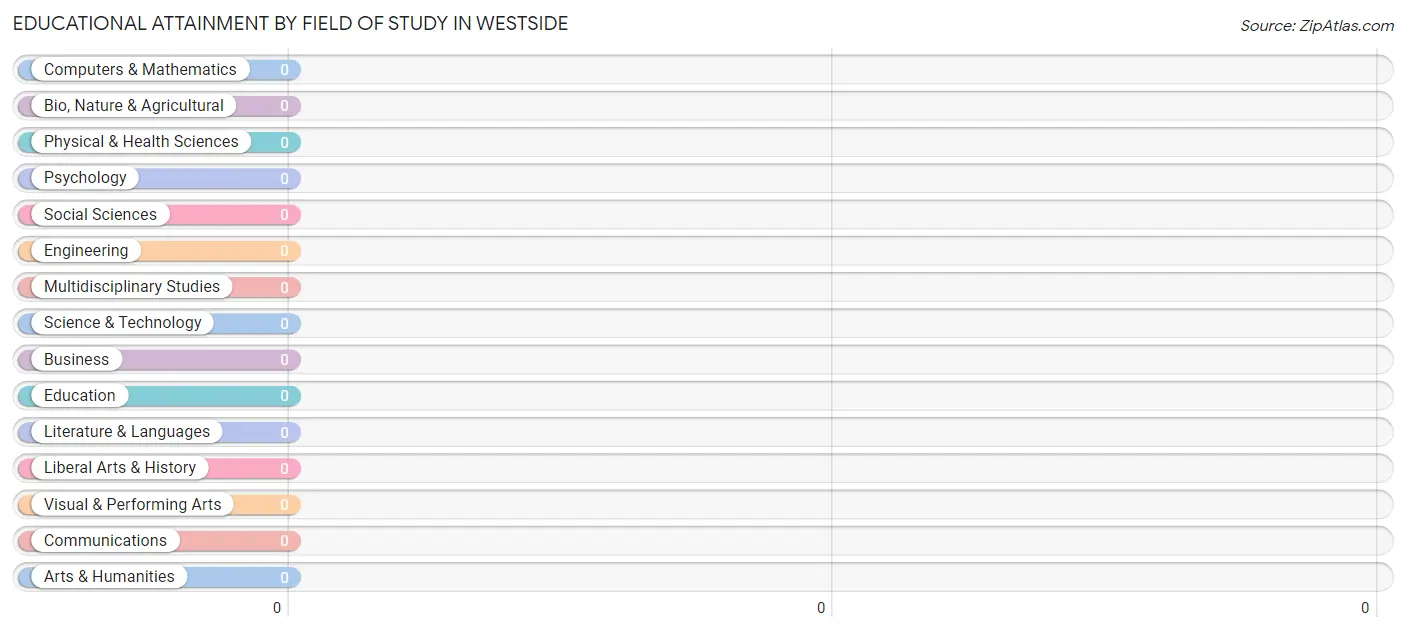
| Field of Study | # Graduates | % Graduates |
| Computers & Mathematics | 0 | 0.0% |
| Bio, Nature & Agricultural | 0 | 0.0% |
| Physical & Health Sciences | 0 | 0.0% |
| Psychology | 0 | 0.0% |
| Social Sciences | 0 | 0.0% |
| Engineering | 0 | 0.0% |
| Multidisciplinary Studies | 0 | 0.0% |
| Science & Technology | 0 | 0.0% |
| Business | 0 | 0.0% |
| Education | 0 | 0.0% |
| Literature & Languages | 0 | 0.0% |
| Liberal Arts & History | 0 | 0.0% |
| Visual & Performing Arts | 0 | 0.0% |
| Communications | 0 | 0.0% |
| Arts & Humanities | 0 | 0.0% |
| Total | 0 | 0.0% |
Transportation & Commute in Westside
Vehicle Availability by Sex in Westside
The most prevalent vehicle ownership categories in Westside are males with 3 vehicles (10, accounting for 52.6%) and females with 3 vehicles (10, making up 66.7%).
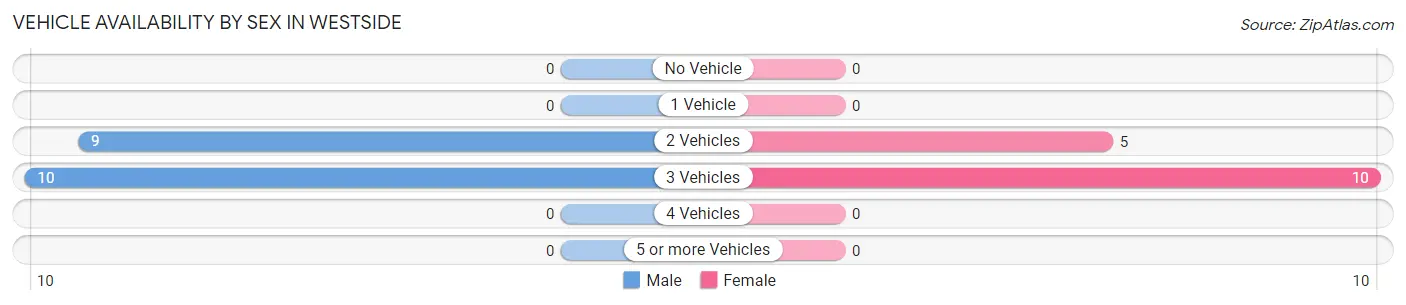
| Vehicles Available | Male | Female |
| No Vehicle | 0 (0.0%) | 0 (0.0%) |
| 1 Vehicle | 0 (0.0%) | 0 (0.0%) |
| 2 Vehicles | 9 (47.4%) | 5 (33.3%) |
| 3 Vehicles | 10 (52.6%) | 10 (66.7%) |
| 4 Vehicles | 0 (0.0%) | 0 (0.0%) |
| 5 or more Vehicles | 0 (0.0%) | 0 (0.0%) |
| Total | 19 (100.0%) | 15 (100.0%) |
Commute Time in Westside
The most frequently occuring commute durations in Westside are 30 to 34 minutes (9 commuters, 26.5%), less than 5 minutes (5 commuters, 14.7%), and 10 to 14 minutes (5 commuters, 14.7%).
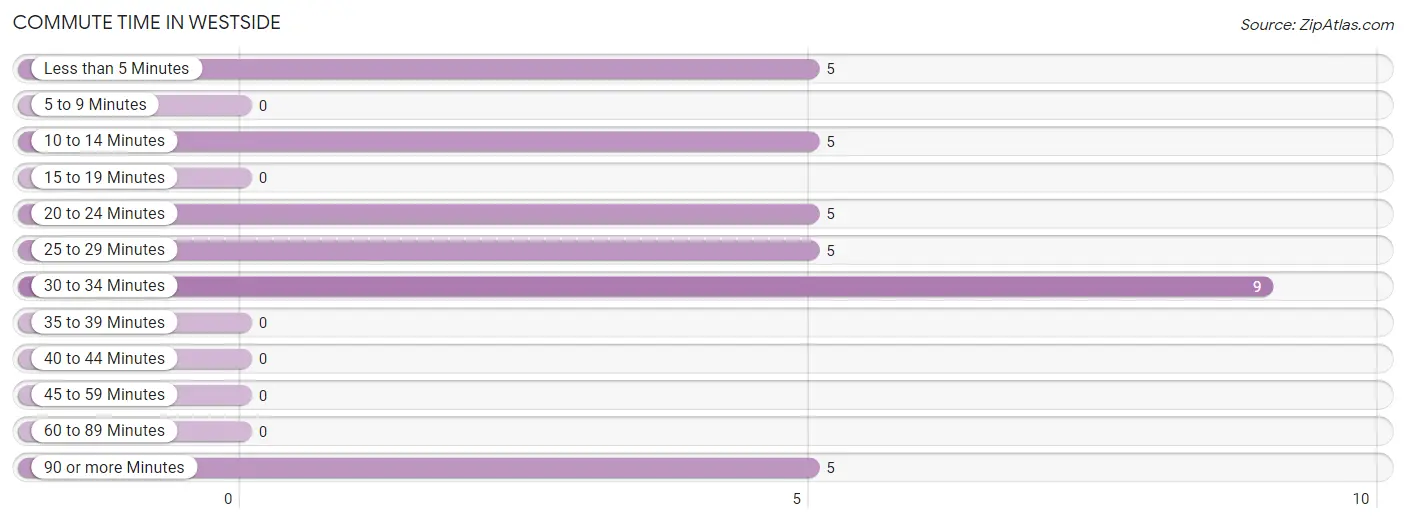
| Commute Time | # Commuters | % Commuters |
| Less than 5 Minutes | 5 | 14.7% |
| 5 to 9 Minutes | 0 | 0.0% |
| 10 to 14 Minutes | 5 | 14.7% |
| 15 to 19 Minutes | 0 | 0.0% |
| 20 to 24 Minutes | 5 | 14.7% |
| 25 to 29 Minutes | 5 | 14.7% |
| 30 to 34 Minutes | 9 | 26.5% |
| 35 to 39 Minutes | 0 | 0.0% |
| 40 to 44 Minutes | 0 | 0.0% |
| 45 to 59 Minutes | 0 | 0.0% |
| 60 to 89 Minutes | 0 | 0.0% |
| 90 or more Minutes | 5 | 14.7% |
Commute Time by Sex in Westside
The most common commute times in Westside are less than 5 minutes (5 commuters, 26.3%) for males and 10 to 14 minutes (5 commuters, 33.3%) for females.
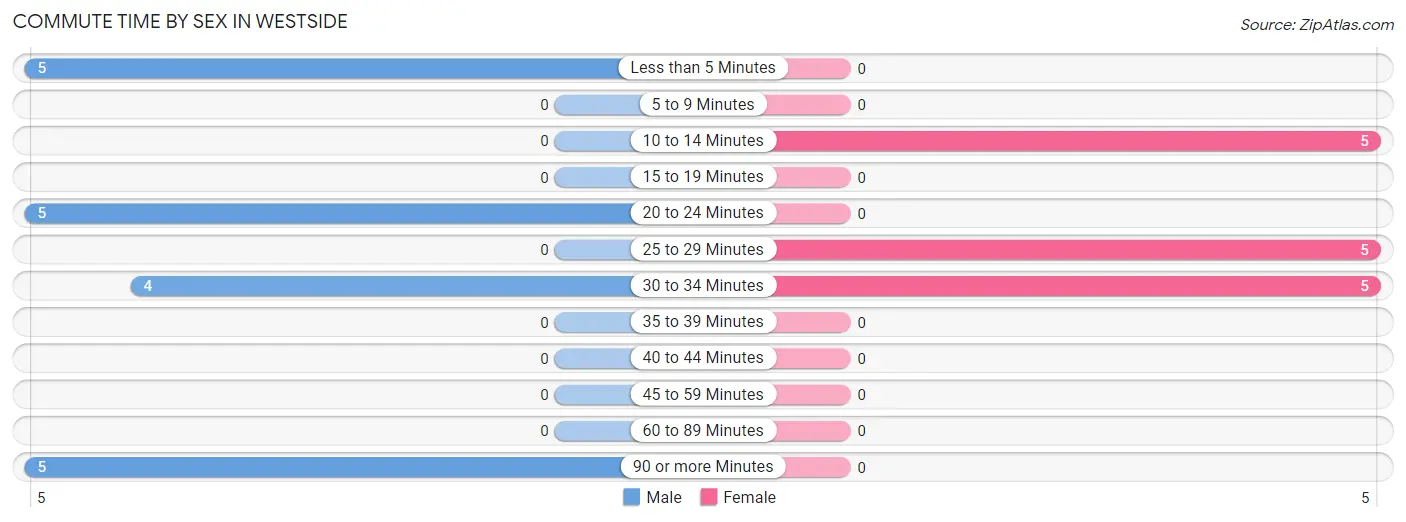
| Commute Time | Male | Female |
| Less than 5 Minutes | 5 (26.3%) | 0 (0.0%) |
| 5 to 9 Minutes | 0 (0.0%) | 0 (0.0%) |
| 10 to 14 Minutes | 0 (0.0%) | 5 (33.3%) |
| 15 to 19 Minutes | 0 (0.0%) | 0 (0.0%) |
| 20 to 24 Minutes | 5 (26.3%) | 0 (0.0%) |
| 25 to 29 Minutes | 0 (0.0%) | 5 (33.3%) |
| 30 to 34 Minutes | 4 (21.0%) | 5 (33.3%) |
| 35 to 39 Minutes | 0 (0.0%) | 0 (0.0%) |
| 40 to 44 Minutes | 0 (0.0%) | 0 (0.0%) |
| 45 to 59 Minutes | 0 (0.0%) | 0 (0.0%) |
| 60 to 89 Minutes | 0 (0.0%) | 0 (0.0%) |
| 90 or more Minutes | 5 (26.3%) | 0 (0.0%) |
Time of Departure to Work by Sex in Westside
The most frequent times of departure to work in Westside are 6:00 AM to 6:29 AM (9, 47.4%) for males and 7:00 AM to 7:29 AM (10, 66.7%) for females.
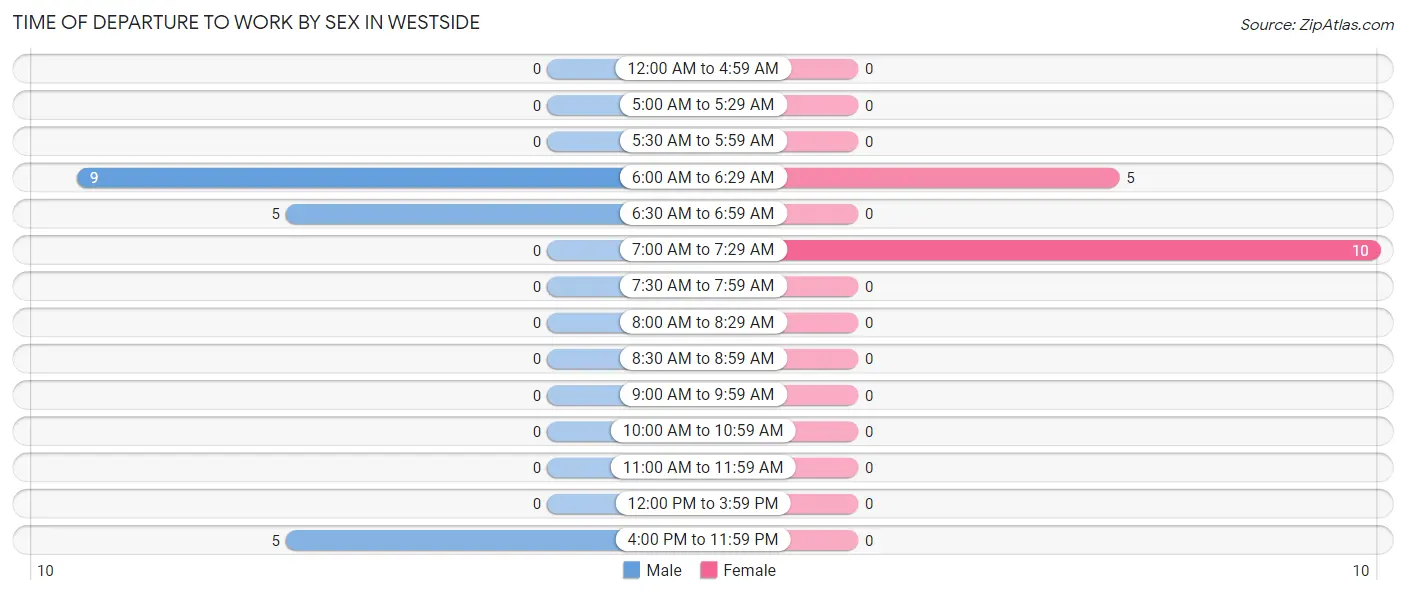
| Time of Departure | Male | Female |
| 12:00 AM to 4:59 AM | 0 (0.0%) | 0 (0.0%) |
| 5:00 AM to 5:29 AM | 0 (0.0%) | 0 (0.0%) |
| 5:30 AM to 5:59 AM | 0 (0.0%) | 0 (0.0%) |
| 6:00 AM to 6:29 AM | 9 (47.4%) | 5 (33.3%) |
| 6:30 AM to 6:59 AM | 5 (26.3%) | 0 (0.0%) |
| 7:00 AM to 7:29 AM | 0 (0.0%) | 10 (66.7%) |
| 7:30 AM to 7:59 AM | 0 (0.0%) | 0 (0.0%) |
| 8:00 AM to 8:29 AM | 0 (0.0%) | 0 (0.0%) |
| 8:30 AM to 8:59 AM | 0 (0.0%) | 0 (0.0%) |
| 9:00 AM to 9:59 AM | 0 (0.0%) | 0 (0.0%) |
| 10:00 AM to 10:59 AM | 0 (0.0%) | 0 (0.0%) |
| 11:00 AM to 11:59 AM | 0 (0.0%) | 0 (0.0%) |
| 12:00 PM to 3:59 PM | 0 (0.0%) | 0 (0.0%) |
| 4:00 PM to 11:59 PM | 5 (26.3%) | 0 (0.0%) |
| Total | 19 (100.0%) | 15 (100.0%) |
Housing Occupancy in Westside
Occupancy by Ownership in Westside
Of the total 31 dwellings in Westside, owner-occupied units account for 13 (41.9%), while renter-occupied units make up 18 (58.1%).
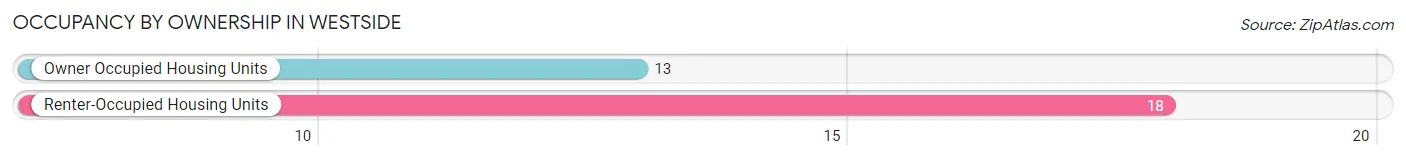
| Occupancy | # Housing Units | % Housing Units |
| Owner Occupied Housing Units | 13 | 41.9% |
| Renter-Occupied Housing Units | 18 | 58.1% |
| Total Occupied Housing Units | 31 | 100.0% |
Occupancy by Household Size in Westside
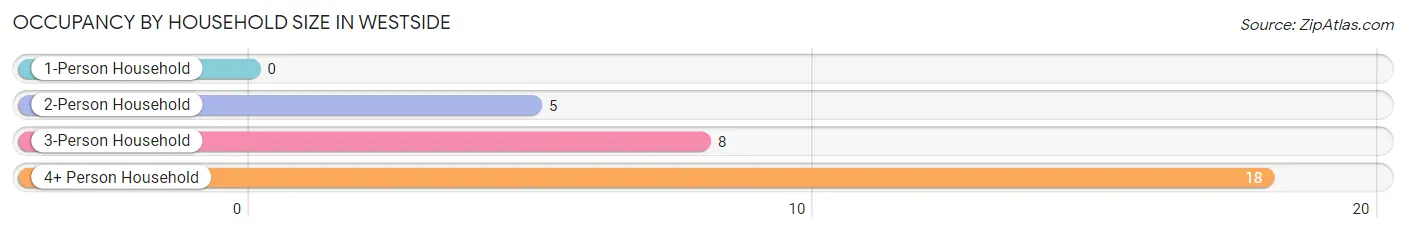
| Household Size | # Housing Units | % Housing Units |
| 1-Person Household | 0 | 0.0% |
| 2-Person Household | 5 | 16.1% |
| 3-Person Household | 8 | 25.8% |
| 4+ Person Household | 18 | 58.1% |
| Total Housing Units | 31 | 100.0% |
Occupancy by Ownership by Household Size in Westside
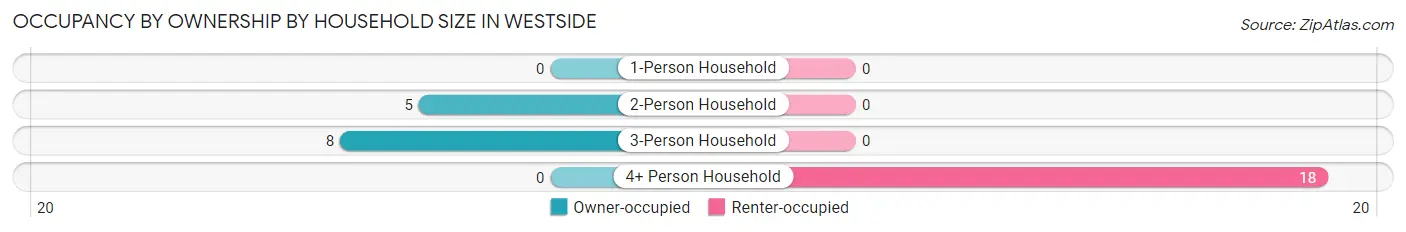
| Household Size | Owner-occupied | Renter-occupied |
| 1-Person Household | 0 (0.0%) | 0 (0.0%) |
| 2-Person Household | 5 (100.0%) | 0 (0.0%) |
| 3-Person Household | 8 (100.0%) | 0 (0.0%) |
| 4+ Person Household | 0 (0.0%) | 18 (100.0%) |
| Total Housing Units | 13 (41.9%) | 18 (58.1%) |
Occupancy by Educational Attainment in Westside
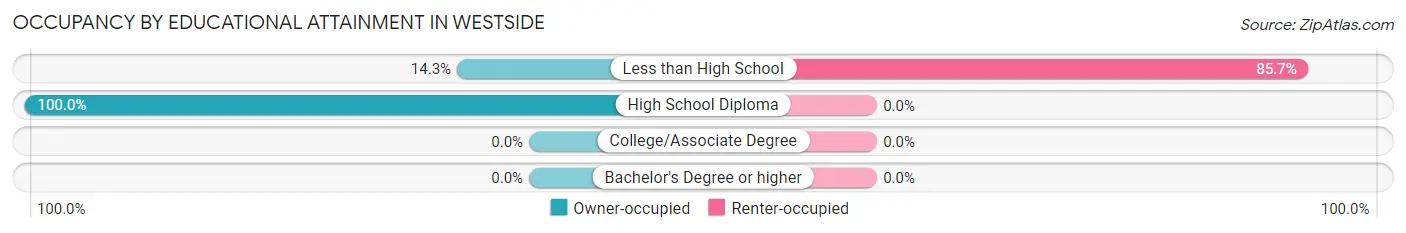
| Household Size | Owner-occupied | Renter-occupied |
| Less than High School | 3 (14.3%) | 18 (85.7%) |
| High School Diploma | 10 (100.0%) | 0 (0.0%) |
| College/Associate Degree | 0 (0.0%) | 0 (0.0%) |
| Bachelor's Degree or higher | 0 (0.0%) | 0 (0.0%) |
Occupancy by Age of Householder in Westside
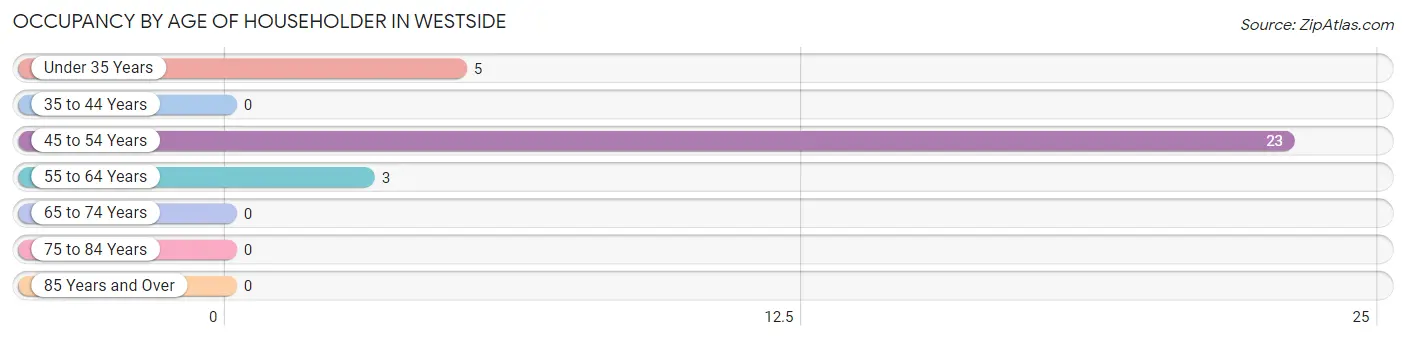
| Age Bracket | # Households | % Households |
| Under 35 Years | 5 | 16.1% |
| 35 to 44 Years | 0 | 0.0% |
| 45 to 54 Years | 23 | 74.2% |
| 55 to 64 Years | 3 | 9.7% |
| 65 to 74 Years | 0 | 0.0% |
| 75 to 84 Years | 0 | 0.0% |
| 85 Years and Over | 0 | 0.0% |
| Total | 31 | 100.0% |
Housing Finances in Westside
Median Income by Occupancy in Westside
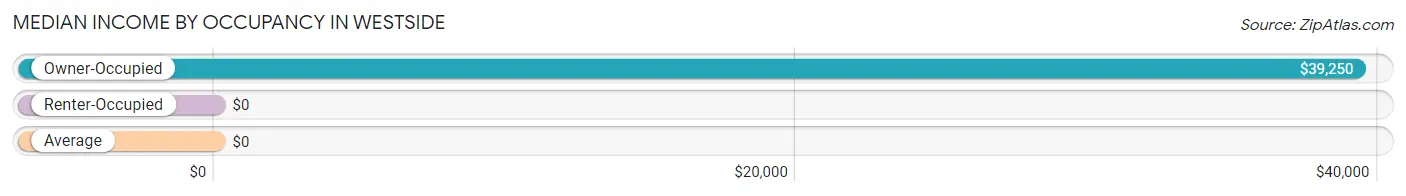
| Occupancy Type | # Households | Median Income |
| Owner-Occupied | 13 (41.9%) | $39,250 |
| Renter-Occupied | 18 (58.1%) | $0 |
| Average | 31 (100.0%) | $0 |
Occupancy by Householder Income Bracket in Westside
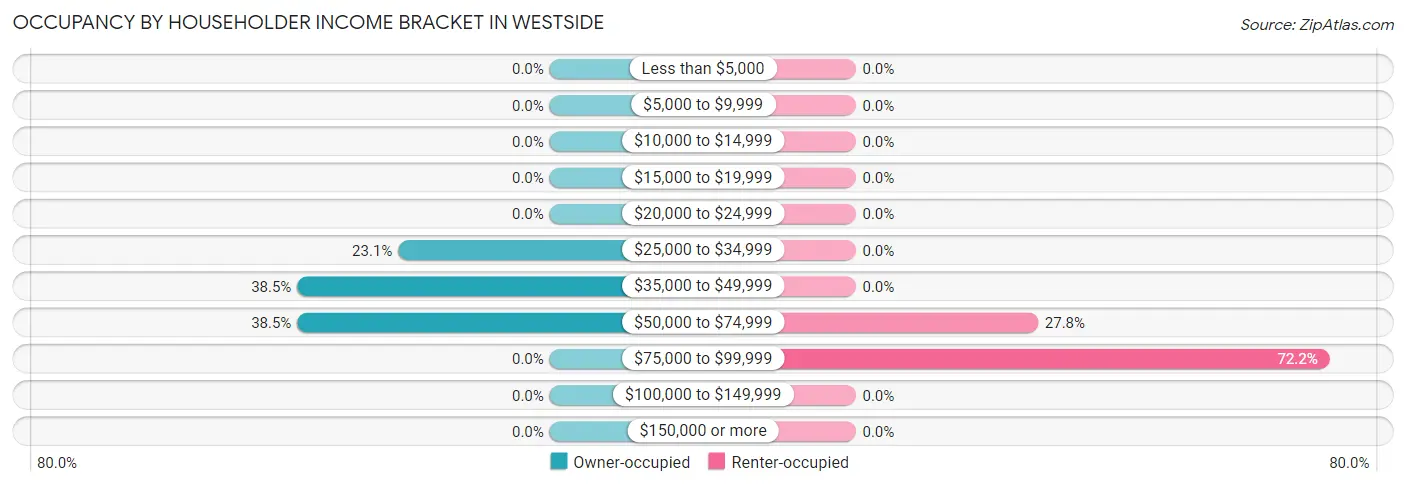
| Income Bracket | Owner-occupied | Renter-occupied |
| Less than $5,000 | 0 (0.0%) | 0 (0.0%) |
| $5,000 to $9,999 | 0 (0.0%) | 0 (0.0%) |
| $10,000 to $14,999 | 0 (0.0%) | 0 (0.0%) |
| $15,000 to $19,999 | 0 (0.0%) | 0 (0.0%) |
| $20,000 to $24,999 | 0 (0.0%) | 0 (0.0%) |
| $25,000 to $34,999 | 3 (23.1%) | 0 (0.0%) |
| $35,000 to $49,999 | 5 (38.5%) | 0 (0.0%) |
| $50,000 to $74,999 | 5 (38.5%) | 5 (27.8%) |
| $75,000 to $99,999 | 0 (0.0%) | 13 (72.2%) |
| $100,000 to $149,999 | 0 (0.0%) | 0 (0.0%) |
| $150,000 or more | 0 (0.0%) | 0 (0.0%) |
| Total | 13 (100.0%) | 18 (100.0%) |
Monthly Housing Cost Tiers in Westside
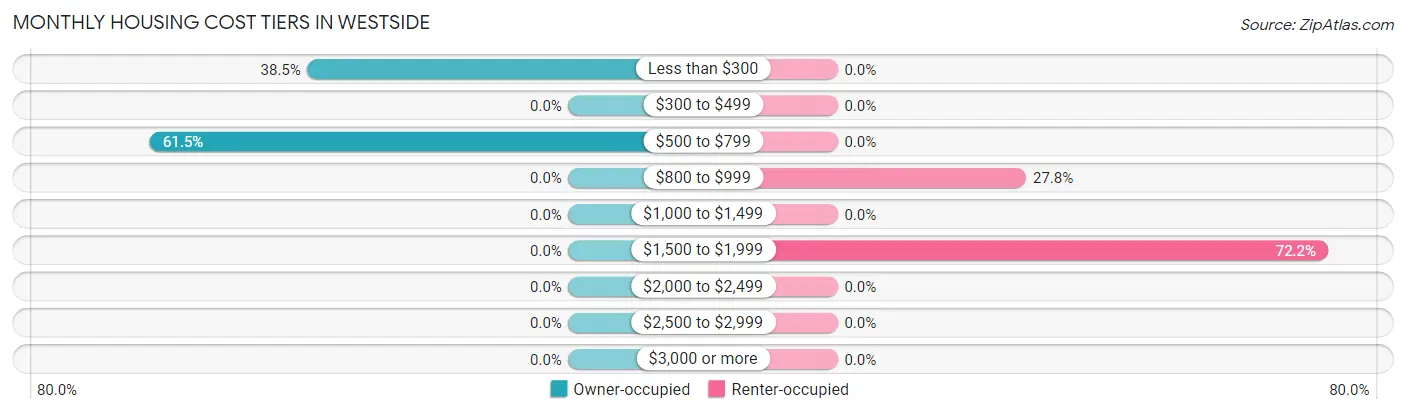
| Monthly Cost | Owner-occupied | Renter-occupied |
| Less than $300 | 5 (38.5%) | 0 (0.0%) |
| $300 to $499 | 0 (0.0%) | 0 (0.0%) |
| $500 to $799 | 8 (61.5%) | 0 (0.0%) |
| $800 to $999 | 0 (0.0%) | 5 (27.8%) |
| $1,000 to $1,499 | 0 (0.0%) | 0 (0.0%) |
| $1,500 to $1,999 | 0 (0.0%) | 13 (72.2%) |
| $2,000 to $2,499 | 0 (0.0%) | 0 (0.0%) |
| $2,500 to $2,999 | 0 (0.0%) | 0 (0.0%) |
| $3,000 or more | 0 (0.0%) | 0 (0.0%) |
| Total | 13 (100.0%) | 18 (100.0%) |
Physical Housing Characteristics in Westside
Housing Structures in Westside
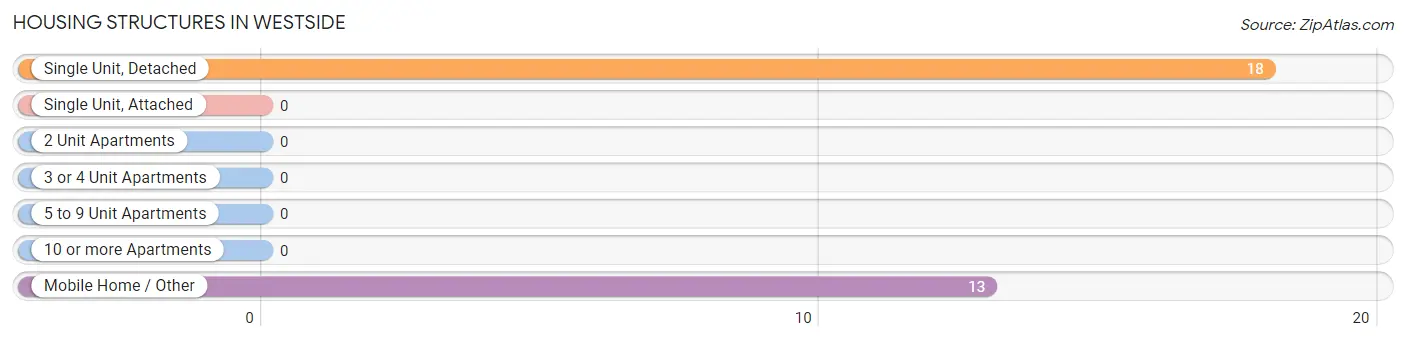
| Structure Type | # Housing Units | % Housing Units |
| Single Unit, Detached | 18 | 58.1% |
| Single Unit, Attached | 0 | 0.0% |
| 2 Unit Apartments | 0 | 0.0% |
| 3 or 4 Unit Apartments | 0 | 0.0% |
| 5 to 9 Unit Apartments | 0 | 0.0% |
| 10 or more Apartments | 0 | 0.0% |
| Mobile Home / Other | 13 | 41.9% |
| Total | 31 | 100.0% |
Housing Structures by Occupancy in Westside
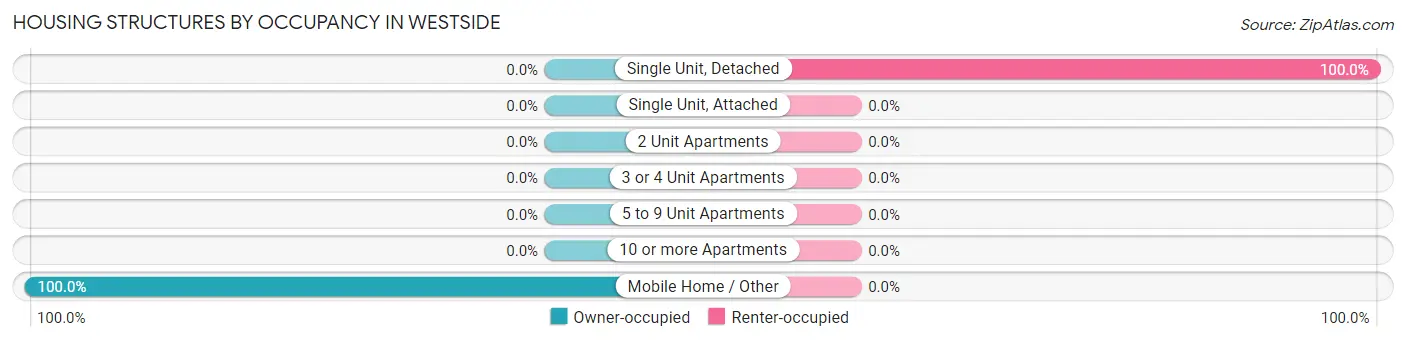
| Structure Type | Owner-occupied | Renter-occupied |
| Single Unit, Detached | 0 (0.0%) | 18 (100.0%) |
| Single Unit, Attached | 0 (0.0%) | 0 (0.0%) |
| 2 Unit Apartments | 0 (0.0%) | 0 (0.0%) |
| 3 or 4 Unit Apartments | 0 (0.0%) | 0 (0.0%) |
| 5 to 9 Unit Apartments | 0 (0.0%) | 0 (0.0%) |
| 10 or more Apartments | 0 (0.0%) | 0 (0.0%) |
| Mobile Home / Other | 13 (100.0%) | 0 (0.0%) |
| Total | 13 (41.9%) | 18 (58.1%) |
Housing Structures by Number of Rooms in Westside
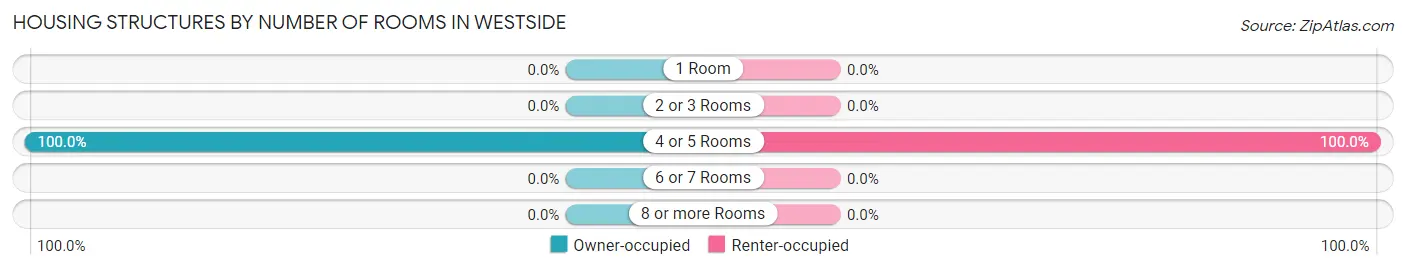
| Number of Rooms | Owner-occupied | Renter-occupied |
| 1 Room | 0 (0.0%) | 0 (0.0%) |
| 2 or 3 Rooms | 0 (0.0%) | 0 (0.0%) |
| 4 or 5 Rooms | 13 (100.0%) | 18 (100.0%) |
| 6 or 7 Rooms | 0 (0.0%) | 0 (0.0%) |
| 8 or more Rooms | 0 (0.0%) | 0 (0.0%) |
| Total | 13 (100.0%) | 18 (100.0%) |
Housing Structure by Heating Type in Westside
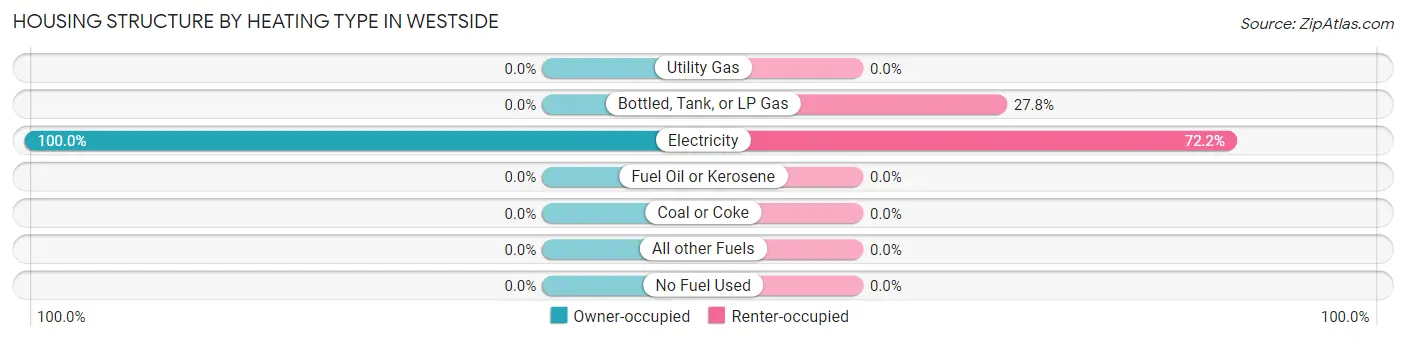
| Heating Type | Owner-occupied | Renter-occupied |
| Utility Gas | 0 (0.0%) | 0 (0.0%) |
| Bottled, Tank, or LP Gas | 0 (0.0%) | 5 (27.8%) |
| Electricity | 13 (100.0%) | 13 (72.2%) |
| Fuel Oil or Kerosene | 0 (0.0%) | 0 (0.0%) |
| Coal or Coke | 0 (0.0%) | 0 (0.0%) |
| All other Fuels | 0 (0.0%) | 0 (0.0%) |
| No Fuel Used | 0 (0.0%) | 0 (0.0%) |
| Total | 13 (100.0%) | 18 (100.0%) |
Household Vehicle Usage in Westside
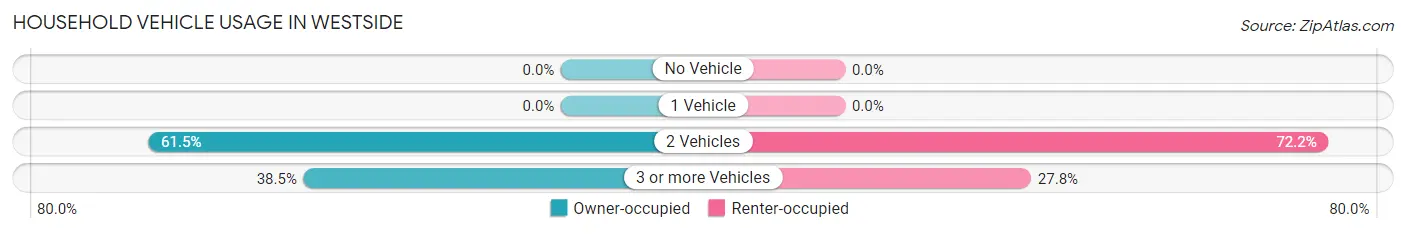
| Vehicles per Household | Owner-occupied | Renter-occupied |
| No Vehicle | 0 (0.0%) | 0 (0.0%) |
| 1 Vehicle | 0 (0.0%) | 0 (0.0%) |
| 2 Vehicles | 8 (61.5%) | 13 (72.2%) |
| 3 or more Vehicles | 5 (38.5%) | 5 (27.8%) |
| Total | 13 (100.0%) | 18 (100.0%) |
Real Estate & Mortgages in Westside
Real Estate and Mortgage Overview in Westside
| Characteristic | Without Mortgage | With Mortgage |
| Housing Units | 13 | 0 |
| Median Property Value | $9,999 | $0 |
| Median Household Income | $39,250 | $0 |
| Monthly Housing Costs | - | - |
| Real Estate Taxes | $199 | $0 |
Property Value by Mortgage Status in Westside
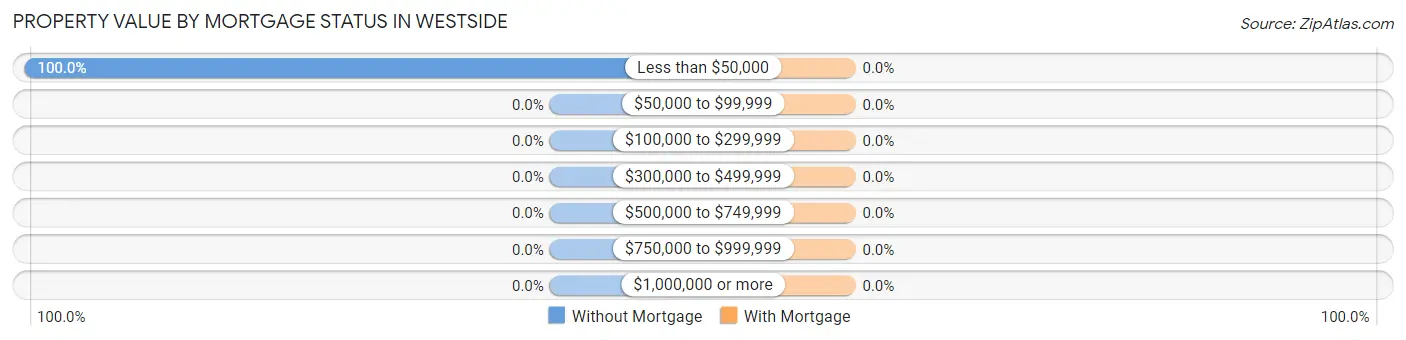
| Property Value | Without Mortgage | With Mortgage |
| Less than $50,000 | 13 (100.0%) | 0 (0.0%) |
| $50,000 to $99,999 | 0 (0.0%) | 0 (0.0%) |
| $100,000 to $299,999 | 0 (0.0%) | 0 (0.0%) |
| $300,000 to $499,999 | 0 (0.0%) | 0 (0.0%) |
| $500,000 to $749,999 | 0 (0.0%) | 0 (0.0%) |
| $750,000 to $999,999 | 0 (0.0%) | 0 (0.0%) |
| $1,000,000 or more | 0 (0.0%) | 0 (0.0%) |
| Total | 13 (100.0%) | 0 (0.0%) |
Household Income by Mortgage Status in Westside
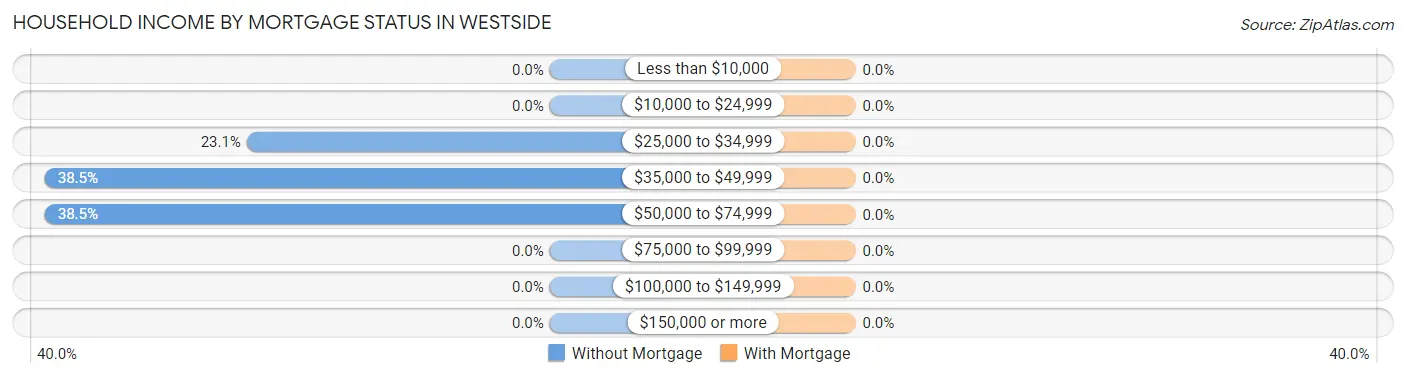
| Household Income | Without Mortgage | With Mortgage |
| Less than $10,000 | 0 (0.0%) | 0 (0.0%) |
| $10,000 to $24,999 | 0 (0.0%) | 0 (0.0%) |
| $25,000 to $34,999 | 3 (23.1%) | 0 (0.0%) |
| $35,000 to $49,999 | 5 (38.5%) | 0 (0.0%) |
| $50,000 to $74,999 | 5 (38.5%) | 0 (0.0%) |
| $75,000 to $99,999 | 0 (0.0%) | 0 (0.0%) |
| $100,000 to $149,999 | 0 (0.0%) | 0 (0.0%) |
| $150,000 or more | 0 (0.0%) | 0 (0.0%) |
| Total | 13 (100.0%) | 0 (0.0%) |
Property Value to Household Income Ratio in Westside
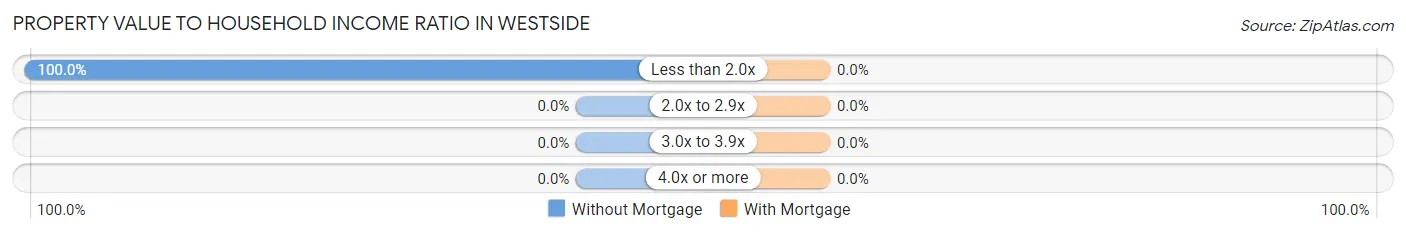
| Value-to-Income Ratio | Without Mortgage | With Mortgage |
| Less than 2.0x | 13 (100.0%) | 0 (0.0%) |
| 2.0x to 2.9x | 0 (0.0%) | 0 (0.0%) |
| 3.0x to 3.9x | 0 (0.0%) | 0 (0.0%) |
| 4.0x or more | 0 (0.0%) | 0 (0.0%) |
| Total | 13 (100.0%) | 0 (0.0%) |
Real Estate Taxes by Mortgage Status in Westside
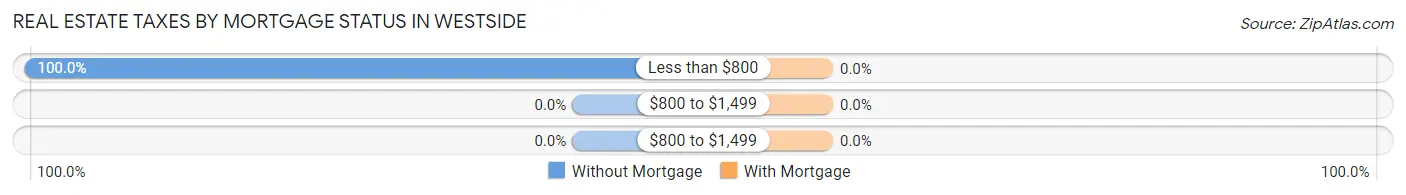
| Property Taxes | Without Mortgage | With Mortgage |
| Less than $800 | 13 (100.0%) | 0 (0.0%) |
| $800 to $1,499 | 0 (0.0%) | 0 (0.0%) |
| $800 to $1,499 | 0 (0.0%) | 0 (0.0%) |
| Total | 13 (100.0%) | 0 (0.0%) |
Health & Disability in Westside
Health Insurance Coverage by Age in Westside
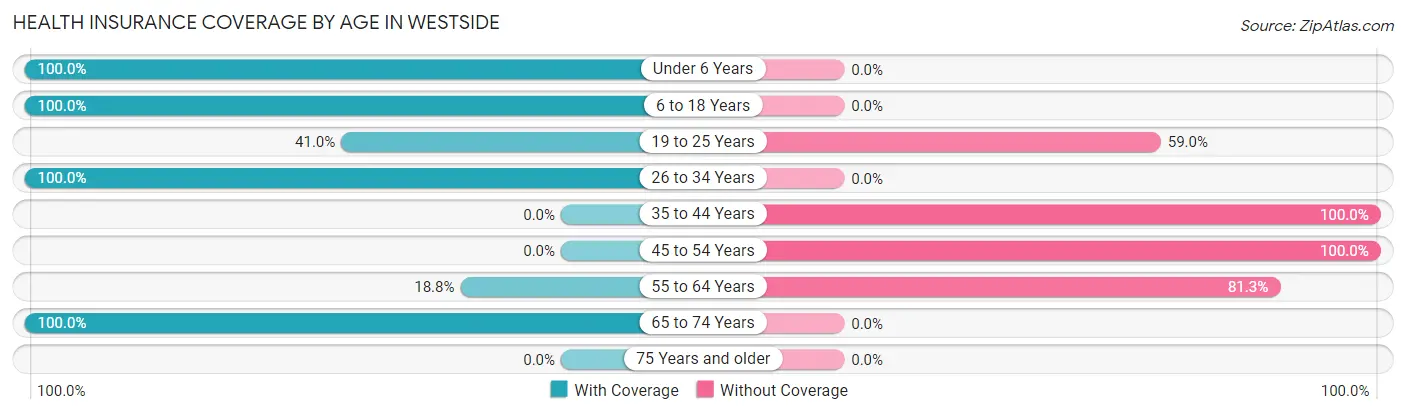
| Age Bracket | With Coverage | Without Coverage |
| Under 6 Years | 25 (100.0%) | 0 (0.0%) |
| 6 to 18 Years | 21 (100.0%) | 0 (0.0%) |
| 19 to 25 Years | 25 (41.0%) | 36 (59.0%) |
| 26 to 34 Years | 15 (100.0%) | 0 (0.0%) |
| 35 to 44 Years | 0 (0.0%) | 9 (100.0%) |
| 45 to 54 Years | 0 (0.0%) | 23 (100.0%) |
| 55 to 64 Years | 3 (18.8%) | 13 (81.2%) |
| 65 to 74 Years | 21 (100.0%) | 0 (0.0%) |
| 75 Years and older | 0 (0.0%) | 0 (0.0%) |
| Total | 110 (57.6%) | 81 (42.4%) |
Health Insurance Coverage by Citizenship Status in Westside
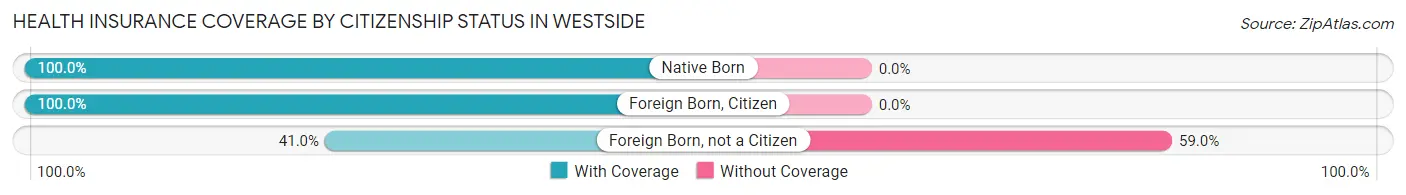
| Citizenship Status | With Coverage | Without Coverage |
| Native Born | 25 (100.0%) | 0 (0.0%) |
| Foreign Born, Citizen | 21 (100.0%) | 0 (0.0%) |
| Foreign Born, not a Citizen | 25 (41.0%) | 36 (59.0%) |
Health Insurance Coverage by Household Income in Westside
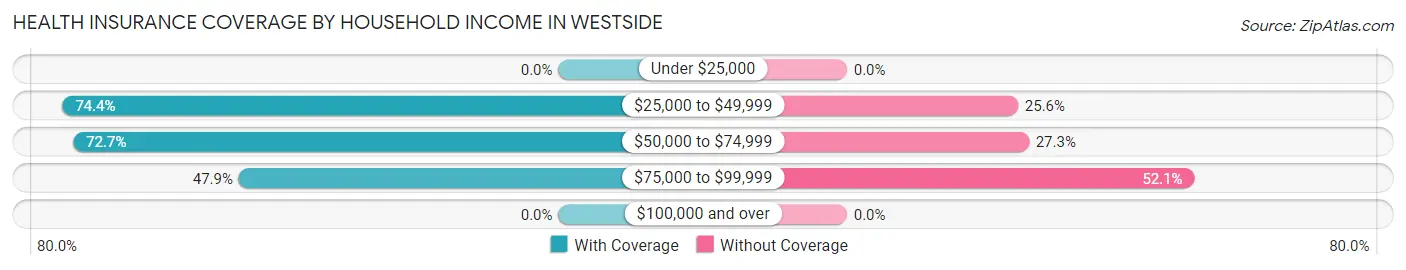
| Household Income | With Coverage | Without Coverage |
| Under $25,000 | 0 (0.0%) | 0 (0.0%) |
| $25,000 to $49,999 | 29 (74.4%) | 10 (25.6%) |
| $50,000 to $74,999 | 24 (72.7%) | 9 (27.3%) |
| $75,000 to $99,999 | 57 (47.9%) | 62 (52.1%) |
| $100,000 and over | 0 (0.0%) | 0 (0.0%) |
Public vs Private Health Insurance Coverage by Age in Westside
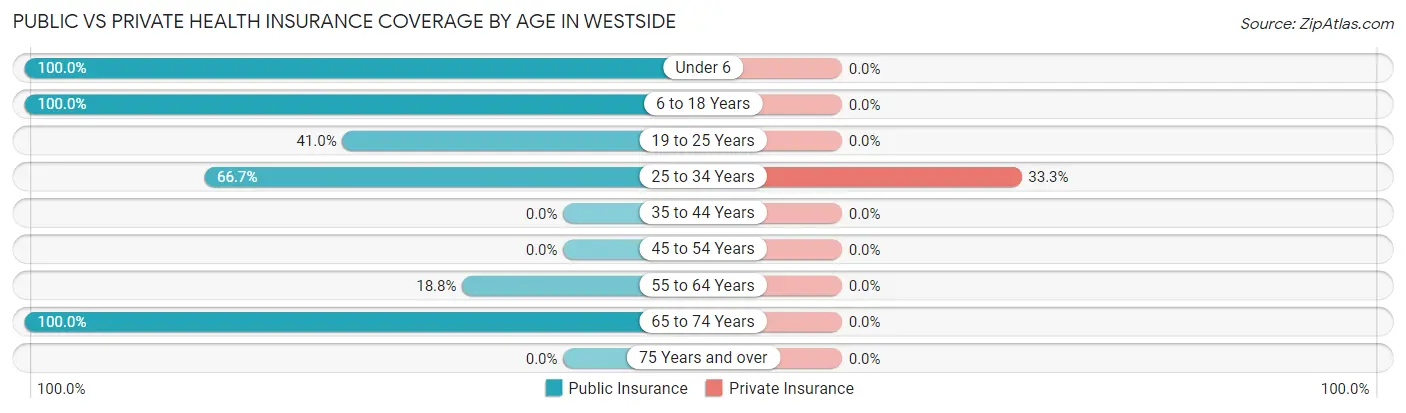
| Age Bracket | Public Insurance | Private Insurance |
| Under 6 | 25 (100.0%) | 0 (0.0%) |
| 6 to 18 Years | 21 (100.0%) | 0 (0.0%) |
| 19 to 25 Years | 25 (41.0%) | 0 (0.0%) |
| 25 to 34 Years | 10 (66.7%) | 5 (33.3%) |
| 35 to 44 Years | 0 (0.0%) | 0 (0.0%) |
| 45 to 54 Years | 0 (0.0%) | 0 (0.0%) |
| 55 to 64 Years | 3 (18.8%) | 0 (0.0%) |
| 65 to 74 Years | 21 (100.0%) | 0 (0.0%) |
| 75 Years and over | 0 (0.0%) | 0 (0.0%) |
| Total | 105 (55.0%) | 5 (2.6%) |
Disability Status by Sex by Age in Westside
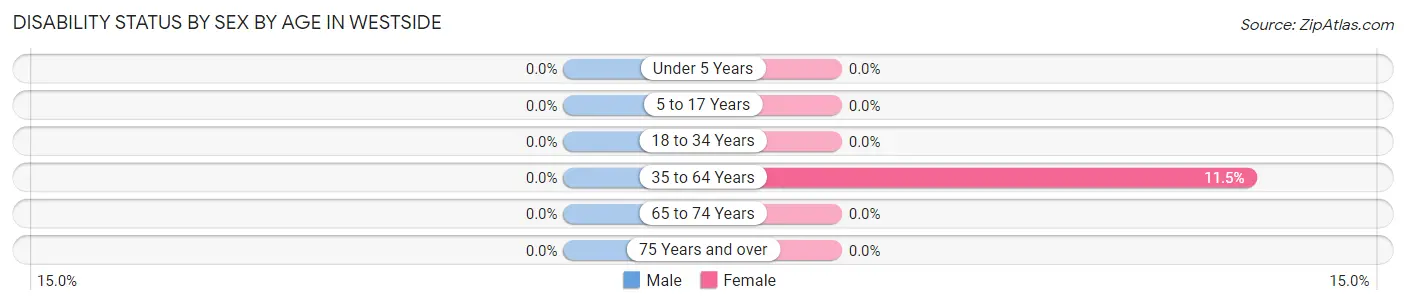
| Age Bracket | Male | Female |
| Under 5 Years | 0 (0.0%) | 0 (0.0%) |
| 5 to 17 Years | 0 (0.0%) | 0 (0.0%) |
| 18 to 34 Years | 0 (0.0%) | 0 (0.0%) |
| 35 to 64 Years | 0 (0.0%) | 3 (11.5%) |
| 65 to 74 Years | 0 (0.0%) | 0 (0.0%) |
| 75 Years and over | 0 (0.0%) | 0 (0.0%) |
Disability Class by Sex by Age in Westside
Disability Class: Hearing Difficulty
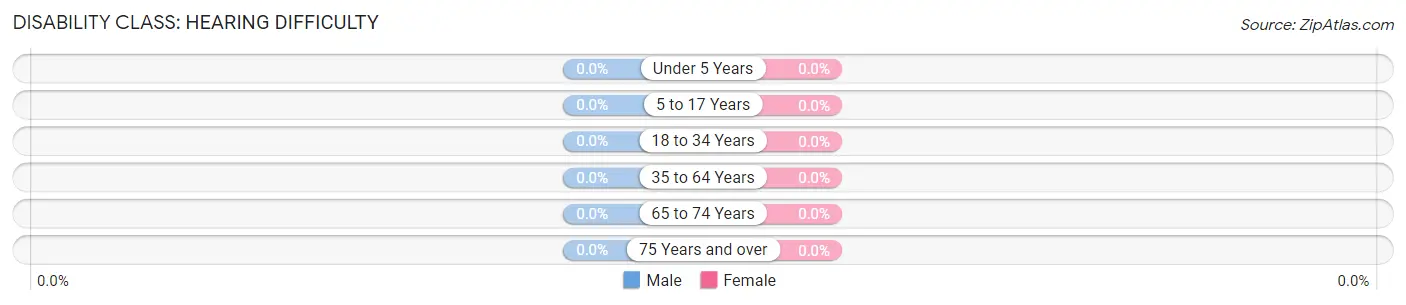
| Age Bracket | Male | Female |
| Under 5 Years | 0 (0.0%) | 0 (0.0%) |
| 5 to 17 Years | 0 (0.0%) | 0 (0.0%) |
| 18 to 34 Years | 0 (0.0%) | 0 (0.0%) |
| 35 to 64 Years | 0 (0.0%) | 0 (0.0%) |
| 65 to 74 Years | 0 (0.0%) | 0 (0.0%) |
| 75 Years and over | 0 (0.0%) | 0 (0.0%) |
Disability Class: Vision Difficulty
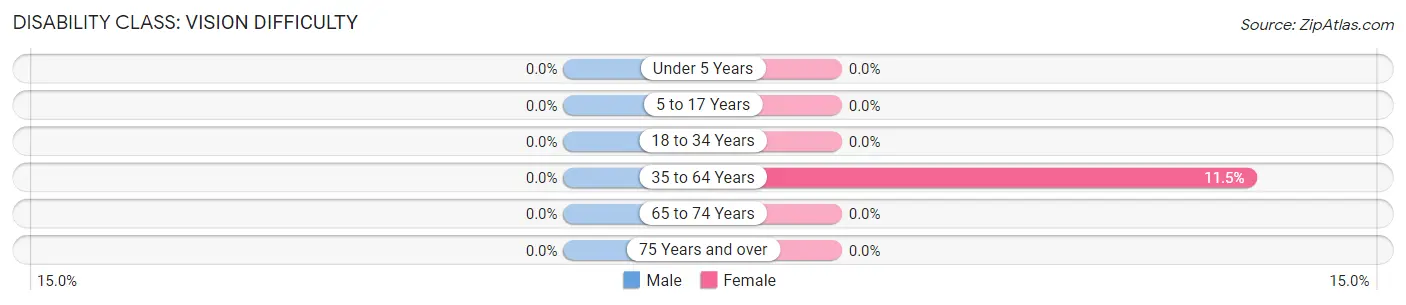
| Age Bracket | Male | Female |
| Under 5 Years | 0 (0.0%) | 0 (0.0%) |
| 5 to 17 Years | 0 (0.0%) | 0 (0.0%) |
| 18 to 34 Years | 0 (0.0%) | 0 (0.0%) |
| 35 to 64 Years | 0 (0.0%) | 3 (11.5%) |
| 65 to 74 Years | 0 (0.0%) | 0 (0.0%) |
| 75 Years and over | 0 (0.0%) | 0 (0.0%) |
Disability Class: Cognitive Difficulty
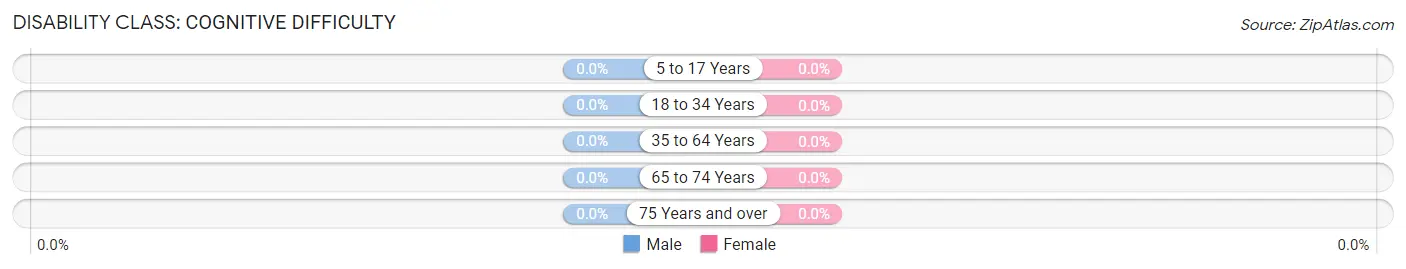
| Age Bracket | Male | Female |
| 5 to 17 Years | 0 (0.0%) | 0 (0.0%) |
| 18 to 34 Years | 0 (0.0%) | 0 (0.0%) |
| 35 to 64 Years | 0 (0.0%) | 0 (0.0%) |
| 65 to 74 Years | 0 (0.0%) | 0 (0.0%) |
| 75 Years and over | 0 (0.0%) | 0 (0.0%) |
Disability Class: Ambulatory Difficulty
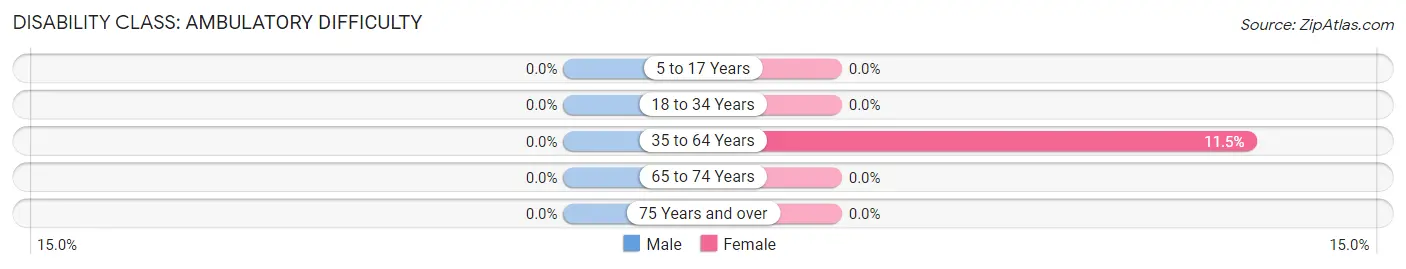
| Age Bracket | Male | Female |
| 5 to 17 Years | 0 (0.0%) | 0 (0.0%) |
| 18 to 34 Years | 0 (0.0%) | 0 (0.0%) |
| 35 to 64 Years | 0 (0.0%) | 3 (11.5%) |
| 65 to 74 Years | 0 (0.0%) | 0 (0.0%) |
| 75 Years and over | 0 (0.0%) | 0 (0.0%) |
Disability Class: Self-Care Difficulty
| Age Bracket | Male | Female |
| 5 to 17 Years | 0 (0.0%) | 0 (0.0%) |
| 18 to 34 Years | 0 (0.0%) | 0 (0.0%) |
| 35 to 64 Years | 0 (0.0%) | 0 (0.0%) |
| 65 to 74 Years | 0 (0.0%) | 0 (0.0%) |
| 75 Years and over | 0 (0.0%) | 0 (0.0%) |
Technology Access in Westside
Computing Device Access in Westside
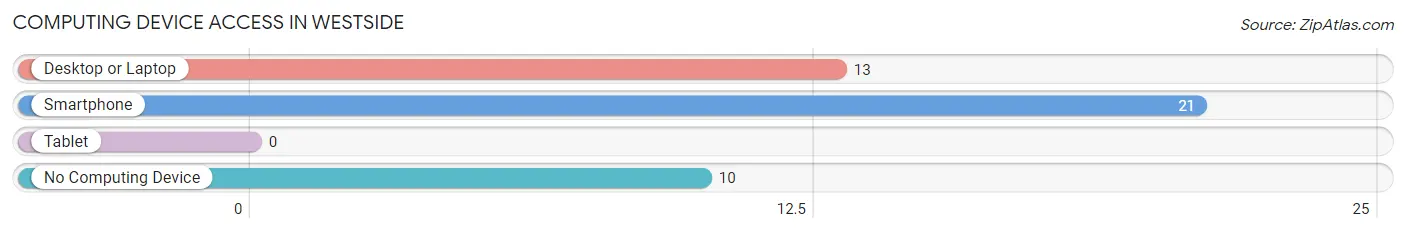
| Device Type | # Households | % Households |
| Desktop or Laptop | 13 | 41.9% |
| Smartphone | 21 | 67.7% |
| Tablet | 0 | 0.0% |
| No Computing Device | 10 | 32.3% |
| Total | 31 | 100.0% |
Internet Access in Westside
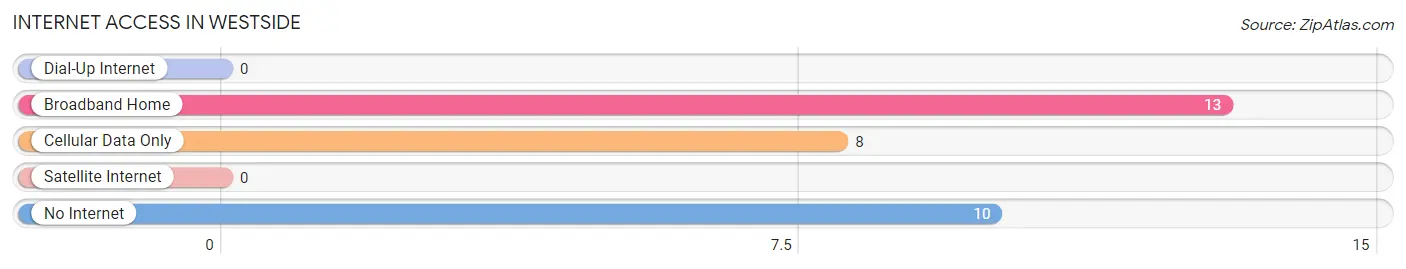
| Internet Type | # Households | % Households |
| Dial-Up Internet | 0 | 0.0% |
| Broadband Home | 13 | 41.9% |
| Cellular Data Only | 8 | 25.8% |
| Satellite Internet | 0 | 0.0% |
| No Internet | 10 | 32.3% |
| Total | 31 | 100.0% |
Westside Summary
Westside, CA is a small city located in the western part of the state of California. It is situated in the foothills of the Sierra Nevada Mountains and is bordered by the cities of Fresno, Visalia, and Bakersfield. The city has a population of approximately 8,000 people and is known for its small-town charm and rural atmosphere.
Geography
Westside is located in the western part of California, in the foothills of the Sierra Nevada Mountains. The city is situated at an elevation of 1,200 feet and is bordered by the cities of Fresno, Visalia, and Bakersfield. The city is located in the Central Valley region of California and is surrounded by agricultural land. The climate in Westside is mild and dry, with temperatures ranging from the mid-50s in the winter to the mid-90s in the summer.
Economy
Westside’s economy is largely based on agriculture and tourism. The city is home to several farms and ranches, which produce a variety of crops, including grapes, almonds, and olives. The city is also home to several wineries, which produce a variety of wines. In addition, Westside is home to several tourist attractions, including the Westside Museum, the Westside Historical Society, and the Westside Art Gallery.
Demographics
As of the 2010 census, Westside had a population of 8,000 people. The racial makeup of the city was 75.3% White, 11.2% Hispanic or Latino, 8.2% Asian, and 5.3% African American. The median household income in Westside was $45,000, and the median age was 37.
History
Westside was founded in 1875 by a group of settlers from the Midwest. The city was originally called Westside Station, and it served as a stop on the Central Pacific Railroad. In the early 1900s, the city began to grow and develop, and it eventually became a popular tourist destination. In the 1950s, the city was incorporated and began to attract more businesses and residents. Today, Westside is a small city with a population of 8,000 people and a thriving economy.
Common Questions
What is Per Capita Income in Westside?
Per Capita income in Westside is $13,076.
What is Income or Wage Gap in Westside?
Income or Wage Gap in Westside is 10.6%.
Women in Westside earn 89.4 cents for every dollar earned by a man.
What is Inequality or Gini Index in Westside?
Inequality or Gini Index in Westside is 0.22.
What is the Total Population of Westside?
Total Population of Westside is 191.
What is the Total Male Population of Westside?
Total Male Population of Westside is 98.
What is the Total Female Population of Westside?
Total Female Population of Westside is 93.
What is the Ratio of Males per 100 Females in Westside?
There are 105.38 Males per 100 Females in Westside.
What is the Ratio of Females per 100 Males in Westside?
There are 94.90 Females per 100 Males in Westside.
What is the Median Population Age in Westside?
Median Population Age in Westside is 22.4 Years.
What is the Average Family Size in Westside
Average Family Size in Westside is 6.0 People.
What is the Average Household Size in Westside
Average Household Size in Westside is 6.2 People.
How Large is the Labor Force in Westside?
There are 78 People in the Labor Forcein in Westside.
What is the Percentage of People in the Labor Force in Westside?
47.0% of People are in the Labor Force in Westside.