Zip Codes with the Highest Percentage of Population Employed in Agriculture, Fishing & Hunting in Trabuco Canyon, CA
RELATED REPORTS & OPTIONS
Agriculture, Fishing & Hunting
Trabuco Canyon
Compare Zip Codes
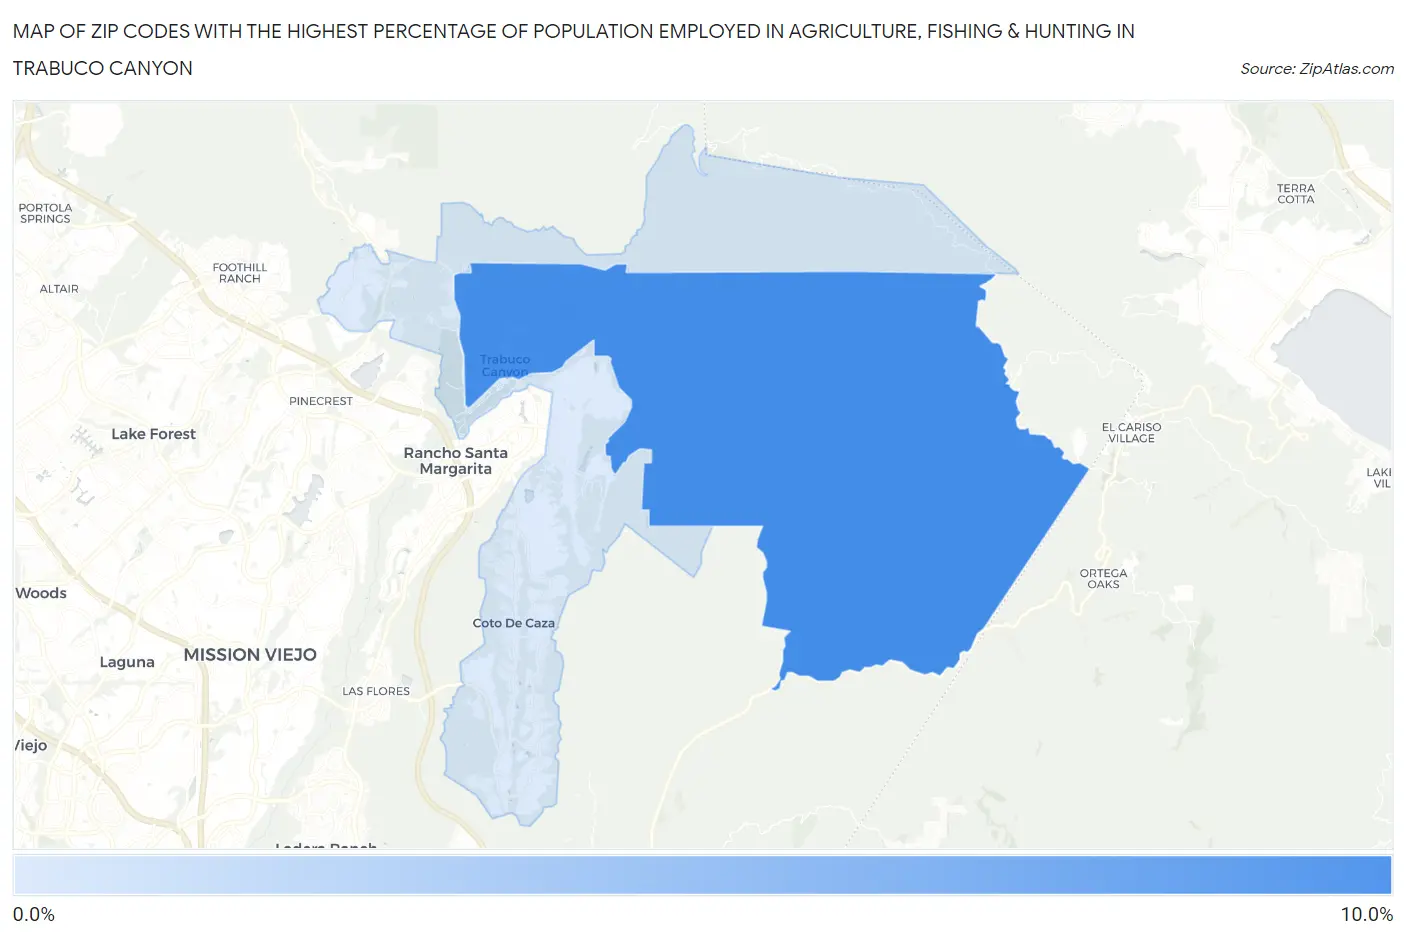
Map of Zip Codes with the Highest Percentage of Population Employed in Agriculture, Fishing & Hunting in Trabuco Canyon
0.32%
9.6%
Zip Codes with the Highest Percentage of Population Employed in Agriculture, Fishing & Hunting in Trabuco Canyon, CA
| Zip Code | % Employed | vs State | vs National | |
| 1. | 92678 | 9.6% | 2.0%(+7.60)#267 | 1.2%(+8.39)#4,525 |
| 2. | 92679 | 0.32% | 2.0%(-1.66)#1,104 | 1.2%(-0.875)#20,900 |
1
Common Questions
What are the Top Zip Codes with the Highest Percentage of Population Employed in Agriculture, Fishing & Hunting in Trabuco Canyon, CA?
Top Zip Codes with the Highest Percentage of Population Employed in Agriculture, Fishing & Hunting in Trabuco Canyon, CA are:
What zip code has the Highest Percentage of Population Employed in Agriculture, Fishing & Hunting in Trabuco Canyon, CA?
92678 has the Highest Percentage of Population Employed in Agriculture, Fishing & Hunting in Trabuco Canyon, CA with 9.6%.
What is the Percentage of Population Employed in Agriculture, Fishing & Hunting in Trabuco Canyon, CA?
Percentage of Population Employed in Agriculture, Fishing & Hunting in Trabuco Canyon is 4.6%.
What is the Percentage of Population Employed in Agriculture, Fishing & Hunting in California?
Percentage of Population Employed in Agriculture, Fishing & Hunting in California is 2.0%.
What is the Percentage of Population Employed in Agriculture, Fishing & Hunting in the United States?
Percentage of Population Employed in Agriculture, Fishing & Hunting in the United States is 1.2%.