Cities with the Lowest Poverty Level Among Single Females in Maryland
RELATED REPORTS & OPTIONS
Lowest Poverty | Single Female
Maryland
Compare Cities
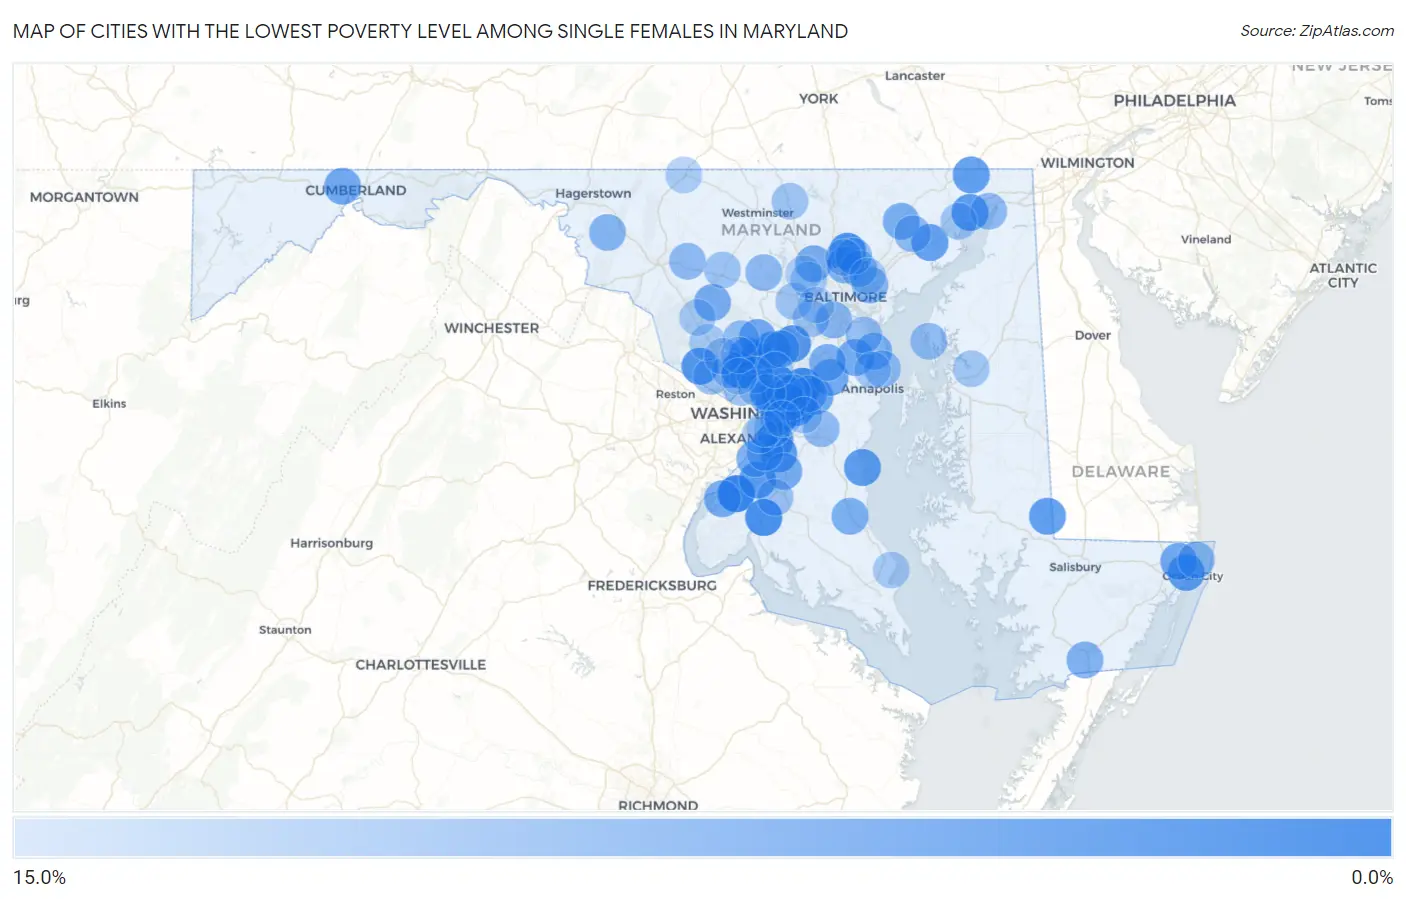
Map of Cities with the Lowest Poverty Level Among Single Females in Maryland
15.0%
0.0%
Cities with the Lowest Poverty Level Among Single Females in Maryland
| City | Single Female Poverty | vs State | vs National | |
| 1. | Bryans Road | 0.34% | 16.4%(-16.0)#1 | 24.1%(-23.7)#2 |
| 2. | Mitchellville | 1.1% | 16.4%(-15.3)#2 | 24.1%(-23.0)#21 |
| 3. | Glenn Dale | 1.1% | 16.4%(-15.3)#3 | 24.1%(-22.9)#25 |
| 4. | Colesville | 1.2% | 16.4%(-15.2)#4 | 24.1%(-22.9)#27 |
| 5. | North Kensington | 1.3% | 16.4%(-15.1)#5 | 24.1%(-22.8)#33 |
| 6. | Berwyn Heights | 1.6% | 16.4%(-14.8)#6 | 24.1%(-22.5)#50 |
| 7. | Peppermill Village | 1.7% | 16.4%(-14.7)#7 | 24.1%(-22.4)#54 |
| 8. | La Plata | 1.8% | 16.4%(-14.6)#8 | 24.1%(-22.3)#69 |
| 9. | Lake Arbor | 1.9% | 16.4%(-14.5)#9 | 24.1%(-22.2)#83 |
| 10. | Timonium | 2.1% | 16.4%(-14.3)#10 | 24.1%(-22.0)#97 |
| 11. | Bladensburg | 2.5% | 16.4%(-13.9)#11 | 24.1%(-21.6)#149 |
| 12. | Layhill | 2.8% | 16.4%(-13.6)#12 | 24.1%(-21.3)#186 |
| 13. | North Laurel | 2.8% | 16.4%(-13.6)#13 | 24.1%(-21.3)#189 |
| 14. | Travilah | 2.8% | 16.4%(-13.5)#14 | 24.1%(-21.2)#202 |
| 15. | Landover Hills | 2.9% | 16.4%(-13.5)#15 | 24.1%(-21.2)#205 |
| 16. | Camp Springs | 2.9% | 16.4%(-13.5)#16 | 24.1%(-21.2)#217 |
| 17. | Brown Station | 3.0% | 16.4%(-13.4)#17 | 24.1%(-21.1)#226 |
| 18. | Burtonsville | 3.1% | 16.4%(-13.2)#18 | 24.1%(-20.9)#262 |
| 19. | Perryville | 3.4% | 16.4%(-13.0)#19 | 24.1%(-20.7)#303 |
| 20. | Clinton | 3.4% | 16.4%(-13.0)#20 | 24.1%(-20.7)#315 |
| 21. | Accokeek | 3.4% | 16.4%(-13.0)#21 | 24.1%(-20.7)#316 |
| 22. | West Ocean City | 3.6% | 16.4%(-12.8)#22 | 24.1%(-20.5)#350 |
| 23. | North Beach | 3.6% | 16.4%(-12.8)#23 | 24.1%(-20.5)#351 |
| 24. | Sharptown | 3.9% | 16.4%(-12.5)#24 | 24.1%(-20.2)#432 |
| 25. | Rising Sun | 3.9% | 16.4%(-12.4)#25 | 24.1%(-20.1)#436 |
| 26. | Riverside | 4.0% | 16.4%(-12.4)#26 | 24.1%(-20.1)#441 |
| 27. | Bowie | 4.8% | 16.4%(-11.6)#27 | 24.1%(-19.3)#628 |
| 28. | Springdale | 4.8% | 16.4%(-11.6)#28 | 24.1%(-19.3)#629 |
| 29. | Ashton Sandy Spring | 5.1% | 16.4%(-11.2)#29 | 24.1%(-18.9)#746 |
| 30. | La Vale | 5.2% | 16.4%(-11.2)#30 | 24.1%(-18.9)#766 |
| 31. | Ocean Pines | 5.3% | 16.4%(-11.0)#31 | 24.1%(-18.7)#805 |
| 32. | Crofton | 5.4% | 16.4%(-11.0)#32 | 24.1%(-18.7)#826 |
| 33. | West Laurel | 5.4% | 16.4%(-11.0)#33 | 24.1%(-18.7)#831 |
| 34. | Severna Park | 5.5% | 16.4%(-10.9)#34 | 24.1%(-18.6)#847 |
| 35. | Fort Washington | 5.6% | 16.4%(-10.8)#35 | 24.1%(-18.5)#874 |
| 36. | North Brentwood | 5.6% | 16.4%(-10.8)#36 | 24.1%(-18.4)#889 |
| 37. | Brandywine | 5.7% | 16.4%(-10.7)#37 | 24.1%(-18.4)#893 |
| 38. | Indian Head | 5.7% | 16.4%(-10.7)#38 | 24.1%(-18.4)#899 |
| 39. | Garrison | 5.8% | 16.4%(-10.6)#39 | 24.1%(-18.3)#933 |
| 40. | Damascus | 5.8% | 16.4%(-10.6)#40 | 24.1%(-18.2)#941 |
| 41. | Bel Air North | 6.0% | 16.4%(-10.4)#41 | 24.1%(-18.1)#1,002 |
| 42. | Lake Shore | 6.0% | 16.4%(-10.4)#42 | 24.1%(-18.1)#1,009 |
| 43. | Odenton | 6.1% | 16.4%(-10.3)#43 | 24.1%(-18.0)#1,029 |
| 44. | Prince Frederick | 6.2% | 16.4%(-10.2)#44 | 24.1%(-17.9)#1,055 |
| 45. | Towson | 6.5% | 16.4%(-9.93)#45 | 24.1%(-17.6)#1,155 |
| 46. | Pocomoke City | 6.5% | 16.4%(-9.90)#46 | 24.1%(-17.6)#1,161 |
| 47. | Fairwood | 6.5% | 16.4%(-9.86)#47 | 24.1%(-17.6)#1,168 |
| 48. | Capitol Heights | 6.5% | 16.4%(-9.85)#48 | 24.1%(-17.5)#1,175 |
| 49. | Boonsboro | 6.8% | 16.4%(-9.55)#49 | 24.1%(-17.2)#1,276 |
| 50. | Rosedale | 6.9% | 16.4%(-9.51)#50 | 24.1%(-17.2)#1,285 |
| 51. | Linthicum | 7.0% | 16.4%(-9.41)#51 | 24.1%(-17.1)#1,320 |
| 52. | Parkville | 7.2% | 16.4%(-9.22)#52 | 24.1%(-16.9)#1,400 |
| 53. | Ocean City | 7.2% | 16.4%(-9.19)#53 | 24.1%(-16.9)#1,406 |
| 54. | Friendly | 7.5% | 16.4%(-8.89)#54 | 24.1%(-16.6)#1,501 |
| 55. | Linganore | 7.5% | 16.4%(-8.84)#55 | 24.1%(-16.5)#1,523 |
| 56. | Sykesville | 7.6% | 16.4%(-8.77)#56 | 24.1%(-16.5)#1,542 |
| 57. | Charlestown | 7.7% | 16.4%(-8.69)#57 | 24.1%(-16.4)#1,562 |
| 58. | Bel Air South | 7.7% | 16.4%(-8.65)#58 | 24.1%(-16.3)#1,611 |
| 59. | Marlboro Meadows | 7.8% | 16.4%(-8.59)#59 | 24.1%(-16.3)#1,634 |
| 60. | Hampton | 8.0% | 16.4%(-8.43)#60 | 24.1%(-16.1)#1,688 |
| 61. | Glenarden | 8.0% | 16.4%(-8.41)#61 | 24.1%(-16.1)#1,697 |
| 62. | Olney | 8.1% | 16.4%(-8.28)#62 | 24.1%(-16.0)#1,735 |
| 63. | Rock Hall | 8.1% | 16.4%(-8.25)#63 | 24.1%(-15.9)#1,752 |
| 64. | Cape St Claire | 8.2% | 16.4%(-8.22)#64 | 24.1%(-15.9)#1,755 |
| 65. | Honeygo | 8.3% | 16.4%(-8.12)#65 | 24.1%(-15.8)#1,781 |
| 66. | Martin S Additions | 8.3% | 16.4%(-8.05)#66 | 24.1%(-15.7)#1,804 |
| 67. | Lutherville | 8.4% | 16.4%(-7.99)#67 | 24.1%(-15.7)#1,857 |
| 68. | New Carrollton | 8.4% | 16.4%(-7.98)#68 | 24.1%(-15.7)#1,862 |
| 69. | Riviera Beach | 8.4% | 16.4%(-7.97)#69 | 24.1%(-15.7)#1,863 |
| 70. | Waldorf | 8.5% | 16.4%(-7.85)#70 | 24.1%(-15.5)#1,885 |
| 71. | Ilchester | 8.6% | 16.4%(-7.82)#71 | 24.1%(-15.5)#1,894 |
| 72. | Potomac | 8.7% | 16.4%(-7.73)#72 | 24.1%(-15.4)#1,918 |
| 73. | Mount Airy | 8.7% | 16.4%(-7.65)#73 | 24.1%(-15.3)#1,956 |
| 74. | Lanham | 8.9% | 16.4%(-7.52)#74 | 24.1%(-15.2)#1,996 |
| 75. | Ellicott City | 8.9% | 16.4%(-7.44)#75 | 24.1%(-15.1)#2,010 |
| 76. | Hampstead | 9.1% | 16.4%(-7.33)#76 | 24.1%(-15.0)#2,041 |
| 77. | Havre De Grace | 9.1% | 16.4%(-7.26)#77 | 24.1%(-15.0)#2,110 |
| 78. | Arnold | 9.2% | 16.4%(-7.22)#78 | 24.1%(-14.9)#2,123 |
| 79. | North Bethesda | 9.2% | 16.4%(-7.18)#79 | 24.1%(-14.9)#2,132 |
| 80. | Centreville | 9.3% | 16.4%(-7.06)#80 | 24.1%(-14.8)#2,177 |
| 81. | Takoma Park | 9.4% | 16.4%(-6.96)#81 | 24.1%(-14.6)#2,207 |
| 82. | Four Corners | 9.6% | 16.4%(-6.84)#82 | 24.1%(-14.5)#2,254 |
| 83. | Silver Hill | 9.7% | 16.4%(-6.73)#83 | 24.1%(-14.4)#2,289 |
| 84. | Gaithersburg | 9.7% | 16.4%(-6.72)#84 | 24.1%(-14.4)#2,291 |
| 85. | Clarksburg | 9.7% | 16.4%(-6.65)#85 | 24.1%(-14.3)#2,326 |
| 86. | Milford Mill | 9.7% | 16.4%(-6.65)#86 | 24.1%(-14.3)#2,327 |
| 87. | Hyattsville | 9.7% | 16.4%(-6.64)#87 | 24.1%(-14.3)#2,332 |
| 88. | Chesapeake Ranch Estates | 9.8% | 16.4%(-6.62)#88 | 24.1%(-14.3)#2,344 |
| 89. | Kettering | 9.8% | 16.4%(-6.59)#89 | 24.1%(-14.3)#2,356 |
| 90. | Rockville | 9.9% | 16.4%(-6.47)#90 | 24.1%(-14.2)#2,384 |
| 91. | Aspen Hill | 9.9% | 16.4%(-6.46)#91 | 24.1%(-14.2)#2,385 |
| 92. | Glassmanor | 10.0% | 16.4%(-6.39)#92 | 24.1%(-14.1)#2,402 |
| 93. | Emmitsburg | 10.0% | 16.4%(-6.39)#93 | 24.1%(-14.1)#2,411 |
| 94. | Beltsville | 10.1% | 16.4%(-6.30)#94 | 24.1%(-14.0)#2,477 |
| 95. | Overlea | 10.1% | 16.4%(-6.27)#95 | 24.1%(-14.0)#2,485 |
| 96. | Randallstown | 10.4% | 16.4%(-5.97)#96 | 24.1%(-13.7)#2,584 |
| 97. | Hillcrest Heights | 10.5% | 16.4%(-5.85)#97 | 24.1%(-13.5)#2,663 |
| 98. | Catonsville | 10.5% | 16.4%(-5.84)#98 | 24.1%(-13.5)#2,667 |
| 99. | South Kensington | 10.9% | 16.4%(-5.53)#99 | 24.1%(-13.2)#2,782 |
| 100. | Walker Mill | 10.9% | 16.4%(-5.46)#100 | 24.1%(-13.1)#2,806 |
Common Questions
What are the Top 10 Cities with the Lowest Poverty Level Among Single Females in Maryland?
Top 10 Cities with the Lowest Poverty Level Among Single Females in Maryland are:
#1
0.34%
#2
1.1%
#3
1.1%
#4
1.2%
#5
1.3%
#6
1.6%
#7
1.7%
#8
1.8%
#9
1.9%
#10
2.1%
What city has the Lowest Poverty Level Among Single Females in Maryland?
Bryans Road has the Lowest Poverty Level Among Single Females in Maryland with 0.34%.
What is the Poverty Level Among Single Females in the State of Maryland?
Poverty Level Among Single Females in Maryland is 16.4%.
What is the Poverty Level Among Single Females in the United States?
Poverty Level Among Single Females in the United States is 24.1%.