Cities with the Lowest Poverty Level Among Single Females in Pennsylvania
RELATED REPORTS & OPTIONS
Lowest Poverty | Single Female
Pennsylvania
Compare Cities
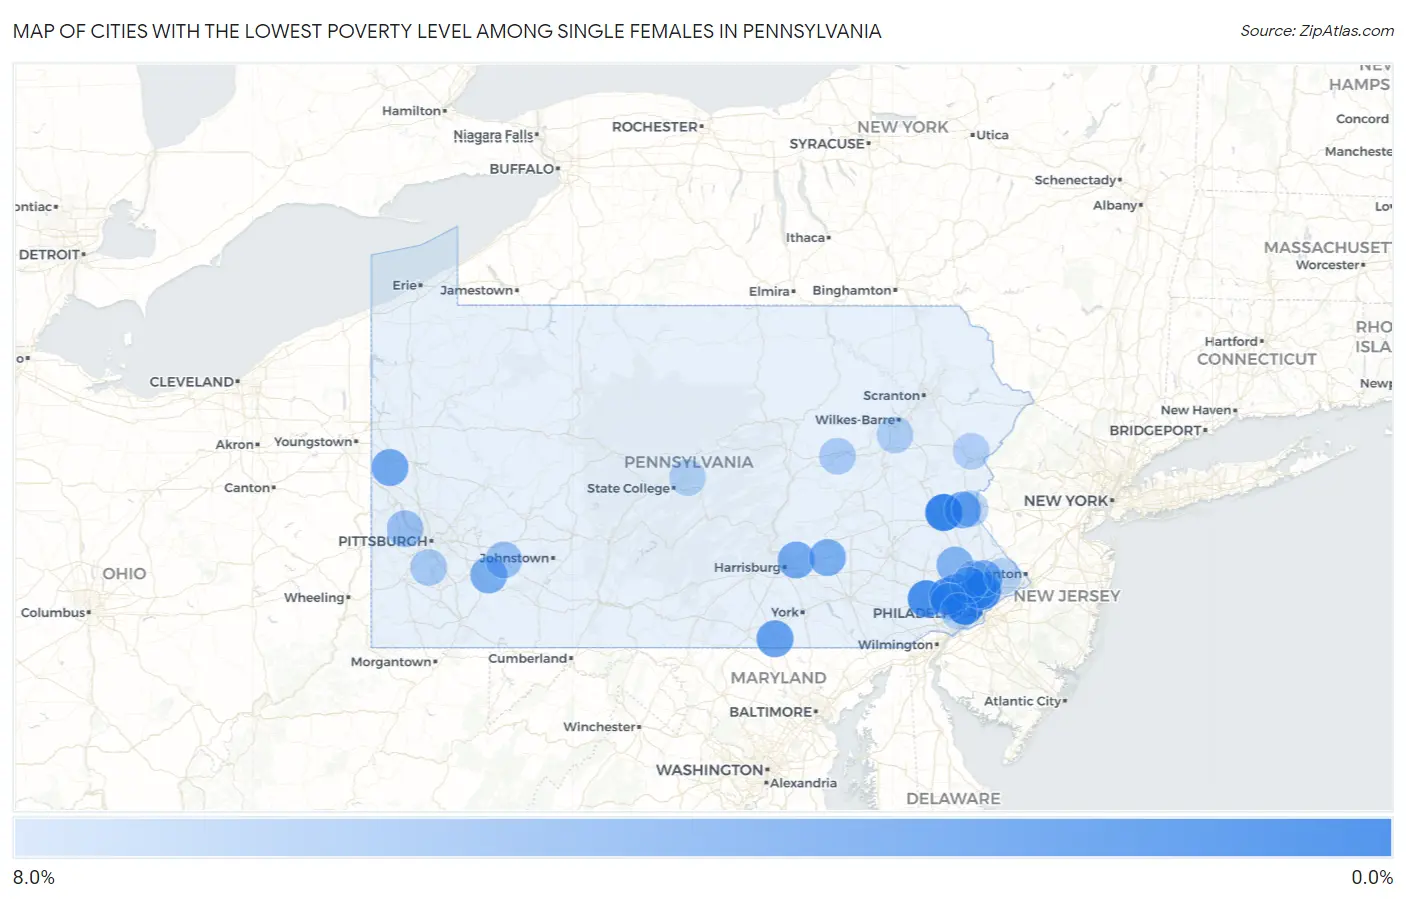
Map of Cities with the Lowest Poverty Level Among Single Females in Pennsylvania
8.0%
0.0%
Cities with the Lowest Poverty Level Among Single Females in Pennsylvania
| City | Single Female Poverty | vs State | vs National | |
| 1. | Ardmore | 0.92% | 24.5%(-23.6)#1 | 24.1%(-23.2)#13 |
| 2. | Fullerton | 0.97% | 24.5%(-23.5)#2 | 24.1%(-23.1)#18 |
| 3. | Bellevue Borough | 1.7% | 24.5%(-22.8)#3 | 24.1%(-22.4)#58 |
| 4. | Glenside | 1.8% | 24.5%(-22.7)#4 | 24.1%(-22.3)#68 |
| 5. | Lionville | 1.9% | 24.5%(-22.6)#5 | 24.1%(-22.2)#78 |
| 6. | West Mayfield Borough | 1.9% | 24.5%(-22.6)#6 | 24.1%(-22.2)#87 |
| 7. | Springdale Borough | 2.0% | 24.5%(-22.5)#7 | 24.1%(-22.1)#89 |
| 8. | Cleona Borough | 2.2% | 24.5%(-22.3)#8 | 24.1%(-21.9)#114 |
| 9. | Trafford Borough | 2.6% | 24.5%(-21.9)#9 | 24.1%(-21.5)#155 |
| 10. | Jermyn Borough | 2.6% | 24.5%(-21.9)#10 | 24.1%(-21.5)#164 |
| 11. | Georgetown Cdp Luzerne County | 2.9% | 24.5%(-21.6)#11 | 24.1%(-21.2)#214 |
| 12. | Morton Borough | 3.0% | 24.5%(-21.5)#12 | 24.1%(-21.1)#233 |
| 13. | Saxonburg Borough | 3.0% | 24.5%(-21.4)#13 | 24.1%(-21.0)#240 |
| 14. | Fleetwood Borough | 3.1% | 24.5%(-21.3)#14 | 24.1%(-20.9)#261 |
| 15. | King Of Prussia | 3.3% | 24.5%(-21.2)#15 | 24.1%(-20.8)#282 |
| 16. | Chesterbrook | 3.3% | 24.5%(-21.1)#16 | 24.1%(-20.7)#293 |
| 17. | Parkville | 3.4% | 24.5%(-21.1)#17 | 24.1%(-20.7)#308 |
| 18. | Blakely Borough | 3.5% | 24.5%(-21.0)#18 | 24.1%(-20.6)#328 |
| 19. | Riegelsville Borough | 3.6% | 24.5%(-20.8)#19 | 24.1%(-20.4)#368 |
| 20. | Kennett Square Borough | 3.7% | 24.5%(-20.8)#20 | 24.1%(-20.4)#375 |
| 21. | Minersville Borough | 3.7% | 24.5%(-20.8)#21 | 24.1%(-20.4)#378 |
| 22. | Shamokin Dam Borough | 3.7% | 24.5%(-20.8)#22 | 24.1%(-20.4)#379 |
| 23. | Oreland | 3.8% | 24.5%(-20.7)#23 | 24.1%(-20.3)#397 |
| 24. | Leetsdale Borough | 3.8% | 24.5%(-20.7)#24 | 24.1%(-20.3)#398 |
| 25. | Franklin Park Borough | 3.8% | 24.5%(-20.6)#25 | 24.1%(-20.2)#405 |
| 26. | York Haven Borough | 3.8% | 24.5%(-20.6)#26 | 24.1%(-20.2)#417 |
| 27. | South Greensburg Borough | 3.9% | 24.5%(-20.6)#27 | 24.1%(-20.2)#424 |
| 28. | East Lansdowne Borough | 4.1% | 24.5%(-20.4)#28 | 24.1%(-20.0)#458 |
| 29. | West Pittsburg | 4.1% | 24.5%(-20.4)#29 | 24.1%(-20.0)#464 |
| 30. | Dillsburg Borough | 4.2% | 24.5%(-20.3)#30 | 24.1%(-19.9)#475 |
| 31. | Port Carbon Borough | 4.2% | 24.5%(-20.3)#31 | 24.1%(-19.9)#476 |
| 32. | Paxtonia | 4.2% | 24.5%(-20.3)#32 | 24.1%(-19.9)#482 |
| 33. | Pleasant Hills Borough | 4.2% | 24.5%(-20.3)#33 | 24.1%(-19.9)#486 |
| 34. | Middletown | 4.2% | 24.5%(-20.2)#34 | 24.1%(-19.8)#488 |
| 35. | Horsham | 4.3% | 24.5%(-20.2)#35 | 24.1%(-19.8)#494 |
| 36. | Newell Borough | 4.3% | 24.5%(-20.1)#36 | 24.1%(-19.7)#520 |
| 37. | Roscoe Borough | 4.3% | 24.5%(-20.1)#37 | 24.1%(-19.7)#522 |
| 38. | Valencia Borough | 4.3% | 24.5%(-20.1)#38 | 24.1%(-19.7)#525 |
| 39. | Kenhorst Borough | 4.4% | 24.5%(-20.1)#39 | 24.1%(-19.7)#542 |
| 40. | Calumet | 4.5% | 24.5%(-20.0)#40 | 24.1%(-19.6)#554 |
| 41. | Annville | 4.5% | 24.5%(-20.0)#41 | 24.1%(-19.6)#559 |
| 42. | Clifton Heights Borough | 4.6% | 24.5%(-19.9)#42 | 24.1%(-19.5)#586 |
| 43. | Southwest Greensburg Borough | 4.8% | 24.5%(-19.7)#43 | 24.1%(-19.3)#631 |
| 44. | Jim Thorpe Borough | 4.8% | 24.5%(-19.7)#44 | 24.1%(-19.3)#648 |
| 45. | Indiana Borough | 4.8% | 24.5%(-19.7)#45 | 24.1%(-19.3)#649 |
| 46. | Cheswick Borough | 4.9% | 24.5%(-19.5)#46 | 24.1%(-19.1)#684 |
| 47. | Venango Borough | 5.0% | 24.5%(-19.5)#47 | 24.1%(-19.1)#713 |
| 48. | Harleysville | 5.1% | 24.5%(-19.4)#48 | 24.1%(-19.0)#734 |
| 49. | Clarks Summit Borough | 5.1% | 24.5%(-19.3)#49 | 24.1%(-18.9)#739 |
| 50. | Oakmont Borough | 5.2% | 24.5%(-19.2)#50 | 24.1%(-18.8)#769 |
| 51. | Houtzdale Borough | 5.3% | 24.5%(-19.2)#51 | 24.1%(-18.8)#780 |
| 52. | Bridgewater Borough | 5.3% | 24.5%(-19.2)#52 | 24.1%(-18.8)#782 |
| 53. | New Britain Borough | 5.3% | 24.5%(-19.1)#53 | 24.1%(-18.7)#802 |
| 54. | Conway Borough | 5.4% | 24.5%(-19.1)#54 | 24.1%(-18.7)#819 |
| 55. | Mountville Borough | 5.5% | 24.5%(-19.0)#55 | 24.1%(-18.6)#835 |
| 56. | Wormleysburg Borough | 5.5% | 24.5%(-19.0)#56 | 24.1%(-18.6)#848 |
| 57. | Ohioville Borough | 5.5% | 24.5%(-18.9)#57 | 24.1%(-18.5)#849 |
| 58. | Churchill Borough | 5.8% | 24.5%(-18.7)#58 | 24.1%(-18.3)#939 |
| 59. | New Stanton Borough | 5.9% | 24.5%(-18.6)#59 | 24.1%(-18.2)#956 |
| 60. | Townville Borough | 5.9% | 24.5%(-18.6)#60 | 24.1%(-18.2)#975 |
| 61. | Carnot Moon | 6.1% | 24.5%(-18.4)#61 | 24.1%(-18.0)#1,028 |
| 62. | Roslyn | 6.1% | 24.5%(-18.4)#62 | 24.1%(-18.0)#1,030 |
| 63. | East Rochester Borough | 6.1% | 24.5%(-18.4)#63 | 24.1%(-18.0)#1,044 |
| 64. | Loyalhanna | 6.1% | 24.5%(-18.3)#64 | 24.1%(-17.9)#1,048 |
| 65. | Dunmore Borough | 6.2% | 24.5%(-18.3)#65 | 24.1%(-17.9)#1,058 |
| 66. | Montoursville Borough | 6.2% | 24.5%(-18.3)#66 | 24.1%(-17.9)#1,061 |
| 67. | Bessemer Borough | 6.2% | 24.5%(-18.2)#67 | 24.1%(-17.8)#1,086 |
| 68. | Clintonville Borough | 6.2% | 24.5%(-18.2)#68 | 24.1%(-17.8)#1,092 |
| 69. | Clarksville Borough | 6.2% | 24.5%(-18.2)#69 | 24.1%(-17.8)#1,103 |
| 70. | Doylestown Borough | 6.3% | 24.5%(-18.2)#70 | 24.1%(-17.8)#1,106 |
| 71. | Newville Borough | 6.3% | 24.5%(-18.2)#71 | 24.1%(-17.8)#1,111 |
| 72. | Loganville Borough | 6.4% | 24.5%(-18.1)#72 | 24.1%(-17.7)#1,130 |
| 73. | Jamestown Borough | 6.4% | 24.5%(-18.1)#73 | 24.1%(-17.7)#1,134 |
| 74. | Mercersburg Borough | 6.5% | 24.5%(-18.0)#74 | 24.1%(-17.6)#1,146 |
| 75. | Ashland Borough | 6.7% | 24.5%(-17.8)#75 | 24.1%(-17.4)#1,212 |
| 76. | New Cumberland Borough | 6.8% | 24.5%(-17.6)#76 | 24.1%(-17.2)#1,277 |
| 77. | Gastonville | 6.9% | 24.5%(-17.6)#77 | 24.1%(-17.2)#1,308 |
| 78. | Martinsburg Borough | 7.0% | 24.5%(-17.4)#78 | 24.1%(-17.0)#1,337 |
| 79. | Espy | 7.1% | 24.5%(-17.4)#79 | 24.1%(-17.0)#1,341 |
| 80. | Spring House | 7.1% | 24.5%(-17.4)#80 | 24.1%(-17.0)#1,347 |
| 81. | Blue Bell | 7.1% | 24.5%(-17.3)#81 | 24.1%(-16.9)#1,355 |
| 82. | Youngwood Borough | 7.1% | 24.5%(-17.3)#82 | 24.1%(-16.9)#1,361 |
| 83. | Hooversville Borough | 7.1% | 24.5%(-17.3)#83 | 24.1%(-16.9)#1,374 |
| 84. | Youngstown Borough | 7.1% | 24.5%(-17.3)#84 | 24.1%(-16.9)#1,389 |
| 85. | Mountain Top | 7.2% | 24.5%(-17.2)#85 | 24.1%(-16.8)#1,421 |
| 86. | Berwyn | 7.3% | 24.5%(-17.2)#86 | 24.1%(-16.8)#1,430 |
| 87. | Brookhaven Borough | 7.3% | 24.5%(-17.2)#87 | 24.1%(-16.8)#1,441 |
| 88. | Green Tree Borough | 7.4% | 24.5%(-17.1)#88 | 24.1%(-16.7)#1,457 |
| 89. | Pleasant Gap | 7.4% | 24.5%(-17.1)#89 | 24.1%(-16.7)#1,459 |
| 90. | Narberth Borough | 7.4% | 24.5%(-17.1)#90 | 24.1%(-16.7)#1,461 |
| 91. | Old Orchard | 7.4% | 24.5%(-17.1)#91 | 24.1%(-16.7)#1,467 |
| 92. | Conyngham Borough | 7.4% | 24.5%(-17.1)#92 | 24.1%(-16.7)#1,469 |
| 93. | Penn Estates | 7.5% | 24.5%(-17.0)#93 | 24.1%(-16.6)#1,494 |
| 94. | Lansdowne Borough | 7.5% | 24.5%(-17.0)#94 | 24.1%(-16.6)#1,495 |
| 95. | Broomall | 7.5% | 24.5%(-17.0)#95 | 24.1%(-16.6)#1,512 |
| 96. | West Middlesex Borough | 7.5% | 24.5%(-16.9)#96 | 24.1%(-16.5)#1,526 |
| 97. | Great Bend Borough | 7.5% | 24.5%(-16.9)#97 | 24.1%(-16.5)#1,527 |
| 98. | Village Shires | 7.7% | 24.5%(-16.8)#98 | 24.1%(-16.4)#1,559 |
| 99. | Wampum Borough | 7.7% | 24.5%(-16.8)#99 | 24.1%(-16.4)#1,580 |
| 100. | Eau Claire Borough | 7.7% | 24.5%(-16.8)#100 | 24.1%(-16.4)#1,594 |
Common Questions
What are the Top 10 Cities with the Lowest Poverty Level Among Single Females in Pennsylvania?
Top 10 Cities with the Lowest Poverty Level Among Single Females in Pennsylvania are:
#1
0.92%
#2
0.97%
#3
1.8%
#4
1.9%
#5
3.3%
#6
3.3%
#7
3.4%
#8
3.8%
#9
4.1%
#10
4.2%
What city has the Lowest Poverty Level Among Single Females in Pennsylvania?
Ardmore has the Lowest Poverty Level Among Single Females in Pennsylvania with 0.92%.
What is the Poverty Level Among Single Females in the State of Pennsylvania?
Poverty Level Among Single Females in Pennsylvania is 24.5%.
What is the Poverty Level Among Single Females in the United States?
Poverty Level Among Single Females in the United States is 24.1%.