Cities with the Lowest Poverty Level Among Single Females in Mississippi
RELATED REPORTS & OPTIONS
Lowest Poverty | Single Female
Mississippi
Compare Cities
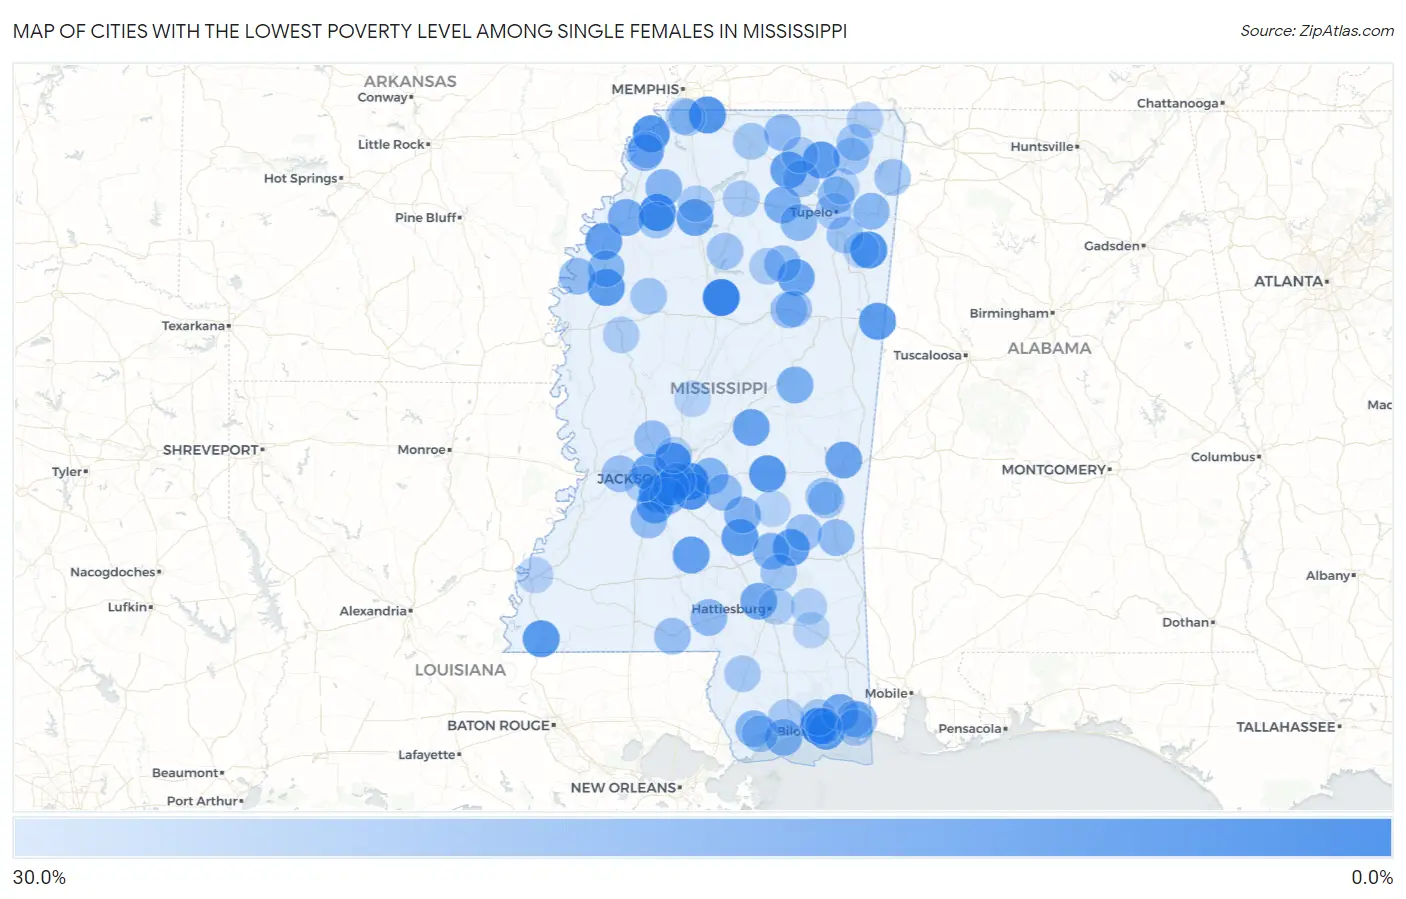
Map of Cities with the Lowest Poverty Level Among Single Females in Mississippi
30.0%
0.0%
Cities with the Lowest Poverty Level Among Single Females in Mississippi
| City | Single Female Poverty | vs State | vs National | |
| 1. | Duck Hill | 1.3% | 34.9%(-33.6)#1 | 24.1%(-22.8)#34 |
| 2. | St Martin | 2.1% | 34.9%(-32.8)#2 | 24.1%(-22.0)#100 |
| 3. | Marks | 5.3% | 34.9%(-29.6)#3 | 24.1%(-18.8)#795 |
| 4. | Brandon | 5.7% | 34.9%(-29.2)#4 | 24.1%(-18.4)#903 |
| 5. | Byram | 5.9% | 34.9%(-29.0)#5 | 24.1%(-18.2)#949 |
| 6. | Robinhood | 6.4% | 34.9%(-28.5)#6 | 24.1%(-17.7)#1,132 |
| 7. | Tunica Resorts | 7.3% | 34.9%(-27.7)#7 | 24.1%(-16.8)#1,427 |
| 8. | Hatley | 7.3% | 34.9%(-27.6)#8 | 24.1%(-16.8)#1,438 |
| 9. | Olive Branch | 7.6% | 34.9%(-27.3)#9 | 24.1%(-16.5)#1,532 |
| 10. | Ridgeland | 8.0% | 34.9%(-26.9)#10 | 24.1%(-16.0)#1,720 |
| 11. | Lake | 8.3% | 34.9%(-26.6)#11 | 24.1%(-15.7)#1,819 |
| 12. | Woodville | 9.0% | 34.9%(-25.9)#12 | 24.1%(-15.1)#2,025 |
| 13. | Dumas | 9.5% | 34.9%(-25.4)#13 | 24.1%(-14.6)#2,251 |
| 14. | New Hope | 9.6% | 34.9%(-25.4)#14 | 24.1%(-14.5)#2,258 |
| 15. | Boyle | 9.8% | 34.9%(-25.1)#15 | 24.1%(-14.3)#2,350 |
| 16. | Mize | 10.0% | 34.9%(-24.9)#16 | 24.1%(-14.1)#2,453 |
| 17. | Ocean Springs | 10.7% | 34.9%(-24.2)#17 | 24.1%(-13.3)#2,748 |
| 18. | Sharon | 10.9% | 34.9%(-24.0)#18 | 24.1%(-13.2)#2,803 |
| 19. | New Hebron | 11.1% | 34.9%(-23.8)#19 | 24.1%(-13.0)#2,891 |
| 20. | Duncan | 11.8% | 34.9%(-23.2)#20 | 24.1%(-12.3)#3,147 |
| 21. | Myrtle | 11.9% | 34.9%(-23.0)#21 | 24.1%(-12.2)#3,187 |
| 22. | Woodland | 12.5% | 34.9%(-22.4)#22 | 24.1%(-11.6)#3,450 |
| 23. | Standing Pine | 12.6% | 34.9%(-22.3)#23 | 24.1%(-11.4)#3,493 |
| 24. | Clinton | 12.7% | 34.9%(-22.2)#24 | 24.1%(-11.3)#3,522 |
| 25. | Pope | 12.8% | 34.9%(-22.2)#25 | 24.1%(-11.3)#3,536 |
| 26. | Terry | 12.9% | 34.9%(-22.0)#26 | 24.1%(-11.1)#3,603 |
| 27. | Marion | 13.5% | 34.9%(-21.4)#27 | 24.1%(-10.5)#3,856 |
| 28. | Rawls Springs | 14.8% | 34.9%(-20.1)#28 | 24.1%(-9.29)#4,375 |
| 29. | Lyon | 15.0% | 34.9%(-19.9)#29 | 24.1%(-9.08)#4,468 |
| 30. | Vancleave | 15.6% | 34.9%(-19.4)#30 | 24.1%(-8.51)#4,692 |
| 31. | Gluckstadt | 15.7% | 34.9%(-19.2)#31 | 24.1%(-8.34)#4,752 |
| 32. | Thaxton | 16.7% | 34.9%(-18.3)#32 | 24.1%(-7.41)#5,130 |
| 33. | Noxapater | 17.2% | 34.9%(-17.7)#33 | 24.1%(-6.89)#5,382 |
| 34. | Raleigh | 17.9% | 34.9%(-17.1)#34 | 24.1%(-6.22)#5,671 |
| 35. | Long Beach | 18.0% | 34.9%(-17.0)#35 | 24.1%(-6.11)#5,706 |
| 36. | Soso | 18.2% | 34.9%(-16.7)#36 | 24.1%(-5.89)#5,804 |
| 37. | Merigold | 18.8% | 34.9%(-16.2)#37 | 24.1%(-5.33)#6,043 |
| 38. | Pelahatchie | 19.0% | 34.9%(-15.9)#38 | 24.1%(-5.07)#6,143 |
| 39. | Pearl | 19.2% | 34.9%(-15.7)#39 | 24.1%(-4.87)#6,216 |
| 40. | Tunica | 19.4% | 34.9%(-15.5)#40 | 24.1%(-4.63)#6,314 |
| 41. | Sledge | 19.4% | 34.9%(-15.5)#41 | 24.1%(-4.63)#6,319 |
| 42. | Kiln | 19.7% | 34.9%(-15.2)#42 | 24.1%(-4.40)#6,414 |
| 43. | Fulton | 19.7% | 34.9%(-15.2)#43 | 24.1%(-4.37)#6,424 |
| 44. | Cleary | 20.0% | 34.9%(-14.9)#44 | 24.1%(-4.08)#6,503 |
| 45. | Algoma | 20.3% | 34.9%(-14.6)#45 | 24.1%(-3.74)#6,744 |
| 46. | Columbia | 21.0% | 34.9%(-13.9)#46 | 24.1%(-3.04)#6,981 |
| 47. | Ashland | 21.2% | 34.9%(-13.7)#47 | 24.1%(-2.83)#7,076 |
| 48. | Vardaman | 21.5% | 34.9%(-13.4)#48 | 24.1%(-2.54)#7,188 |
| 49. | Saltillo | 21.7% | 34.9%(-13.2)#49 | 24.1%(-2.40)#7,233 |
| 50. | Helena | 21.7% | 34.9%(-13.2)#50 | 24.1%(-2.34)#7,246 |
| 51. | Shubuta | 21.7% | 34.9%(-13.2)#51 | 24.1%(-2.34)#7,251 |
| 52. | Beulah | 21.9% | 34.9%(-13.0)#52 | 24.1%(-2.16)#7,328 |
| 53. | Crystal Springs | 22.4% | 34.9%(-12.6)#53 | 24.1%(-1.72)#7,562 |
| 54. | Kearney Park | 22.4% | 34.9%(-12.5)#54 | 24.1%(-1.63)#7,589 |
| 55. | Polkville | 22.9% | 34.9%(-12.1)#55 | 24.1%(-1.22)#7,750 |
| 56. | Richland | 22.9% | 34.9%(-12.0)#56 | 24.1%(-1.16)#7,780 |
| 57. | Mathiston | 23.1% | 34.9%(-11.8)#57 | 24.1%(-1.000)#7,852 |
| 58. | Edwards | 23.1% | 34.9%(-11.8)#58 | 24.1%(-0.928)#7,900 |
| 59. | New Albany | 23.2% | 34.9%(-11.7)#59 | 24.1%(-0.906)#7,906 |
| 60. | Tylertown | 23.4% | 34.9%(-11.6)#60 | 24.1%(-0.712)#7,991 |
| 61. | Nettleton | 23.5% | 34.9%(-11.4)#61 | 24.1%(-0.587)#8,026 |
| 62. | Heidelberg | 23.7% | 34.9%(-11.2)#62 | 24.1%(-0.335)#8,123 |
| 63. | Booneville | 23.9% | 34.9%(-11.0)#63 | 24.1%(-0.139)#8,198 |
| 64. | Enterprise | 24.1% | 34.9%(-10.8)#64 | 24.1%(+0.061)#8,285 |
| 65. | Diamondhead | 24.3% | 34.9%(-10.7)#65 | 24.1%(+0.184)#8,319 |
| 66. | Maben | 24.5% | 34.9%(-10.4)#66 | 24.1%(+0.433)#8,408 |
| 67. | Belmont | 24.5% | 34.9%(-10.4)#67 | 24.1%(+0.452)#8,414 |
| 68. | Coffeeville | 24.5% | 34.9%(-10.4)#68 | 24.1%(+0.452)#8,415 |
| 69. | Ellisville | 24.6% | 34.9%(-10.4)#69 | 24.1%(+0.485)#8,430 |
| 70. | Lambert | 25.0% | 34.9%(-9.92)#70 | 24.1%(+0.924)#8,582 |
| 71. | Rienzi | 25.0% | 34.9%(-9.92)#71 | 24.1%(+0.924)#8,679 |
| 72. | Schlater | 25.0% | 34.9%(-9.92)#72 | 24.1%(+0.924)#8,694 |
| 73. | Escatawpa | 25.5% | 34.9%(-9.44)#73 | 24.1%(+1.40)#8,846 |
| 74. | Holly Springs | 25.6% | 34.9%(-9.33)#74 | 24.1%(+1.51)#8,889 |
| 75. | Stonewall | 25.6% | 34.9%(-9.28)#75 | 24.1%(+1.56)#8,908 |
| 76. | Oxford | 25.9% | 34.9%(-9.04)#76 | 24.1%(+1.80)#8,988 |
| 77. | Poplarville | 26.0% | 34.9%(-8.91)#77 | 24.1%(+1.94)#9,028 |
| 78. | Latimer | 26.3% | 34.9%(-8.58)#78 | 24.1%(+2.27)#9,159 |
| 79. | Southaven | 26.6% | 34.9%(-8.29)#79 | 24.1%(+2.55)#9,245 |
| 80. | Tupelo | 26.8% | 34.9%(-8.08)#80 | 24.1%(+2.77)#9,344 |
| 81. | Lyman | 26.9% | 34.9%(-8.06)#81 | 24.1%(+2.79)#9,350 |
| 82. | North Tunica | 27.0% | 34.9%(-7.92)#82 | 24.1%(+2.92)#9,401 |
| 83. | Calhoun City | 27.1% | 34.9%(-7.82)#83 | 24.1%(+3.03)#9,435 |
| 84. | Batesville | 27.1% | 34.9%(-7.79)#84 | 24.1%(+3.06)#9,449 |
| 85. | Blue Mountain | 27.5% | 34.9%(-7.47)#85 | 24.1%(+3.37)#9,569 |
| 86. | Inverness | 27.5% | 34.9%(-7.42)#86 | 24.1%(+3.42)#9,583 |
| 87. | Petal | 27.6% | 34.9%(-7.35)#87 | 24.1%(+3.49)#9,598 |
| 88. | Horn Lake | 27.8% | 34.9%(-7.11)#88 | 24.1%(+3.73)#9,697 |
| 89. | Moss Point | 27.9% | 34.9%(-6.98)#89 | 24.1%(+3.87)#9,735 |
| 90. | Raymond | 28.2% | 34.9%(-6.72)#90 | 24.1%(+4.13)#9,828 |
| 91. | Richton | 28.3% | 34.9%(-6.60)#91 | 24.1%(+4.24)#9,851 |
| 92. | Morgantown | 28.7% | 34.9%(-6.22)#92 | 24.1%(+4.63)#10,056 |
| 93. | Farmington | 28.9% | 34.9%(-6.03)#93 | 24.1%(+4.81)#10,104 |
| 94. | Madison | 29.0% | 34.9%(-5.90)#94 | 24.1%(+4.94)#10,139 |
| 95. | Gulf Hills | 29.1% | 34.9%(-5.85)#95 | 24.1%(+5.00)#10,158 |
| 96. | Louin | 29.4% | 34.9%(-5.51)#96 | 24.1%(+5.34)#10,269 |
| 97. | Pickens | 29.6% | 34.9%(-5.34)#97 | 24.1%(+5.50)#10,326 |
| 98. | Amory | 29.6% | 34.9%(-5.33)#98 | 24.1%(+5.52)#10,332 |
| 99. | Beaumont | 29.6% | 34.9%(-5.29)#99 | 24.1%(+5.55)#10,343 |
| 100. | Guntown | 29.8% | 34.9%(-5.10)#100 | 24.1%(+5.75)#10,399 |
Common Questions
What are the Top 10 Cities with the Lowest Poverty Level Among Single Females in Mississippi?
Top 10 Cities with the Lowest Poverty Level Among Single Females in Mississippi are:
#1
1.3%
#2
2.1%
#3
5.3%
#4
5.7%
#5
5.9%
#6
6.4%
#7
7.3%
#8
7.3%
#9
7.6%
#10
8.0%
What city has the Lowest Poverty Level Among Single Females in Mississippi?
Duck Hill has the Lowest Poverty Level Among Single Females in Mississippi with 1.3%.
What is the Poverty Level Among Single Females in the State of Mississippi?
Poverty Level Among Single Females in Mississippi is 34.9%.
What is the Poverty Level Among Single Females in the United States?
Poverty Level Among Single Females in the United States is 24.1%.