Cities with the Lowest Poverty Level Among Single Females in Utah
RELATED REPORTS & OPTIONS
Lowest Poverty | Single Female
Utah
Compare Cities
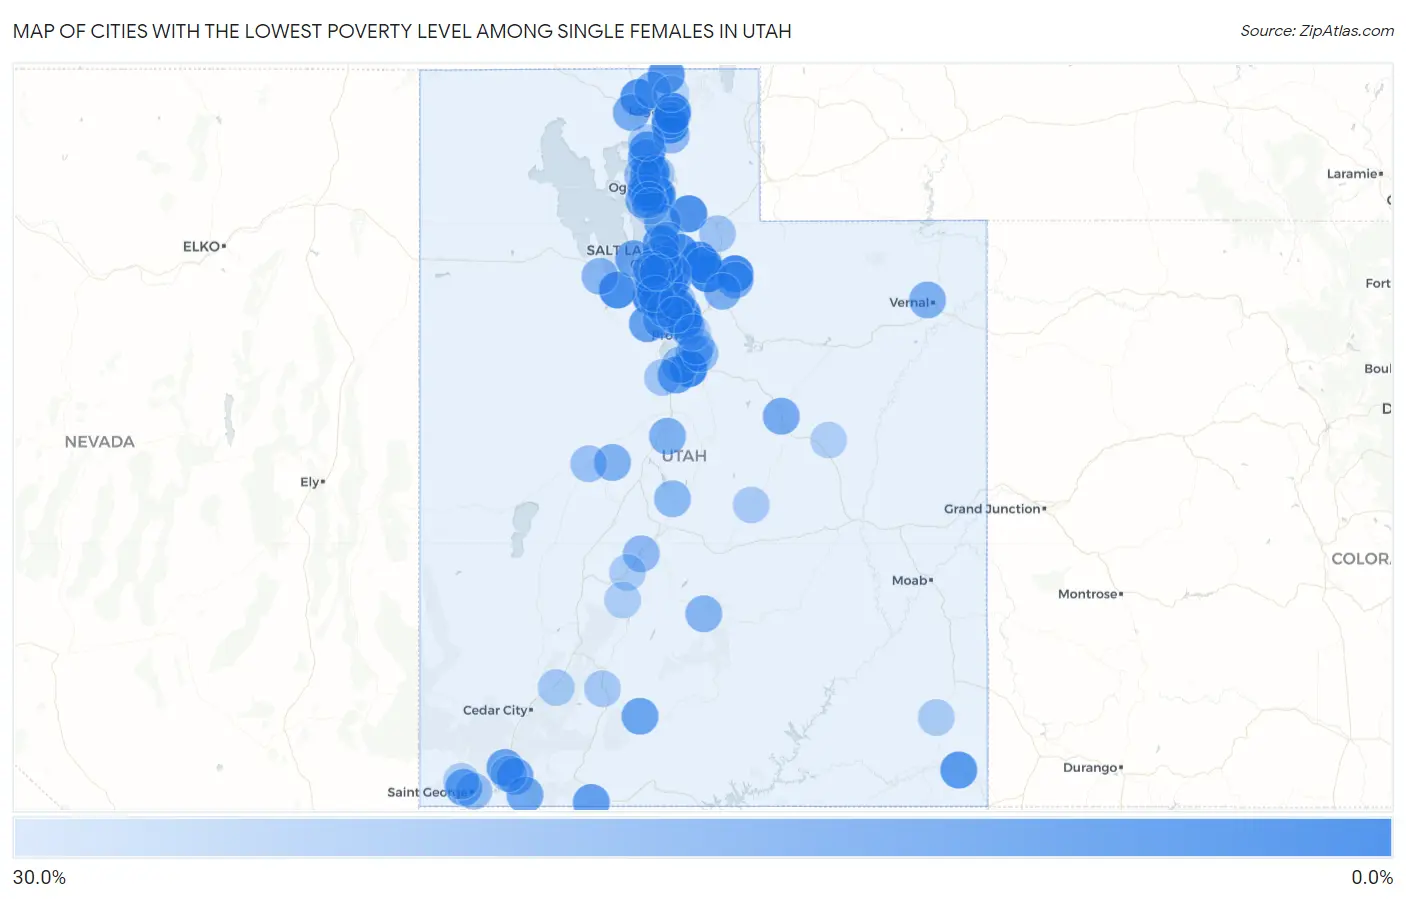
Map of Cities with the Lowest Poverty Level Among Single Females in Utah
30.0%
0.0%
Cities with the Lowest Poverty Level Among Single Females in Utah
| City | Single Female Poverty | vs State | vs National | |
| 1. | Washington Terrace | 2.2% | 17.7%(-15.5)#1 | 24.1%(-21.9)#113 |
| 2. | Lindon | 2.8% | 17.7%(-14.9)#2 | 24.1%(-21.3)#196 |
| 3. | Herriman | 2.8% | 17.7%(-14.9)#3 | 24.1%(-21.2)#198 |
| 4. | Park City | 2.9% | 17.7%(-14.8)#4 | 24.1%(-21.1)#220 |
| 5. | Elk Ridge | 3.3% | 17.7%(-14.4)#5 | 24.1%(-20.7)#294 |
| 6. | Kamas | 4.6% | 17.7%(-13.1)#6 | 24.1%(-19.5)#597 |
| 7. | Summit Park | 4.7% | 17.7%(-13.0)#7 | 24.1%(-19.4)#612 |
| 8. | River Heights | 5.0% | 17.7%(-12.7)#8 | 24.1%(-19.1)#698 |
| 9. | Tooele | 5.1% | 17.7%(-12.6)#9 | 24.1%(-18.9)#745 |
| 10. | South Jordan | 5.1% | 17.7%(-12.6)#10 | 24.1%(-18.9)#747 |
| 11. | Murray | 5.2% | 17.7%(-12.5)#11 | 24.1%(-18.9)#767 |
| 12. | Hyrum | 5.8% | 17.7%(-12.0)#12 | 24.1%(-18.3)#922 |
| 13. | Farr West | 6.2% | 17.7%(-11.5)#13 | 24.1%(-17.8)#1,075 |
| 14. | Emigration Canyon | 6.4% | 17.7%(-11.3)#14 | 24.1%(-17.7)#1,131 |
| 15. | Morgan | 6.5% | 17.7%(-11.2)#15 | 24.1%(-17.6)#1,163 |
| 16. | Fielding | 6.7% | 17.7%(-11.0)#16 | 24.1%(-17.4)#1,229 |
| 17. | Pleasant View | 7.2% | 17.7%(-10.5)#17 | 24.1%(-16.9)#1,416 |
| 18. | Snyderville | 7.3% | 17.7%(-10.4)#18 | 24.1%(-16.8)#1,431 |
| 19. | North Salt Lake | 7.5% | 17.7%(-10.2)#19 | 24.1%(-16.5)#1,517 |
| 20. | Lewiston | 7.5% | 17.7%(-10.2)#20 | 24.1%(-16.5)#1,525 |
| 21. | Draper | 7.7% | 17.7%(-10.1)#21 | 24.1%(-16.4)#1,551 |
| 22. | Montezuma Creek | 8.3% | 17.7%(-9.38)#22 | 24.1%(-15.7)#1,836 |
| 23. | Perry | 9.0% | 17.7%(-8.71)#23 | 24.1%(-15.1)#2,032 |
| 24. | Riverdale | 9.1% | 17.7%(-8.65)#24 | 24.1%(-15.0)#2,043 |
| 25. | Pleasant Grove | 9.4% | 17.7%(-8.31)#25 | 24.1%(-14.7)#2,202 |
| 26. | Sandy | 10.0% | 17.7%(-7.75)#26 | 24.1%(-14.1)#2,395 |
| 27. | South Ogden | 10.4% | 17.7%(-7.33)#27 | 24.1%(-13.7)#2,577 |
| 28. | Santaquin | 10.5% | 17.7%(-7.24)#28 | 24.1%(-13.6)#2,602 |
| 29. | Eagle Mountain | 10.6% | 17.7%(-7.11)#29 | 24.1%(-13.5)#2,688 |
| 30. | Kanab | 10.8% | 17.7%(-6.88)#30 | 24.1%(-13.2)#2,777 |
| 31. | Cottonwood Heights | 11.0% | 17.7%(-6.69)#31 | 24.1%(-13.1)#2,841 |
| 32. | Saratoga Springs | 11.5% | 17.7%(-6.21)#32 | 24.1%(-12.6)#3,029 |
| 33. | Toquerville | 11.5% | 17.7%(-6.17)#33 | 24.1%(-12.5)#3,039 |
| 34. | Magna | 11.6% | 17.7%(-6.09)#34 | 24.1%(-12.5)#3,074 |
| 35. | Farmington | 11.6% | 17.7%(-6.09)#35 | 24.1%(-12.5)#3,075 |
| 36. | Tropic | 11.8% | 17.7%(-5.95)#36 | 24.1%(-12.3)#3,140 |
| 37. | Santa Clara | 11.9% | 17.7%(-5.86)#37 | 24.1%(-12.2)#3,175 |
| 38. | Clinton | 12.3% | 17.7%(-5.45)#38 | 24.1%(-11.8)#3,317 |
| 39. | Virgin | 12.5% | 17.7%(-5.21)#39 | 24.1%(-11.6)#3,412 |
| 40. | Millcreek | 12.7% | 17.7%(-5.03)#40 | 24.1%(-11.4)#3,509 |
| 41. | Apple Valley | 13.0% | 17.7%(-4.67)#41 | 24.1%(-11.0)#3,638 |
| 42. | Tremonton | 13.6% | 17.7%(-4.11)#42 | 24.1%(-10.5)#3,875 |
| 43. | Helper | 13.7% | 17.7%(-3.99)#43 | 24.1%(-10.4)#3,915 |
| 44. | West Haven | 14.0% | 17.7%(-3.75)#44 | 24.1%(-10.1)#4,016 |
| 45. | Holladay | 14.1% | 17.7%(-3.59)#45 | 24.1%(-9.96)#4,065 |
| 46. | Willard | 14.3% | 17.7%(-3.43)#46 | 24.1%(-9.79)#4,117 |
| 47. | Francis | 14.3% | 17.7%(-3.43)#47 | 24.1%(-9.79)#4,119 |
| 48. | Highland | 14.4% | 17.7%(-3.32)#48 | 24.1%(-9.69)#4,229 |
| 49. | Heber | 15.0% | 17.7%(-2.71)#49 | 24.1%(-9.08)#4,444 |
| 50. | Midvale | 15.1% | 17.7%(-2.62)#50 | 24.1%(-8.99)#4,488 |
| 51. | Roy | 15.2% | 17.7%(-2.55)#51 | 24.1%(-8.91)#4,510 |
| 52. | Maeser | 15.3% | 17.7%(-2.46)#52 | 24.1%(-8.82)#4,538 |
| 53. | South Salt Lake | 15.3% | 17.7%(-2.37)#53 | 24.1%(-8.74)#4,577 |
| 54. | Levan | 15.4% | 17.7%(-2.33)#54 | 24.1%(-8.69)#4,606 |
| 55. | West Jordan | 15.6% | 17.7%(-2.16)#55 | 24.1%(-8.52)#4,684 |
| 56. | Oak City | 15.6% | 17.7%(-2.09)#56 | 24.1%(-8.45)#4,720 |
| 57. | Orem | 16.0% | 17.7%(-1.74)#57 | 24.1%(-8.11)#4,851 |
| 58. | Bluffdale | 16.5% | 17.7%(-1.24)#58 | 24.1%(-7.60)#5,032 |
| 59. | Newton | 16.7% | 17.7%(-1.05)#59 | 24.1%(-7.41)#5,111 |
| 60. | Bicknell | 16.7% | 17.7%(-1.05)#60 | 24.1%(-7.41)#5,143 |
| 61. | Salt Lake City | 16.7% | 17.7%(-0.978)#61 | 24.1%(-7.34)#5,221 |
| 62. | Grantsville | 16.9% | 17.7%(-0.843)#62 | 24.1%(-7.21)#5,257 |
| 63. | Spanish Fork | 17.7% | 17.7%(+0.025)#63 | 24.1%(-6.34)#5,609 |
| 64. | Centerfield | 17.8% | 17.7%(+0.065)#64 | 24.1%(-6.30)#5,635 |
| 65. | Richfield | 17.9% | 17.7%(+0.144)#65 | 24.1%(-6.22)#5,660 |
| 66. | Paradise | 18.2% | 17.7%(+0.469)#66 | 24.1%(-5.89)#5,789 |
| 67. | Nibley | 18.6% | 17.7%(+0.904)#67 | 24.1%(-5.46)#5,970 |
| 68. | Payson | 18.7% | 17.7%(+0.999)#68 | 24.1%(-5.36)#6,005 |
| 69. | Mapleton | 19.0% | 17.7%(+1.28)#69 | 24.1%(-5.08)#6,134 |
| 70. | St George | 19.5% | 17.7%(+1.75)#70 | 24.1%(-4.61)#6,322 |
| 71. | Plain City | 19.6% | 17.7%(+1.85)#71 | 24.1%(-4.51)#6,358 |
| 72. | Kearns | 19.6% | 17.7%(+1.91)#72 | 24.1%(-4.46)#6,390 |
| 73. | West Valley City | 19.9% | 17.7%(+2.19)#73 | 24.1%(-4.17)#6,458 |
| 74. | Lehi | 20.0% | 17.7%(+2.27)#74 | 24.1%(-4.09)#6,476 |
| 75. | Riverton | 20.0% | 17.7%(+2.29)#75 | 24.1%(-4.08)#6,479 |
| 76. | Providence | 20.1% | 17.7%(+2.39)#76 | 24.1%(-3.98)#6,684 |
| 77. | Delta | 20.5% | 17.7%(+2.80)#77 | 24.1%(-3.56)#6,793 |
| 78. | Springville | 20.6% | 17.7%(+2.94)#78 | 24.1%(-3.43)#6,838 |
| 79. | La Verkin | 20.9% | 17.7%(+3.20)#79 | 24.1%(-3.17)#6,942 |
| 80. | Coalville | 20.9% | 17.7%(+3.22)#80 | 24.1%(-3.15)#6,950 |
| 81. | Alpine | 21.0% | 17.7%(+3.29)#81 | 24.1%(-3.08)#6,973 |
| 82. | Goshen | 21.4% | 17.7%(+3.72)#82 | 24.1%(-2.65)#7,138 |
| 83. | North Ogden | 21.8% | 17.7%(+4.07)#83 | 24.1%(-2.29)#7,272 |
| 84. | Sunset | 21.9% | 17.7%(+4.16)#84 | 24.1%(-2.20)#7,301 |
| 85. | Parowan | 22.2% | 17.7%(+4.51)#85 | 24.1%(-1.85)#7,434 |
| 86. | Panguitch | 22.2% | 17.7%(+4.51)#86 | 24.1%(-1.85)#7,446 |
| 87. | Brigham City | 22.9% | 17.7%(+5.19)#87 | 24.1%(-1.17)#7,776 |
| 88. | Ferron | 23.1% | 17.7%(+5.36)#88 | 24.1%(-1.000)#7,845 |
| 89. | Ivins | 23.3% | 17.7%(+5.55)#89 | 24.1%(-0.809)#7,940 |
| 90. | Bountiful | 23.4% | 17.7%(+5.69)#90 | 24.1%(-0.670)#8,009 |
| 91. | Joseph | 23.5% | 17.7%(+5.82)#91 | 24.1%(-0.547)#8,050 |
| 92. | Blanding | 23.6% | 17.7%(+5.85)#92 | 24.1%(-0.510)#8,066 |
| 93. | Taylorsville | 23.7% | 17.7%(+6.01)#93 | 24.1%(-0.349)#8,117 |
| 94. | Marysvale | 23.8% | 17.7%(+6.10)#94 | 24.1%(-0.267)#8,153 |
| 95. | American Fork | 24.0% | 17.7%(+6.24)#95 | 24.1%(-0.120)#8,204 |
| 96. | East Carbon | 24.1% | 17.7%(+6.36)#96 | 24.1%(-0.002)#8,247 |
| 97. | White | 24.2% | 17.7%(+6.44)#97 | 24.1%(+0.078)#8,289 |
| 98. | Provo | 24.6% | 17.7%(+6.91)#98 | 24.1%(+0.542)#8,456 |
| 99. | Clearfield | 25.2% | 17.7%(+7.53)#99 | 24.1%(+1.17)#8,778 |
| 100. | Smithfield | 25.4% | 17.7%(+7.64)#100 | 24.1%(+1.28)#8,812 |
Common Questions
What are the Top 10 Cities with the Lowest Poverty Level Among Single Females in Utah?
Top 10 Cities with the Lowest Poverty Level Among Single Females in Utah are:
#1
2.2%
#2
2.8%
#3
2.8%
#4
2.9%
#5
3.3%
#6
4.6%
#7
4.7%
#8
5.0%
#9
5.1%
#10
5.1%
What city has the Lowest Poverty Level Among Single Females in Utah?
Washington Terrace has the Lowest Poverty Level Among Single Females in Utah with 2.2%.
What is the Poverty Level Among Single Females in the State of Utah?
Poverty Level Among Single Females in Utah is 17.7%.
What is the Poverty Level Among Single Females in the United States?
Poverty Level Among Single Females in the United States is 24.1%.