Cities with the Lowest Poverty Level Among Single Females in Tennessee
RELATED REPORTS & OPTIONS
Lowest Poverty | Single Female
Tennessee
Compare Cities
Map of Cities with the Lowest Poverty Level Among Single Females in Tennessee
25.0%
0.0%
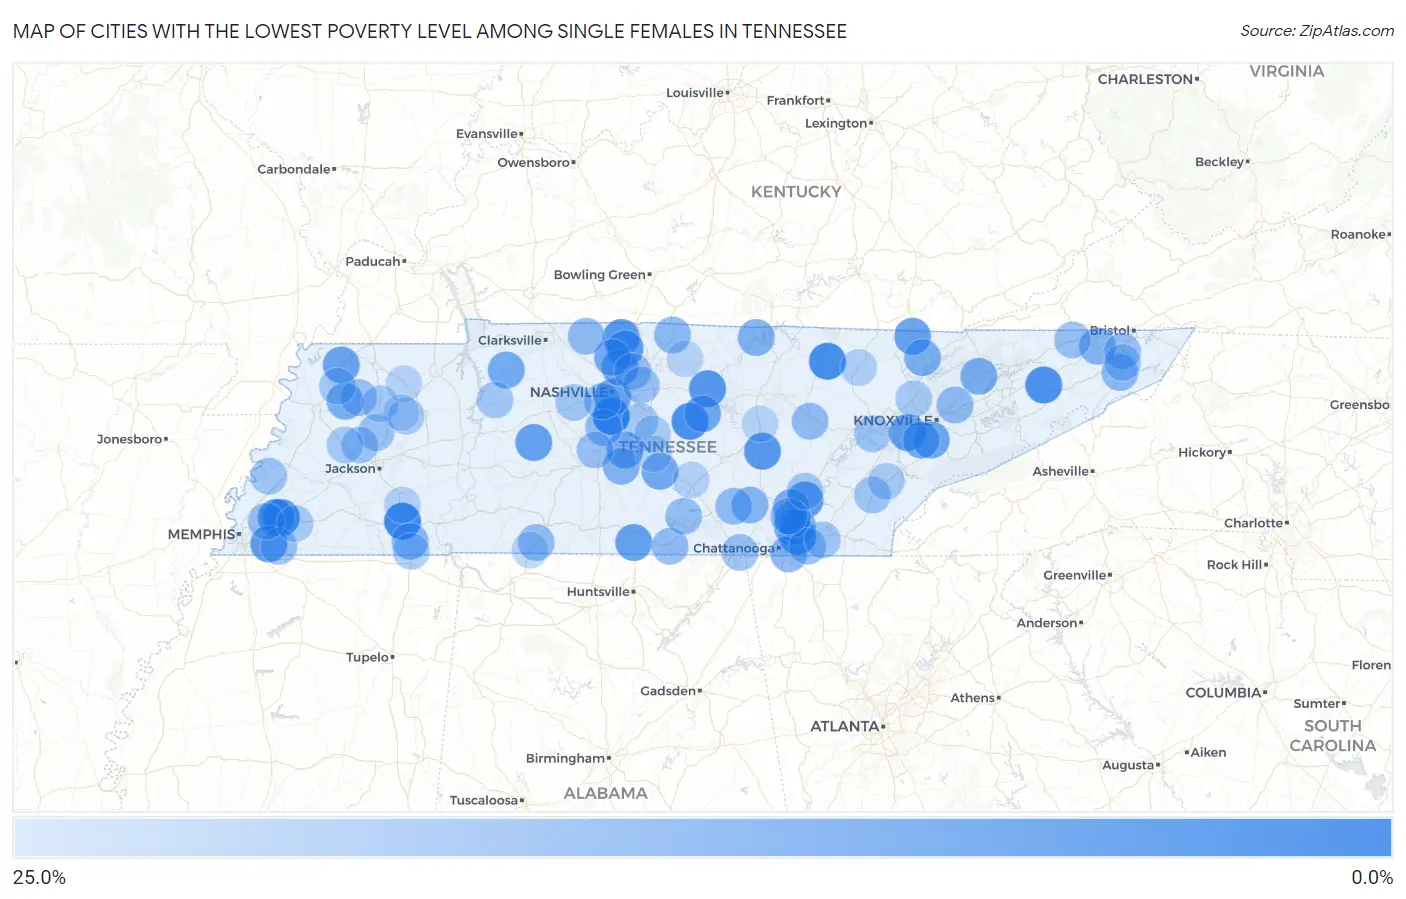
Cities with the Lowest Poverty Level Among Single Females in Tennessee
| City | Single Female Poverty | vs State | vs National | |
| 1. | Brentwood | 0.69% | 27.6%(-26.9)#1 | 24.1%(-23.4)#7 |
| 2. | Bethel Springs | 1.6% | 27.6%(-26.1)#2 | 24.1%(-22.5)#47 |
| 3. | Allardt | 2.6% | 27.6%(-25.0)#3 | 24.1%(-21.5)#156 |
| 4. | Harrison | 3.2% | 27.6%(-24.4)#4 | 24.1%(-20.9)#276 |
| 5. | Arlington | 3.3% | 27.6%(-24.3)#5 | 24.1%(-20.8)#286 |
| 6. | Auburntown | 3.4% | 27.6%(-24.2)#6 | 24.1%(-20.6)#323 |
| 7. | Mosheim | 3.8% | 27.6%(-23.8)#7 | 24.1%(-20.2)#411 |
| 8. | Gordonsville | 5.1% | 27.6%(-22.5)#8 | 24.1%(-19.0)#731 |
| 9. | Cross Plains | 5.4% | 27.6%(-22.2)#9 | 24.1%(-18.7)#820 |
| 10. | Lakeland | 5.5% | 27.6%(-22.1)#10 | 24.1%(-18.5)#852 |
| 11. | Spencer | 5.7% | 27.6%(-22.0)#11 | 24.1%(-18.4)#895 |
| 12. | Sale Creek | 6.6% | 27.6%(-21.0)#12 | 24.1%(-17.5)#1,191 |
| 13. | White House | 6.7% | 27.6%(-20.9)#13 | 24.1%(-17.4)#1,248 |
| 14. | Farragut | 6.8% | 27.6%(-20.8)#14 | 24.1%(-17.3)#1,264 |
| 15. | Germantown | 6.8% | 27.6%(-20.8)#15 | 24.1%(-17.3)#1,272 |
| 16. | Centerville | 7.4% | 27.6%(-20.2)#16 | 24.1%(-16.6)#1,491 |
| 17. | Park City | 7.7% | 27.6%(-19.9)#17 | 24.1%(-16.4)#1,558 |
| 18. | Jellico | 7.7% | 27.6%(-19.9)#18 | 24.1%(-16.4)#1,564 |
| 19. | Berry Hill | 7.8% | 27.6%(-19.8)#19 | 24.1%(-16.3)#1,629 |
| 20. | Troy | 8.2% | 27.6%(-19.4)#20 | 24.1%(-15.9)#1,767 |
| 21. | Goodlettsville | 8.6% | 27.6%(-19.0)#21 | 24.1%(-15.4)#1,916 |
| 22. | Alcoa | 8.8% | 27.6%(-18.8)#22 | 24.1%(-15.3)#1,965 |
| 23. | Eagleville | 9.4% | 27.6%(-18.2)#23 | 24.1%(-14.7)#2,193 |
| 24. | Liberty | 9.5% | 27.6%(-18.1)#24 | 24.1%(-14.6)#2,247 |
| 25. | Louisville | 9.7% | 27.6%(-18.0)#25 | 24.1%(-14.4)#2,290 |
| 26. | Bell Buckle | 9.8% | 27.6%(-17.9)#26 | 24.1%(-14.3)#2,341 |
| 27. | Erin | 10.0% | 27.6%(-17.6)#27 | 24.1%(-14.1)#2,422 |
| 28. | Ridgetop | 10.2% | 27.6%(-17.4)#28 | 24.1%(-13.9)#2,499 |
| 29. | Strawberry Plains | 10.2% | 27.6%(-17.4)#29 | 24.1%(-13.9)#2,519 |
| 30. | Middle Valley | 10.5% | 27.6%(-17.1)#30 | 24.1%(-13.6)#2,617 |
| 31. | Karns | 10.7% | 27.6%(-16.9)#31 | 24.1%(-13.4)#2,726 |
| 32. | Rutledge | 10.7% | 27.6%(-16.9)#32 | 24.1%(-13.4)#2,733 |
| 33. | Flat Top Mountain | 10.7% | 27.6%(-16.9)#33 | 24.1%(-13.4)#2,738 |
| 34. | Fincastle | 11.0% | 27.6%(-16.6)#34 | 24.1%(-13.1)#2,828 |
| 35. | Yorkville | 11.1% | 27.6%(-16.5)#35 | 24.1%(-13.0)#2,902 |
| 36. | Lakesite | 11.2% | 27.6%(-16.4)#36 | 24.1%(-12.8)#2,948 |
| 37. | Oak Grove Cdp Washington County | 11.5% | 27.6%(-16.1)#37 | 24.1%(-12.6)#3,028 |
| 38. | Celina | 11.7% | 27.6%(-15.9)#38 | 24.1%(-12.4)#3,106 |
| 39. | Chapel Hill | 11.9% | 27.6%(-15.7)#39 | 24.1%(-12.1)#3,200 |
| 40. | Fowlkes | 12.0% | 27.6%(-15.6)#40 | 24.1%(-12.1)#3,230 |
| 41. | Colonial Heights | 12.5% | 27.6%(-15.1)#41 | 24.1%(-11.6)#3,387 |
| 42. | Eastview | 12.5% | 27.6%(-15.1)#42 | 24.1%(-11.6)#3,405 |
| 43. | East Ridge | 12.5% | 27.6%(-15.1)#43 | 24.1%(-11.5)#3,462 |
| 44. | Soddy Daisy | 12.7% | 27.6%(-14.9)#44 | 24.1%(-11.3)#3,516 |
| 45. | Palmer | 12.8% | 27.6%(-14.8)#45 | 24.1%(-11.3)#3,534 |
| 46. | Pine Crest | 13.2% | 27.6%(-14.4)#46 | 24.1%(-10.8)#3,721 |
| 47. | Westmoreland | 13.4% | 27.6%(-14.2)#47 | 24.1%(-10.7)#3,808 |
| 48. | Biltmore | 13.8% | 27.6%(-13.8)#48 | 24.1%(-10.3)#3,946 |
| 49. | Cedar Hill | 13.9% | 27.6%(-13.7)#49 | 24.1%(-10.2)#3,992 |
| 50. | Mascot | 13.9% | 27.6%(-13.7)#50 | 24.1%(-10.1)#4,001 |
| 51. | Orebank | 14.0% | 27.6%(-13.6)#51 | 24.1%(-10.1)#4,029 |
| 52. | Crossville | 14.2% | 27.6%(-13.4)#52 | 24.1%(-9.85)#4,088 |
| 53. | Franklin | 14.3% | 27.6%(-13.4)#53 | 24.1%(-9.81)#4,095 |
| 54. | Huntland | 14.3% | 27.6%(-13.3)#54 | 24.1%(-9.79)#4,124 |
| 55. | Coalmont | 14.3% | 27.6%(-13.3)#55 | 24.1%(-9.79)#4,132 |
| 56. | Loretto | 14.4% | 27.6%(-13.2)#56 | 24.1%(-9.69)#4,228 |
| 57. | Collegedale | 14.5% | 27.6%(-13.1)#57 | 24.1%(-9.60)#4,251 |
| 58. | Mowbray Mountain | 14.6% | 27.6%(-13.0)#58 | 24.1%(-9.49)#4,289 |
| 59. | Belle Meade | 14.8% | 27.6%(-12.8)#59 | 24.1%(-9.26)#4,378 |
| 60. | Collierville | 15.1% | 27.6%(-12.5)#60 | 24.1%(-9.00)#4,485 |
| 61. | Estill Springs | 15.1% | 27.6%(-12.5)#61 | 24.1%(-8.94)#4,499 |
| 62. | New Hope | 15.2% | 27.6%(-12.5)#62 | 24.1%(-8.92)#4,504 |
| 63. | Church Hill | 15.2% | 27.6%(-12.5)#63 | 24.1%(-8.91)#4,509 |
| 64. | Bartlett | 15.3% | 27.6%(-12.3)#64 | 24.1%(-8.80)#4,551 |
| 65. | Hendersonville | 15.4% | 27.6%(-12.2)#65 | 24.1%(-8.65)#4,646 |
| 66. | Rutherford | 15.5% | 27.6%(-12.1)#66 | 24.1%(-8.58)#4,667 |
| 67. | Spring Hill | 15.6% | 27.6%(-12.0)#67 | 24.1%(-8.47)#4,705 |
| 68. | Mount Juliet | 15.7% | 27.6%(-11.9)#68 | 24.1%(-8.40)#4,736 |
| 69. | Bluff City | 15.7% | 27.6%(-11.9)#69 | 24.1%(-8.36)#4,746 |
| 70. | Gibson | 15.8% | 27.6%(-11.8)#70 | 24.1%(-8.29)#4,787 |
| 71. | Kingston | 16.0% | 27.6%(-11.6)#71 | 24.1%(-8.03)#4,886 |
| 72. | Englewood | 16.1% | 27.6%(-11.5)#72 | 24.1%(-8.01)#4,898 |
| 73. | Burlison | 16.1% | 27.6%(-11.5)#73 | 24.1%(-7.95)#4,922 |
| 74. | Gadsden | 16.2% | 27.6%(-11.4)#74 | 24.1%(-7.86)#4,951 |
| 75. | Waverly | 16.7% | 27.6%(-10.9)#75 | 24.1%(-7.35)#5,220 |
| 76. | Graysville | 16.8% | 27.6%(-10.8)#76 | 24.1%(-7.30)#5,228 |
| 77. | Kingston Springs | 16.8% | 27.6%(-10.8)#77 | 24.1%(-7.26)#5,242 |
| 78. | South Cleveland | 16.9% | 27.6%(-10.7)#78 | 24.1%(-7.20)#5,259 |
| 79. | Trimble | 17.1% | 27.6%(-10.5)#79 | 24.1%(-7.00)#5,330 |
| 80. | Watauga | 17.2% | 27.6%(-10.4)#80 | 24.1%(-6.89)#5,381 |
| 81. | Finley | 17.4% | 27.6%(-10.2)#81 | 24.1%(-6.69)#5,462 |
| 82. | Bradford | 17.5% | 27.6%(-10.1)#82 | 24.1%(-6.53)#5,533 |
| 83. | Smyrna | 17.5% | 27.6%(-10.1)#83 | 24.1%(-6.53)#5,535 |
| 84. | Clinton | 17.5% | 27.6%(-10.1)#84 | 24.1%(-6.53)#5,537 |
| 85. | Guys | 17.6% | 27.6%(-9.97)#85 | 24.1%(-6.43)#5,582 |
| 86. | Madisonville | 17.7% | 27.6%(-9.87)#86 | 24.1%(-6.33)#5,613 |
| 87. | Oakland | 17.9% | 27.6%(-9.76)#87 | 24.1%(-6.22)#5,659 |
| 88. | Alamo | 17.9% | 27.6%(-9.73)#88 | 24.1%(-6.20)#5,680 |
| 89. | Mclemoresville | 18.2% | 27.6%(-9.43)#89 | 24.1%(-5.89)#5,820 |
| 90. | Murfreesboro | 18.5% | 27.6%(-9.13)#90 | 24.1%(-5.59)#5,917 |
| 91. | Elgin | 18.8% | 27.6%(-8.86)#91 | 24.1%(-5.33)#6,055 |
| 92. | Finger | 19.4% | 27.6%(-8.26)#92 | 24.1%(-4.72)#6,285 |
| 93. | New Union | 19.5% | 27.6%(-8.10)#93 | 24.1%(-4.56)#6,337 |
| 94. | Christiana | 19.8% | 27.6%(-7.85)#94 | 24.1%(-4.31)#6,434 |
| 95. | Sparta | 19.9% | 27.6%(-7.73)#95 | 24.1%(-4.19)#6,454 |
| 96. | Hartsville Trousdale County | 20.0% | 27.6%(-7.66)#96 | 24.1%(-4.12)#6,469 |
| 97. | Gleason | 20.0% | 27.6%(-7.61)#97 | 24.1%(-4.08)#6,520 |
| 98. | Trezevant | 20.0% | 27.6%(-7.61)#98 | 24.1%(-4.08)#6,522 |
| 99. | St Joseph | 20.0% | 27.6%(-7.61)#99 | 24.1%(-4.08)#6,539 |
| 100. | Powell | 20.1% | 27.6%(-7.54)#100 | 24.1%(-4.00)#6,676 |
Common Questions
What are the Top 10 Cities with the Lowest Poverty Level Among Single Females in Tennessee?
Top 10 Cities with the Lowest Poverty Level Among Single Females in Tennessee are:
#1
0.69%
#2
1.6%
#3
2.6%
#4
3.2%
#5
3.3%
#6
3.4%
#7
3.8%
#8
5.1%
#9
5.4%
#10
5.5%
What city has the Lowest Poverty Level Among Single Females in Tennessee?
Brentwood has the Lowest Poverty Level Among Single Females in Tennessee with 0.69%.
What is the Poverty Level Among Single Females in the State of Tennessee?
Poverty Level Among Single Females in Tennessee is 27.6%.
What is the Poverty Level Among Single Females in the United States?
Poverty Level Among Single Females in the United States is 24.1%.