Vista Santa Rosa, CA Map & Demographics
Vista Santa Rosa Map
Vista Santa Rosa Overview
$29,024
PER CAPITA INCOME
$66,141
AVG FAMILY INCOME
$64,375
AVG HOUSEHOLD INCOME
24.9%
WAGE / INCOME GAP [ % ]
75.1¢/ $1
WAGE / INCOME GAP [ $ ]
0.42
INEQUALITY / GINI INDEX
2,269
TOTAL POPULATION
1,025
MALE POPULATION
1,244
FEMALE POPULATION
82.40
MALES / 100 FEMALES
121.37
FEMALES / 100 MALES
40.6
MEDIAN AGE
3.9
AVG FAMILY SIZE
3.4
AVG HOUSEHOLD SIZE
1,121
LABOR FORCE [ PEOPLE ]
64.0%
PERCENT IN LABOR FORCE
6.0%
UNEMPLOYMENT RATE
Income in Vista Santa Rosa
Income Overview in Vista Santa Rosa
Per Capita Income in Vista Santa Rosa is $29,024, while median incomes of families and households are $66,141 and $64,375 respectively.
| Characteristic | Number | Measure |
| Per Capita Income | 2,269 | $29,024 |
| Median Family Income | 472 | $66,141 |
| Mean Family Income | 472 | $101,248 |
| Median Household Income | 664 | $64,375 |
| Mean Household Income | 664 | $88,906 |
| Income Deficit | 472 | $0 |
| Wage / Income Gap (%) | 2,269 | 24.93% |
| Wage / Income Gap ($) | 2,269 | 75.07¢ per $1 |
| Gini / Inequality Index | 2,269 | 0.42 |
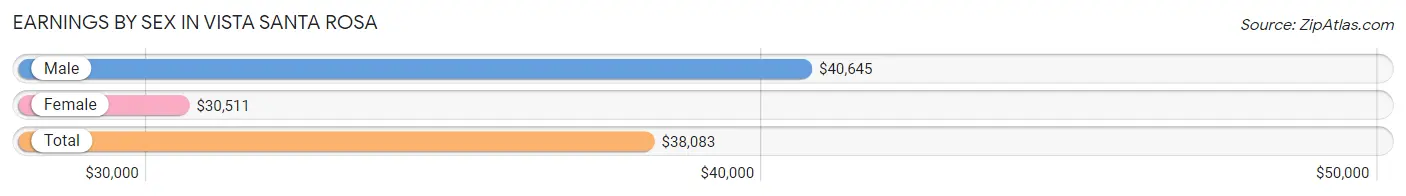
Earnings by Sex in Vista Santa Rosa
Average Earnings in Vista Santa Rosa are $38,083, $40,645 for men and $30,511 for women, a difference of 24.9%.
| Sex | Number | Average Earnings |
| Male | 450 (39.5%) | $40,645 |
| Female | 689 (60.5%) | $30,511 |
| Total | 1,139 (100.0%) | $38,083 |
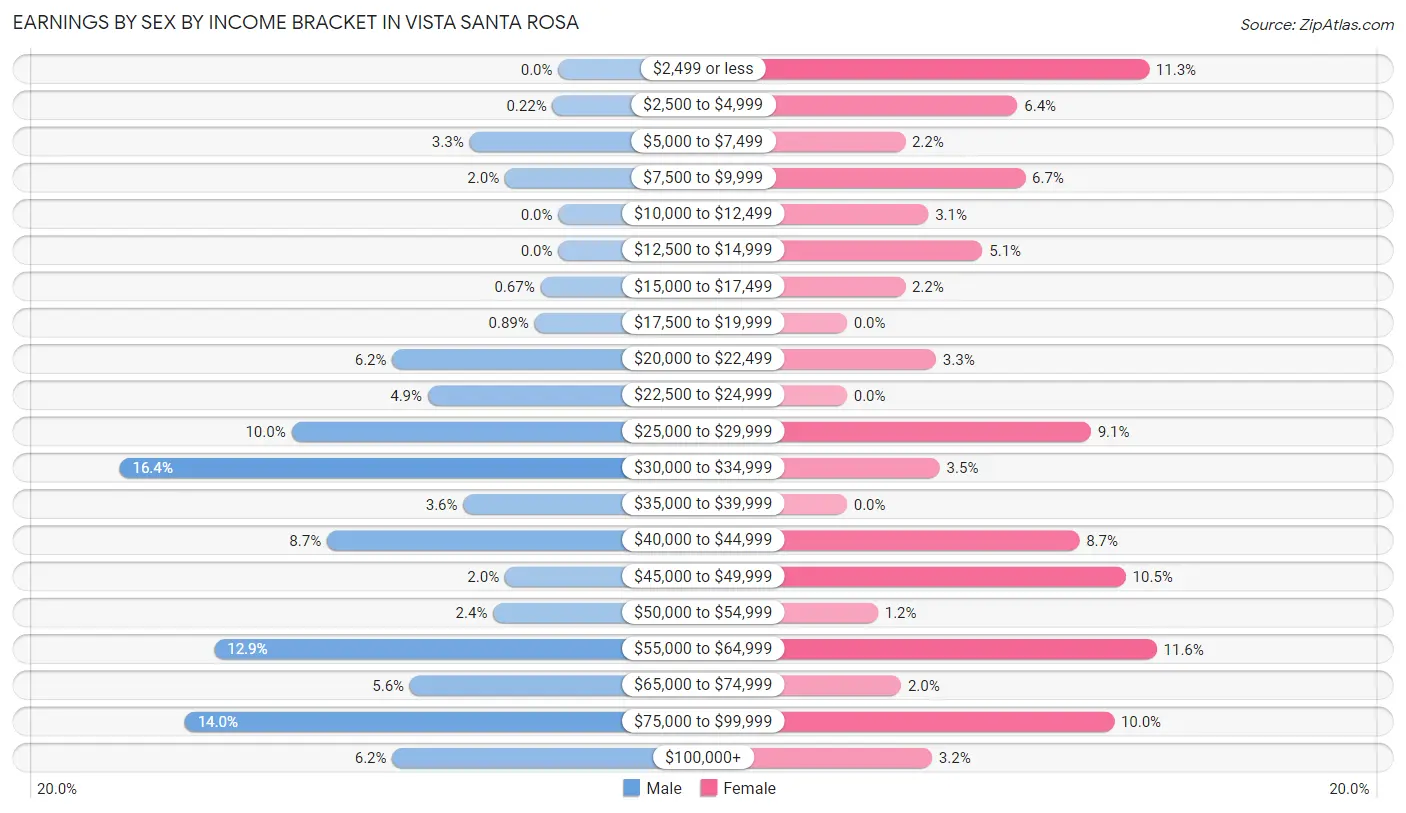
Earnings by Sex by Income Bracket in Vista Santa Rosa
The most common earnings brackets in Vista Santa Rosa are $30,000 to $34,999 for men (74 | 16.4%) and $55,000 to $64,999 for women (80 | 11.6%).
| Income | Male | Female |
| $2,499 or less | 0 (0.0%) | 78 (11.3%) |
| $2,500 to $4,999 | 1 (0.2%) | 44 (6.4%) |
| $5,000 to $7,499 | 15 (3.3%) | 15 (2.2%) |
| $7,500 to $9,999 | 9 (2.0%) | 46 (6.7%) |
| $10,000 to $12,499 | 0 (0.0%) | 21 (3.0%) |
| $12,500 to $14,999 | 0 (0.0%) | 35 (5.1%) |
| $15,000 to $17,499 | 3 (0.7%) | 15 (2.2%) |
| $17,500 to $19,999 | 4 (0.9%) | 0 (0.0%) |
| $20,000 to $22,499 | 28 (6.2%) | 23 (3.3%) |
| $22,500 to $24,999 | 22 (4.9%) | 0 (0.0%) |
| $25,000 to $29,999 | 45 (10.0%) | 63 (9.1%) |
| $30,000 to $34,999 | 74 (16.4%) | 24 (3.5%) |
| $35,000 to $39,999 | 16 (3.6%) | 0 (0.0%) |
| $40,000 to $44,999 | 39 (8.7%) | 60 (8.7%) |
| $45,000 to $49,999 | 9 (2.0%) | 72 (10.4%) |
| $50,000 to $54,999 | 11 (2.4%) | 8 (1.2%) |
| $55,000 to $64,999 | 58 (12.9%) | 80 (11.6%) |
| $65,000 to $74,999 | 25 (5.6%) | 14 (2.0%) |
| $75,000 to $99,999 | 63 (14.0%) | 69 (10.0%) |
| $100,000+ | 28 (6.2%) | 22 (3.2%) |
| Total | 450 (100.0%) | 689 (100.0%) |
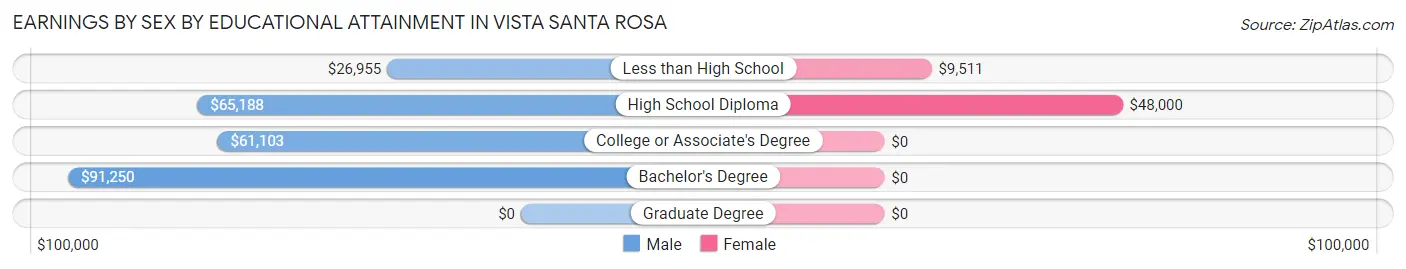
Earnings by Sex by Educational Attainment in Vista Santa Rosa
Average earnings in Vista Santa Rosa are $40,491 for men and $32,500 for women, a difference of 19.7%. Men with an educational attainment of bachelor's degree enjoy the highest average annual earnings of $91,250, while those with less than high school education earn the least with $26,955. Women with an educational attainment of high school diploma earn the most with the average annual earnings of $48,000, while those with less than high school education have the smallest earnings of $9,511.
| Educational Attainment | Male Income | Female Income |
| Less than High School | $26,955 | $9,511 |
| High School Diploma | $65,188 | $48,000 |
| College or Associate's Degree | $61,103 | $0 |
| Bachelor's Degree | $91,250 | $0 |
| Graduate Degree | - | - |
| Total | $40,491 | $32,500 |
Family Income in Vista Santa Rosa
Family Income Brackets in Vista Santa Rosa
According to the Vista Santa Rosa family income data, there are 126 families falling into the $50,000 to $74,999 income range, which is the most common income bracket and makes up 26.7% of all families. Conversely, the less than $10,000 income bracket is the least frequent group with only 4 families (0.9%) belonging to this category.
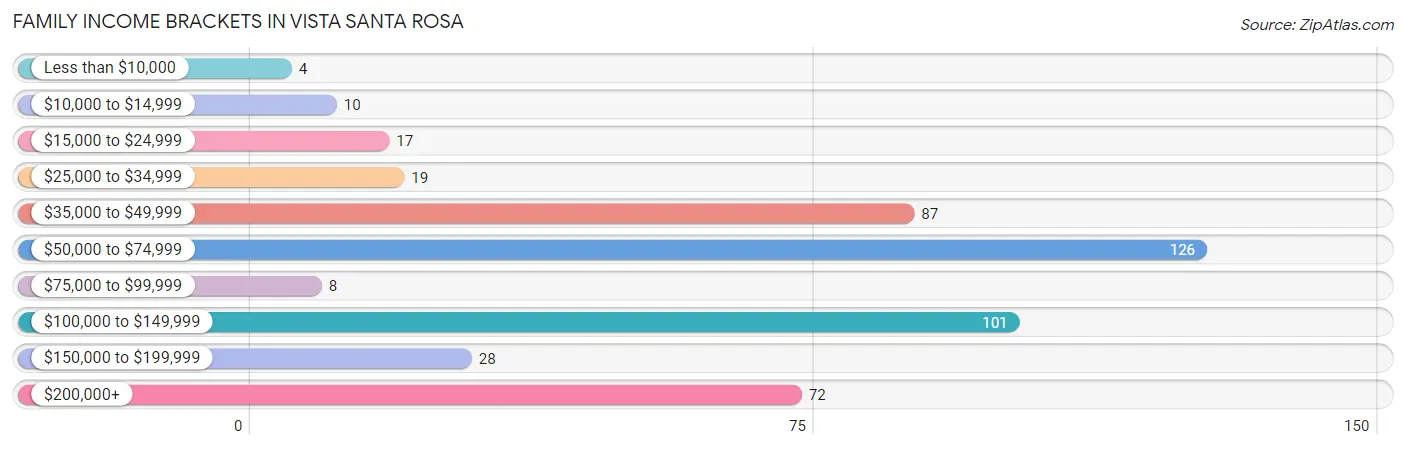
| Income Bracket | # Families | % Families |
| Less than $10,000 | 4 | 0.8% |
| $10,000 to $14,999 | 10 | 2.1% |
| $15,000 to $24,999 | 17 | 3.6% |
| $25,000 to $34,999 | 19 | 4.0% |
| $35,000 to $49,999 | 87 | 18.4% |
| $50,000 to $74,999 | 126 | 26.7% |
| $75,000 to $99,999 | 8 | 1.7% |
| $100,000 to $149,999 | 101 | 21.4% |
| $150,000 to $199,999 | 28 | 5.9% |
| $200,000+ | 72 | 15.3% |
Family Income by Famaliy Size in Vista Santa Rosa
4-person families (50 | 10.6%) account for the highest median family income in Vista Santa Rosa with $157,500 per family, while 4-person families (50 | 10.6%) have the highest median income of $39,375 per family member.
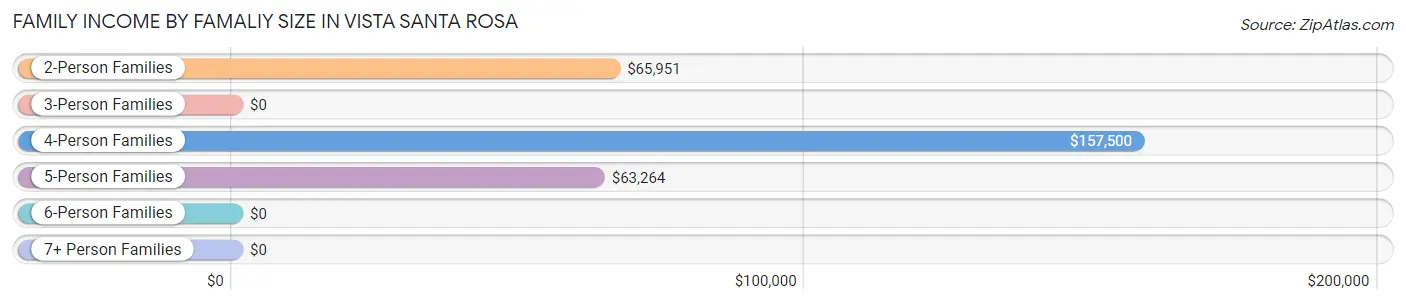
| Income Bracket | # Families | Median Income |
| 2-Person Families | 195 (41.3%) | $65,951 |
| 3-Person Families | 68 (14.4%) | $0 |
| 4-Person Families | 50 (10.6%) | $157,500 |
| 5-Person Families | 69 (14.6%) | $63,264 |
| 6-Person Families | 86 (18.2%) | $0 |
| 7+ Person Families | 4 (0.9%) | $0 |
| Total | 472 (100.0%) | $66,141 |
Family Income by Number of Earners in Vista Santa Rosa
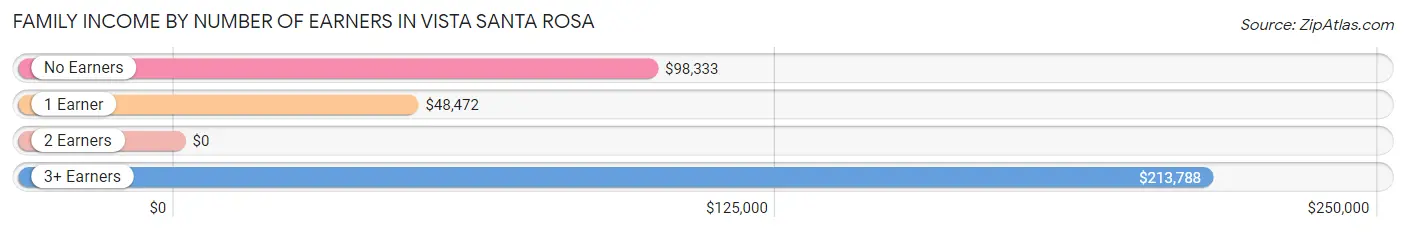
| Number of Earners | # Families | Median Income |
| No Earners | 92 (19.5%) | $98,333 |
| 1 Earner | 141 (29.9%) | $48,472 |
| 2 Earners | 155 (32.8%) | $0 |
| 3+ Earners | 84 (17.8%) | $213,788 |
| Total | 472 (100.0%) | $66,141 |
Household Income in Vista Santa Rosa
Household Income Brackets in Vista Santa Rosa
With 127 households falling in the category, the $50,000 to $74,999 income range is the most frequent in Vista Santa Rosa, accounting for 19.1% of all households. In contrast, only 10 households (1.5%) fall into the $10,000 to $14,999 income bracket, making it the least populous group.
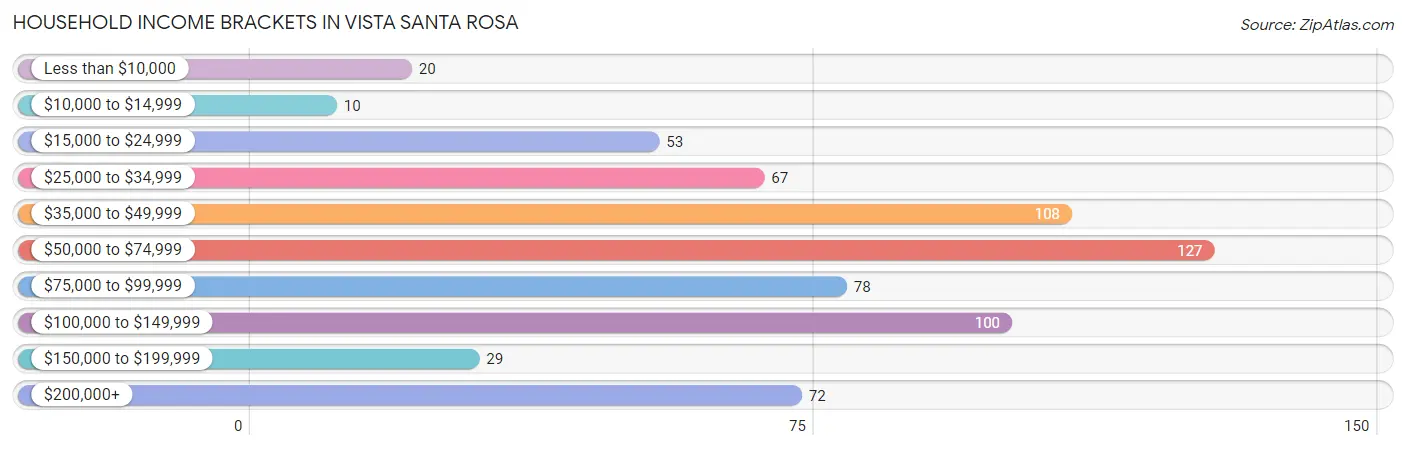
| Income Bracket | # Households | % Households |
| Less than $10,000 | 20 | 3.0% |
| $10,000 to $14,999 | 10 | 1.5% |
| $15,000 to $24,999 | 53 | 8.0% |
| $25,000 to $34,999 | 67 | 10.1% |
| $35,000 to $49,999 | 108 | 16.3% |
| $50,000 to $74,999 | 127 | 19.1% |
| $75,000 to $99,999 | 78 | 11.7% |
| $100,000 to $149,999 | 100 | 15.1% |
| $150,000 to $199,999 | 29 | 4.4% |
| $200,000+ | 72 | 10.8% |
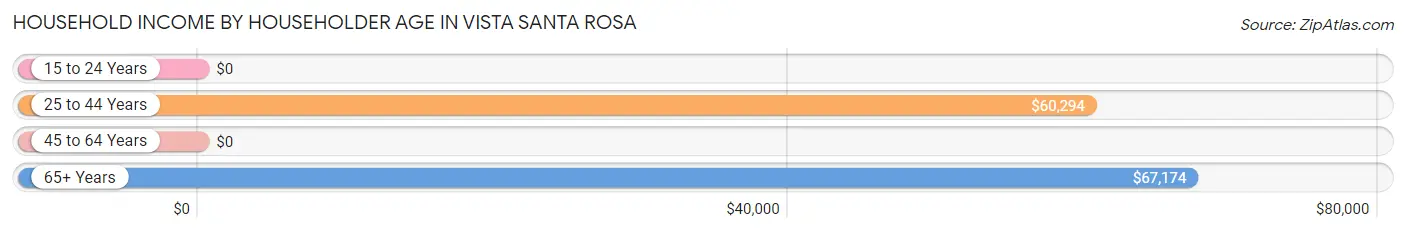
Household Income by Householder Age in Vista Santa Rosa
The median household income in Vista Santa Rosa is $64,375, with the highest median household income of $67,174 found in the 65+ years age bracket for the primary householder. A total of 242 households (36.4%) fall into this category.
| Income Bracket | # Households | Median Income |
| 15 to 24 Years | 0 (0.0%) | $0 |
| 25 to 44 Years | 224 (33.7%) | $60,294 |
| 45 to 64 Years | 198 (29.8%) | $0 |
| 65+ Years | 242 (36.4%) | $67,174 |
| Total | 664 (100.0%) | $64,375 |
Poverty in Vista Santa Rosa
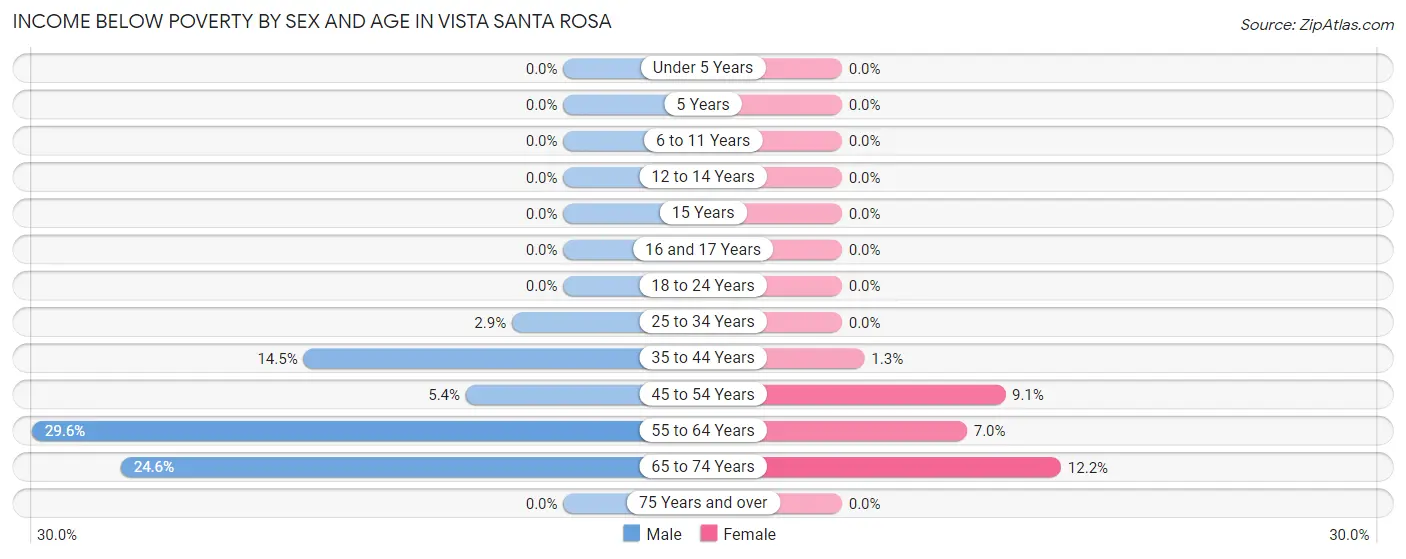
Income Below Poverty by Sex and Age in Vista Santa Rosa
With 10.2% poverty level for males and 3.0% for females among the residents of Vista Santa Rosa, 55 to 64 year old males and 65 to 74 year old females are the most vulnerable to poverty, with 29 males (29.6%) and 15 females (12.2%) in their respective age groups living below the poverty level.
| Age Bracket | Male | Female |
| Under 5 Years | 0 (0.0%) | 0 (0.0%) |
| 5 Years | 0 (0.0%) | 0 (0.0%) |
| 6 to 11 Years | 0 (0.0%) | 0 (0.0%) |
| 12 to 14 Years | 0 (0.0%) | 0 (0.0%) |
| 15 Years | 0 (0.0%) | 0 (0.0%) |
| 16 and 17 Years | 0 (0.0%) | 0 (0.0%) |
| 18 to 24 Years | 0 (0.0%) | 0 (0.0%) |
| 25 to 34 Years | 1 (2.9%) | 0 (0.0%) |
| 35 to 44 Years | 33 (14.5%) | 4 (1.3%) |
| 45 to 54 Years | 7 (5.4%) | 7 (9.1%) |
| 55 to 64 Years | 29 (29.6%) | 11 (7.0%) |
| 65 to 74 Years | 34 (24.6%) | 15 (12.2%) |
| 75 Years and over | 0 (0.0%) | 0 (0.0%) |
| Total | 104 (10.2%) | 37 (3.0%) |
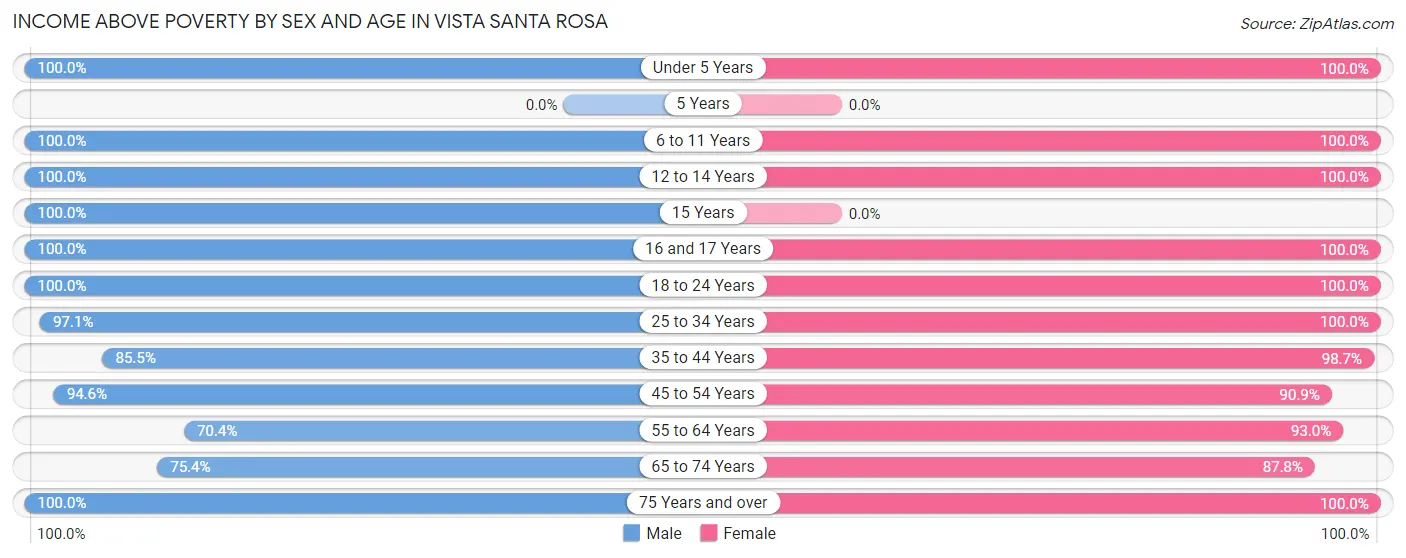
Income Above Poverty by Sex and Age in Vista Santa Rosa
According to the poverty statistics in Vista Santa Rosa, males aged under 5 years and females aged under 5 years are the age groups that are most secure financially, with 100.0% of males and 100.0% of females in these age groups living above the poverty line.
| Age Bracket | Male | Female |
| Under 5 Years | 7 (100.0%) | 18 (100.0%) |
| 5 Years | 0 (0.0%) | 0 (0.0%) |
| 6 to 11 Years | 131 (100.0%) | 189 (100.0%) |
| 12 to 14 Years | 114 (100.0%) | 49 (100.0%) |
| 15 Years | 10 (100.0%) | 0 (0.0%) |
| 16 and 17 Years | 26 (100.0%) | 1 (100.0%) |
| 18 to 24 Years | 40 (100.0%) | 38 (100.0%) |
| 25 to 34 Years | 34 (97.1%) | 157 (100.0%) |
| 35 to 44 Years | 195 (85.5%) | 314 (98.7%) |
| 45 to 54 Years | 122 (94.6%) | 70 (90.9%) |
| 55 to 64 Years | 69 (70.4%) | 147 (93.0%) |
| 65 to 74 Years | 104 (75.4%) | 108 (87.8%) |
| 75 Years and over | 69 (100.0%) | 116 (100.0%) |
| Total | 921 (89.8%) | 1,207 (97.0%) |
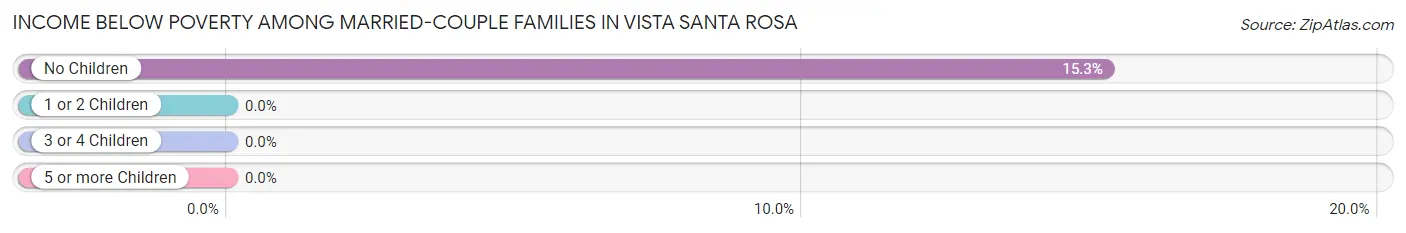
Income Below Poverty Among Married-Couple Families in Vista Santa Rosa
The poverty statistics for married-couple families in Vista Santa Rosa show that 8.0% or 29 of the total 361 families live below the poverty line. Families with no children have the highest poverty rate of 15.3%, comprising of 29 families. On the other hand, families with 1 or 2 children have the lowest poverty rate of 0.0%, which includes 0 families.
| Children | Above Poverty | Below Poverty |
| No Children | 161 (84.7%) | 29 (15.3%) |
| 1 or 2 Children | 90 (100.0%) | 0 (0.0%) |
| 3 or 4 Children | 81 (100.0%) | 0 (0.0%) |
| 5 or more Children | 0 (0.0%) | 0 (0.0%) |
| Total | 332 (92.0%) | 29 (8.0%) |
Income Below Poverty Among Single-Parent Households in Vista Santa Rosa
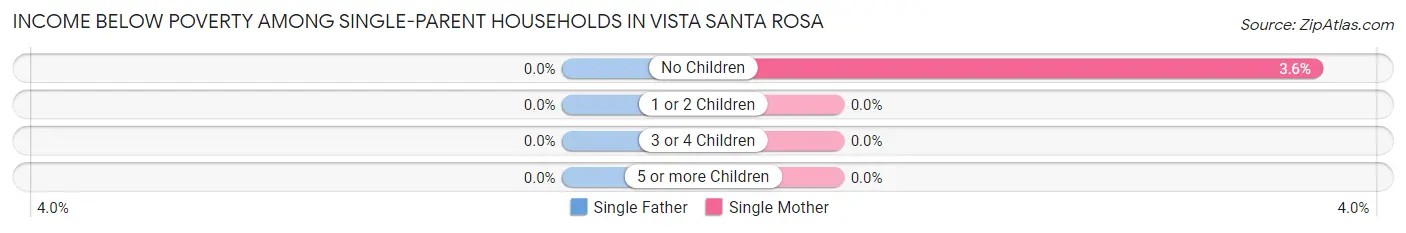
| Children | Single Father | Single Mother |
| No Children | 0 (0.0%) | 2 (3.6%) |
| 1 or 2 Children | 0 (0.0%) | 0 (0.0%) |
| 3 or 4 Children | 0 (0.0%) | 0 (0.0%) |
| 5 or more Children | 0 (0.0%) | 0 (0.0%) |
| Total | 0 (0.0%) | 2 (1.8%) |
Income Below Poverty Among Married-Couple vs Single-Parent Households in Vista Santa Rosa
The poverty data for Vista Santa Rosa shows that 29 of the married-couple family households (8.0%) and 2 of the single-parent households (1.8%) are living below the poverty level. Within the married-couple family households, those with no children have the highest poverty rate, with 29 households (15.3%) falling below the poverty line. Among the single-parent households, those with no children have the highest poverty rate, with 2 household (3.5%) living below poverty.
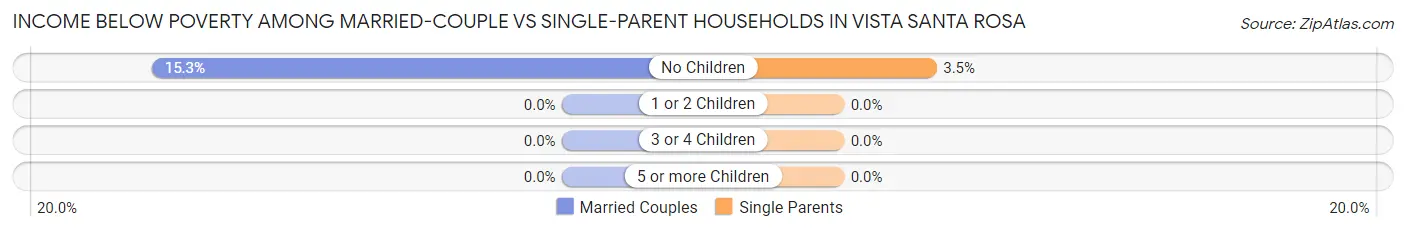
| Children | Married-Couple Families | Single-Parent Households |
| No Children | 29 (15.3%) | 2 (3.5%) |
| 1 or 2 Children | 0 (0.0%) | 0 (0.0%) |
| 3 or 4 Children | 0 (0.0%) | 0 (0.0%) |
| 5 or more Children | 0 (0.0%) | 0 (0.0%) |
| Total | 29 (8.0%) | 2 (1.8%) |
Race in Vista Santa Rosa
The most populous races in Vista Santa Rosa are Hispanic or Latino (1,825 | 80.4%), Some other Race (843 | 37.1%), and Two or more Races (746 | 32.9%).
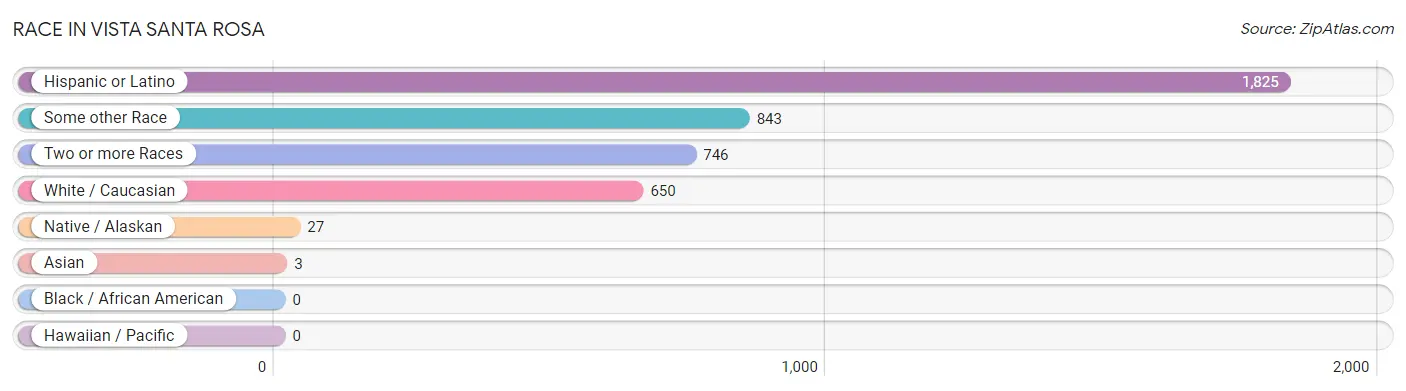
| Race | # Population | % Population |
| Asian | 3 | 0.1% |
| Black / African American | 0 | 0.0% |
| Hawaiian / Pacific | 0 | 0.0% |
| Hispanic or Latino | 1,825 | 80.4% |
| Native / Alaskan | 27 | 1.2% |
| White / Caucasian | 650 | 28.6% |
| Two or more Races | 746 | 32.9% |
| Some other Race | 843 | 37.1% |
| Total | 2,269 | 100.0% |
Ancestry in Vista Santa Rosa
The most populous ancestries reported in Vista Santa Rosa are Mexican (1,806 | 79.6%), German (81 | 3.6%), Swedish (80 | 3.5%), Irish (70 | 3.1%), and English (62 | 2.7%), together accounting for 92.5% of all Vista Santa Rosa residents.
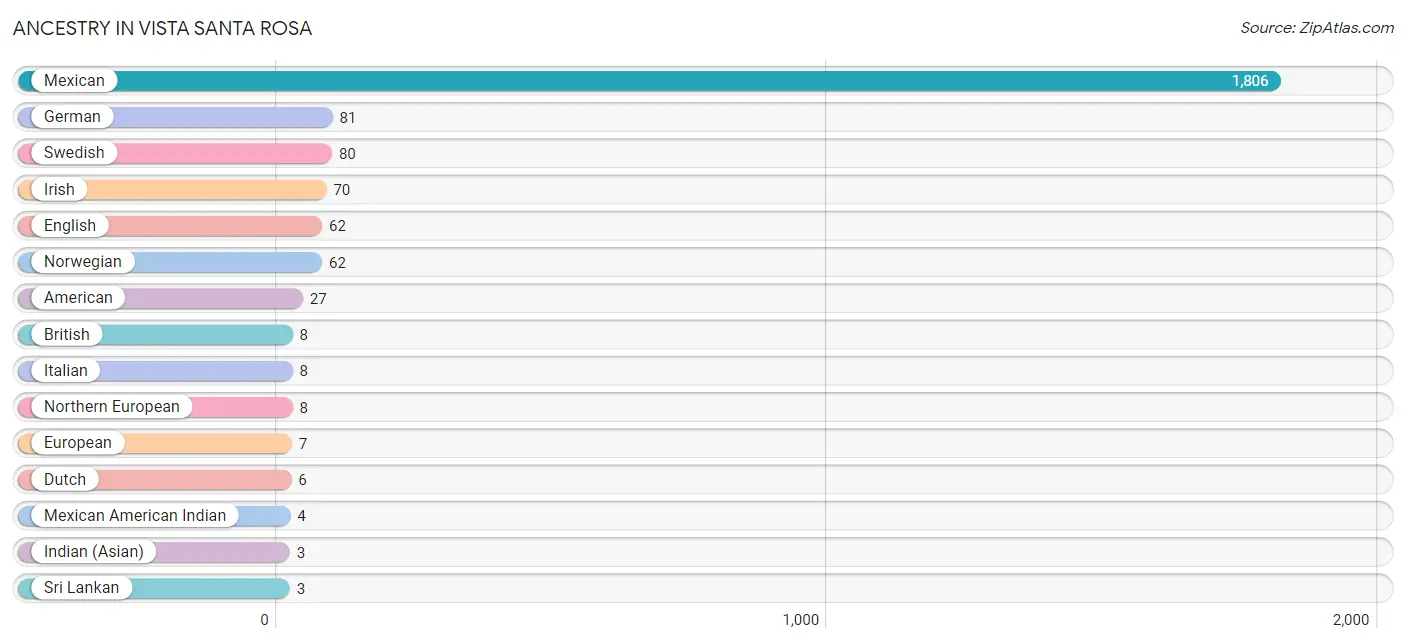
| Ancestry | # Population | % Population |
| American | 27 | 1.2% |
| British | 8 | 0.4% |
| Dutch | 6 | 0.3% |
| English | 62 | 2.7% |
| European | 7 | 0.3% |
| German | 81 | 3.6% |
| Indian (Asian) | 3 | 0.1% |
| Irish | 70 | 3.1% |
| Italian | 8 | 0.4% |
| Mexican | 1,806 | 79.6% |
| Mexican American Indian | 4 | 0.2% |
| Northern European | 8 | 0.4% |
| Norwegian | 62 | 2.7% |
| Sri Lankan | 3 | 0.1% |
| Swedish | 80 | 3.5% | View All 15 Rows |
Immigrants in Vista Santa Rosa
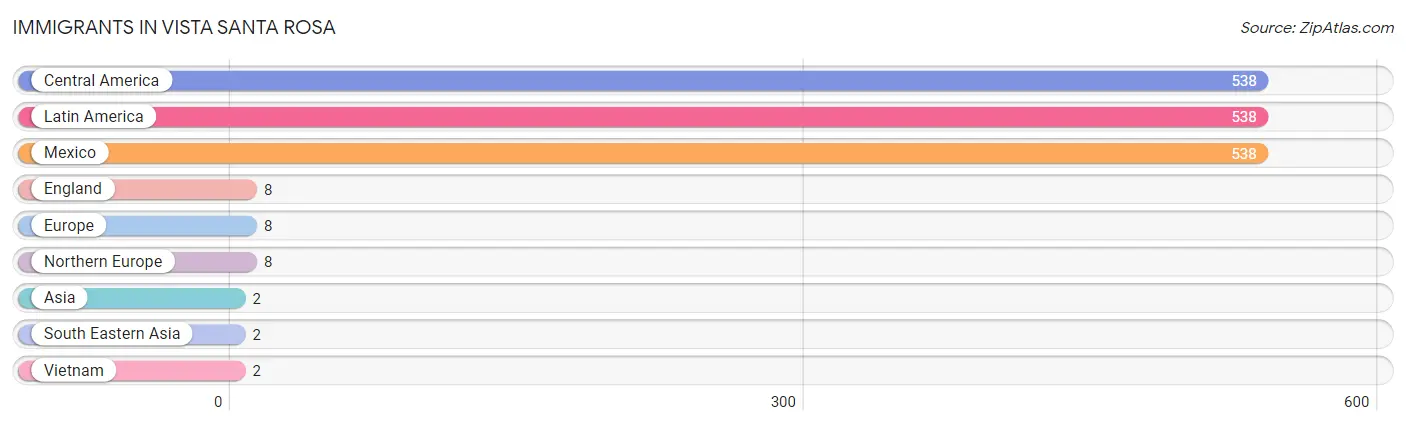
The most numerous immigrant groups reported in Vista Santa Rosa came from Central America (538 | 23.7%), Latin America (538 | 23.7%), Mexico (538 | 23.7%), England (8 | 0.4%), and Europe (8 | 0.4%), together accounting for 71.8% of all Vista Santa Rosa residents.
| Immigration Origin | # Population | % Population |
| Asia | 2 | 0.1% |
| Central America | 538 | 23.7% |
| England | 8 | 0.4% |
| Europe | 8 | 0.4% |
| Latin America | 538 | 23.7% |
| Mexico | 538 | 23.7% |
| Northern Europe | 8 | 0.4% |
| South Eastern Asia | 2 | 0.1% |
| Vietnam | 2 | 0.1% | View All 9 Rows |
Sex and Age in Vista Santa Rosa
Sex and Age in Vista Santa Rosa
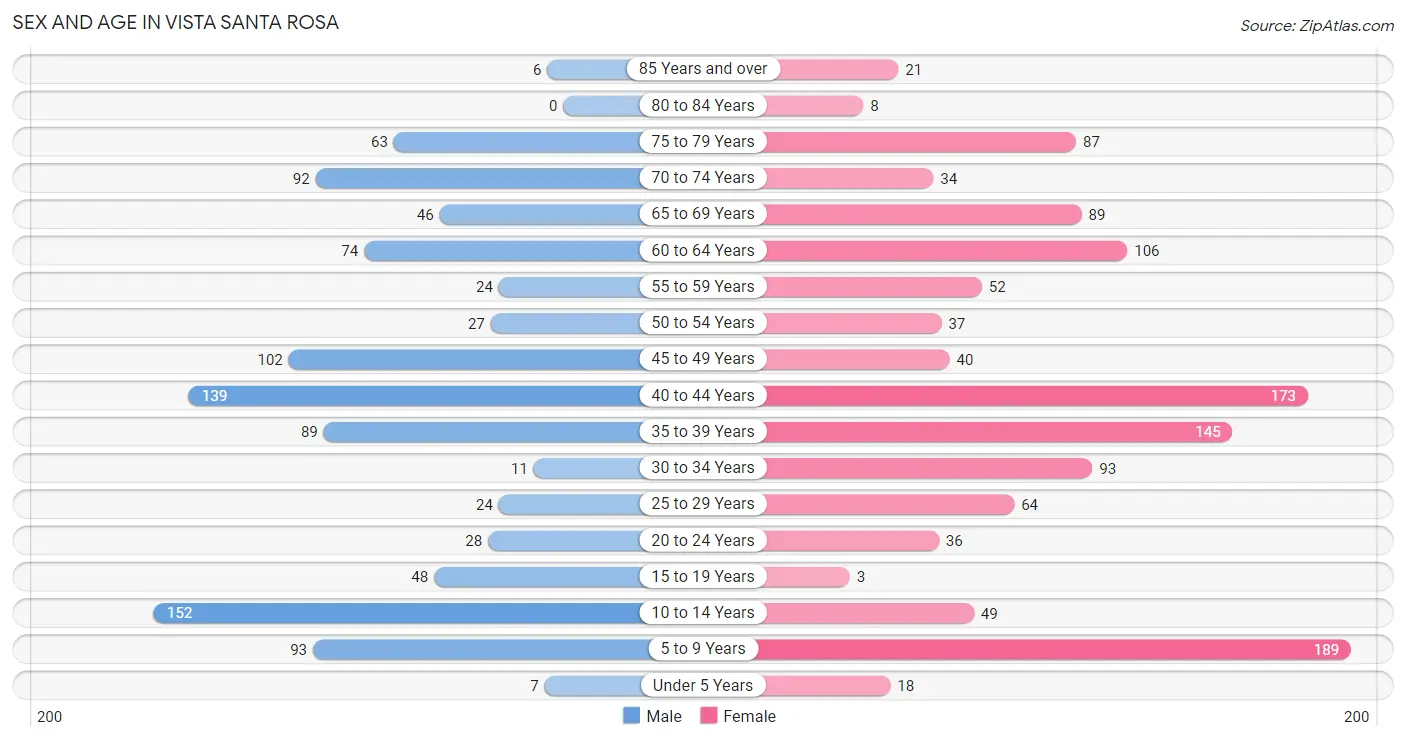
The most populous age groups in Vista Santa Rosa are 10 to 14 Years (152 | 14.8%) for men and 5 to 9 Years (189 | 15.2%) for women.
| Age Bracket | Male | Female |
| Under 5 Years | 7 (0.7%) | 18 (1.5%) |
| 5 to 9 Years | 93 (9.1%) | 189 (15.2%) |
| 10 to 14 Years | 152 (14.8%) | 49 (3.9%) |
| 15 to 19 Years | 48 (4.7%) | 3 (0.2%) |
| 20 to 24 Years | 28 (2.7%) | 36 (2.9%) |
| 25 to 29 Years | 24 (2.3%) | 64 (5.1%) |
| 30 to 34 Years | 11 (1.1%) | 93 (7.5%) |
| 35 to 39 Years | 89 (8.7%) | 145 (11.7%) |
| 40 to 44 Years | 139 (13.6%) | 173 (13.9%) |
| 45 to 49 Years | 102 (10.0%) | 40 (3.2%) |
| 50 to 54 Years | 27 (2.6%) | 37 (3.0%) |
| 55 to 59 Years | 24 (2.3%) | 52 (4.2%) |
| 60 to 64 Years | 74 (7.2%) | 106 (8.5%) |
| 65 to 69 Years | 46 (4.5%) | 89 (7.1%) |
| 70 to 74 Years | 92 (9.0%) | 34 (2.7%) |
| 75 to 79 Years | 63 (6.1%) | 87 (7.0%) |
| 80 to 84 Years | 0 (0.0%) | 8 (0.6%) |
| 85 Years and over | 6 (0.6%) | 21 (1.7%) |
| Total | 1,025 (100.0%) | 1,244 (100.0%) |
Families and Households in Vista Santa Rosa
Median Family Size in Vista Santa Rosa
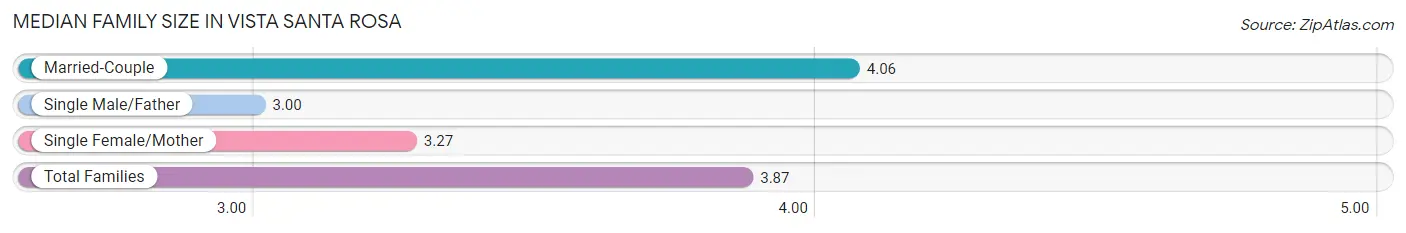
The median family size in Vista Santa Rosa is 3.87 persons per family, with married-couple families (361 | 76.5%) accounting for the largest median family size of 4.06 persons per family. On the other hand, single male/father families (3 | 0.6%) represent the smallest median family size with 3.00 persons per family.
| Family Type | # Families | Family Size |
| Married-Couple | 361 (76.5%) | 4.06 |
| Single Male/Father | 3 (0.6%) | 3.00 |
| Single Female/Mother | 108 (22.9%) | 3.27 |
| Total Families | 472 (100.0%) | 3.87 |
Median Household Size in Vista Santa Rosa
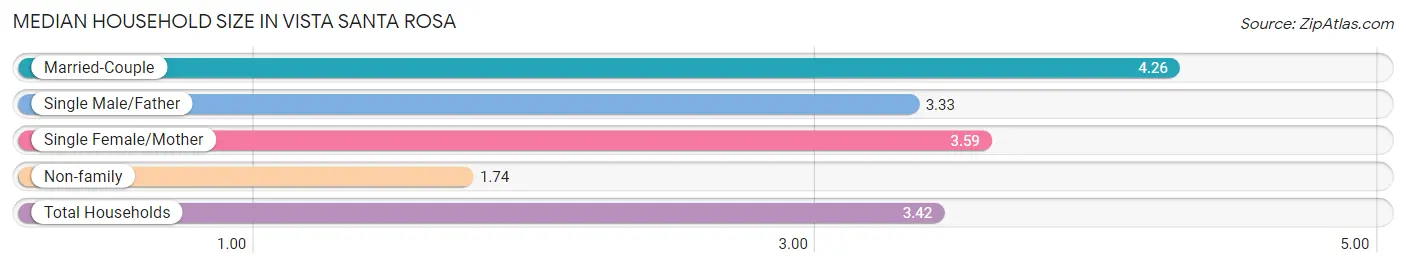
The median household size in Vista Santa Rosa is 3.42 persons per household, with married-couple households (361 | 54.4%) accounting for the largest median household size of 4.26 persons per household. non-family households (192 | 28.9%) represent the smallest median household size with 1.74 persons per household.
| Household Type | # Households | Household Size |
| Married-Couple | 361 (54.4%) | 4.26 |
| Single Male/Father | 3 (0.4%) | 3.33 |
| Single Female/Mother | 108 (16.3%) | 3.59 |
| Non-family | 192 (28.9%) | 1.74 |
| Total Households | 664 (100.0%) | 3.42 |
Household Size by Marriage Status in Vista Santa Rosa
Out of a total of 664 households in Vista Santa Rosa, 472 (71.1%) are family households, while 192 (28.9%) are nonfamily households. The most numerous type of family households are 2-person households, comprising 195, and the most common type of nonfamily households are 1-person households, comprising 145.
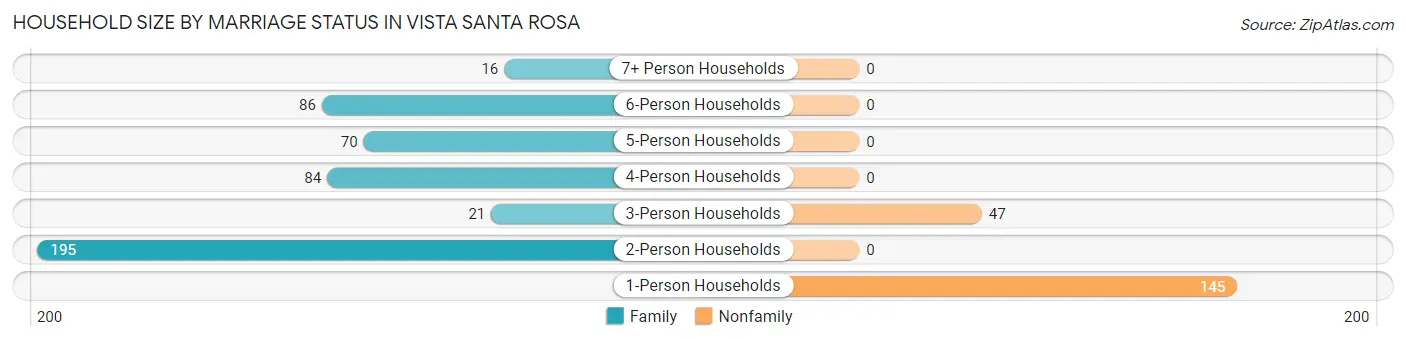
| Household Size | Family Households | Nonfamily Households |
| 1-Person Households | - | 145 (21.8%) |
| 2-Person Households | 195 (29.4%) | 0 (0.0%) |
| 3-Person Households | 21 (3.2%) | 47 (7.1%) |
| 4-Person Households | 84 (12.7%) | 0 (0.0%) |
| 5-Person Households | 70 (10.5%) | 0 (0.0%) |
| 6-Person Households | 86 (13.0%) | 0 (0.0%) |
| 7+ Person Households | 16 (2.4%) | 0 (0.0%) |
| Total | 472 (71.1%) | 192 (28.9%) |
Female Fertility in Vista Santa Rosa
Fertility by Age in Vista Santa Rosa
| Age Bracket | Women with Births | Births / 1,000 Women |
| 15 to 19 years | 0 (0.0%) | 0.0 |
| 20 to 34 years | 0 (0.0%) | 0.0 |
| 35 to 50 years | 0 (0.0%) | 0.0 |
| Total | 0 (0.0%) | 0.0 |
Fertility by Age by Marriage Status in Vista Santa Rosa
| Age Bracket | Married | Unmarried |
| 15 to 19 years | 0 (0.0%) | 0 (0.0%) |
| 20 to 34 years | 0 (0.0%) | 0 (0.0%) |
| 35 to 50 years | 0 (0.0%) | 0 (0.0%) |
| Total | 0 (0.0%) | 0 (0.0%) |
Fertility by Education in Vista Santa Rosa
| Educational Attainment | Women with Births | Births / 1,000 Women |
| Less than High School | 0 (0.0%) | 0.0 |
| High School Diploma | 0 (0.0%) | 0.0 |
| College or Associate's Degree | 0 (0.0%) | 0.0 |
| Bachelor's Degree | 0 (0.0%) | 0.0 |
| Graduate Degree | 0 (0.0%) | 0.0 |
| Total | 0 (0.0%) | 0.0 |
Fertility by Education by Marriage Status in Vista Santa Rosa
| Educational Attainment | Married | Unmarried |
| Less than High School | 0 (0.0%) | 0 (0.0%) |
| High School Diploma | 0 (0.0%) | 0 (0.0%) |
| College or Associate's Degree | 0 (0.0%) | 0 (0.0%) |
| Bachelor's Degree | 0 (0.0%) | 0 (0.0%) |
| Graduate Degree | 0 (0.0%) | 0 (0.0%) |
| Total | 0 (0.0%) | 0 (0.0%) |
Employment Characteristics in Vista Santa Rosa
Employment by Class of Employer in Vista Santa Rosa
Among the 1,021 employed individuals in Vista Santa Rosa, private company employees (661 | 64.7%), state government employees (106 | 10.4%), and self-employed (not incorporated) (87 | 8.5%) make up the most common classes of employment.
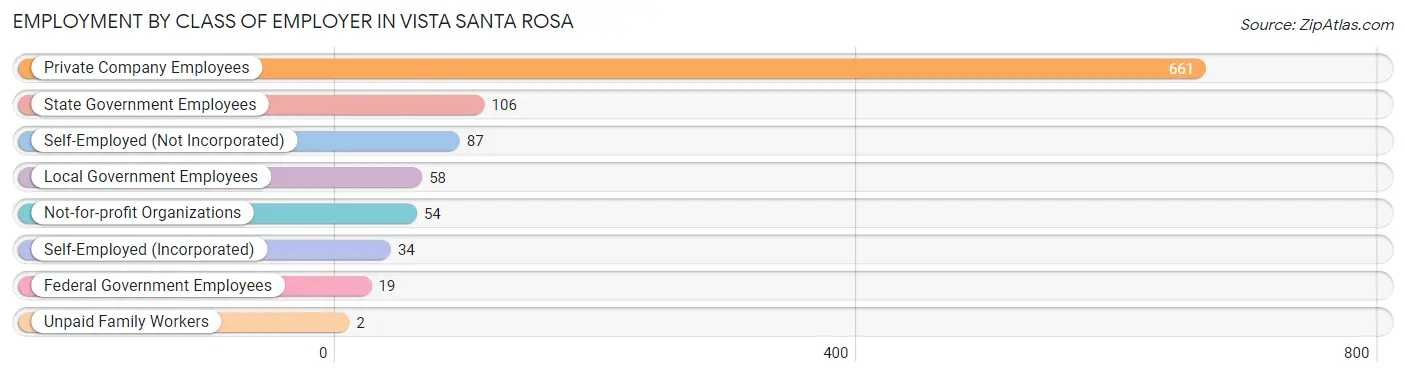
| Employer Class | # Employees | % Employees |
| Private Company Employees | 661 | 64.7% |
| Self-Employed (Incorporated) | 34 | 3.3% |
| Self-Employed (Not Incorporated) | 87 | 8.5% |
| Not-for-profit Organizations | 54 | 5.3% |
| Local Government Employees | 58 | 5.7% |
| State Government Employees | 106 | 10.4% |
| Federal Government Employees | 19 | 1.9% |
| Unpaid Family Workers | 2 | 0.2% |
| Total | 1,021 | 100.0% |
Employment Status by Age in Vista Santa Rosa
According to the labor force statistics for Vista Santa Rosa, out of the total population over 16 years of age (1,751), 64.0% or 1,121 individuals are in the labor force, with 6.0% or 67 of them unemployed. The age group with the highest labor force participation rate is 30 to 34 years, with 100.0% or 104 individuals in the labor force. Within the labor force, the 65 to 74 years age range has the highest percentage of unemployed individuals, with 48.1% or 50 of them being unemployed.
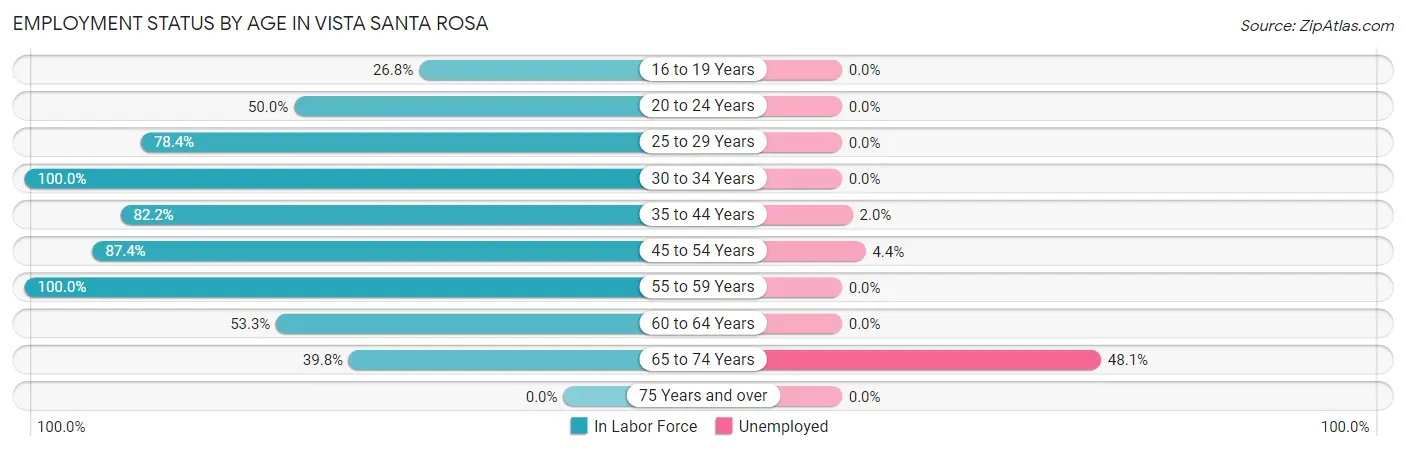
| Age Bracket | In Labor Force | Unemployed |
| 16 to 19 Years | 11 (26.8%) | 0 (0.0%) |
| 20 to 24 Years | 32 (50.0%) | 0 (0.0%) |
| 25 to 29 Years | 69 (78.4%) | 0 (0.0%) |
| 30 to 34 Years | 104 (100.0%) | 0 (0.0%) |
| 35 to 44 Years | 449 (82.2%) | 9 (2.0%) |
| 45 to 54 Years | 180 (87.4%) | 8 (4.4%) |
| 55 to 59 Years | 76 (100.0%) | 0 (0.0%) |
| 60 to 64 Years | 96 (53.3%) | 0 (0.0%) |
| 65 to 74 Years | 104 (39.8%) | 50 (48.1%) |
| 75 Years and over | 0 (0.0%) | 0 (0.0%) |
| Total | 1,121 (64.0%) | 67 (6.0%) |
Employment Status by Educational Attainment in Vista Santa Rosa
According to labor force statistics for Vista Santa Rosa, 81.2% of individuals (974) out of the total population between 25 and 64 years of age (1,200) are in the labor force, with 1.7% or 17 of them being unemployed. The group with the highest labor force participation rate are those with the educational attainment of bachelor's degree or higher, with 95.4% or 187 individuals in the labor force. Within the labor force, individuals with high school diploma education have the highest percentage of unemployment, with 3.2% or 9 of them being unemployed.
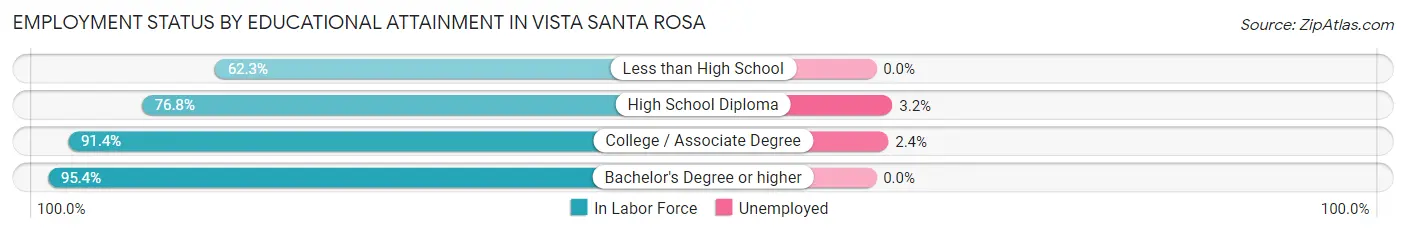
| Educational Attainment | In Labor Force | Unemployed |
| Less than High School | 165 (62.3%) | 0 (0.0%) |
| High School Diploma | 282 (76.8%) | 12 (3.2%) |
| College / Associate Degree | 340 (91.4%) | 9 (2.4%) |
| Bachelor's Degree or higher | 187 (95.4%) | 0 (0.0%) |
| Total | 974 (81.2%) | 20 (1.7%) |
Employment Occupations by Sex in Vista Santa Rosa
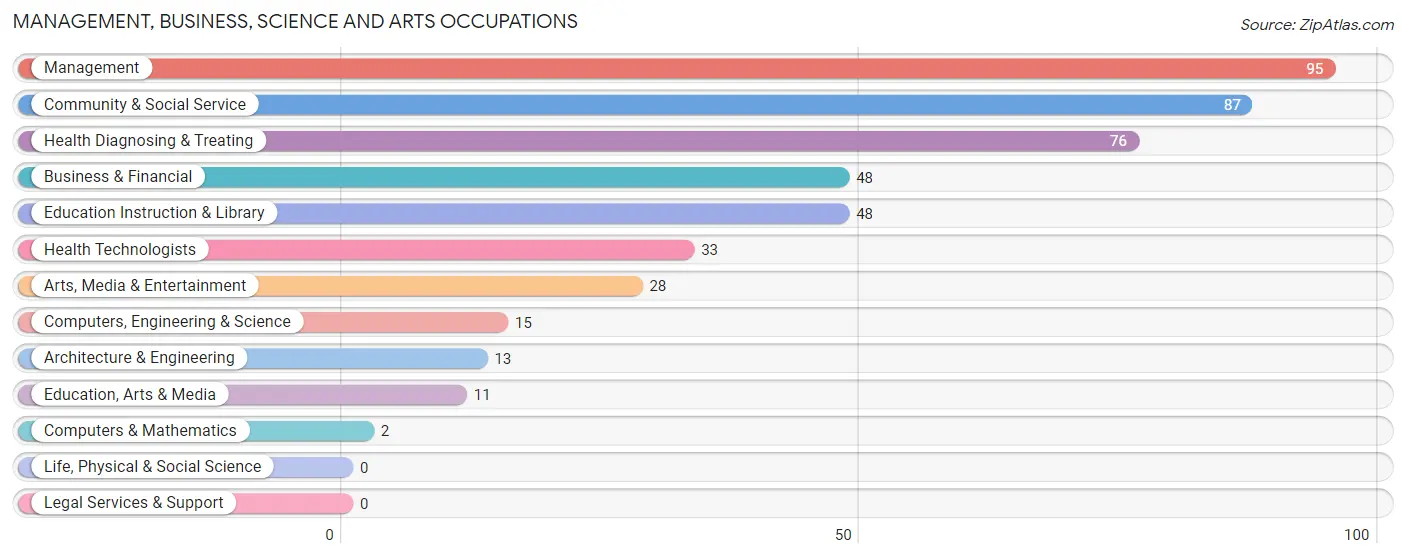
Management, Business, Science and Arts Occupations
The most common Management, Business, Science and Arts occupations in Vista Santa Rosa are Management (95 | 9.0%), Community & Social Service (87 | 8.3%), Health Diagnosing & Treating (76 | 7.2%), Business & Financial (48 | 4.5%), and Education Instruction & Library (48 | 4.5%).
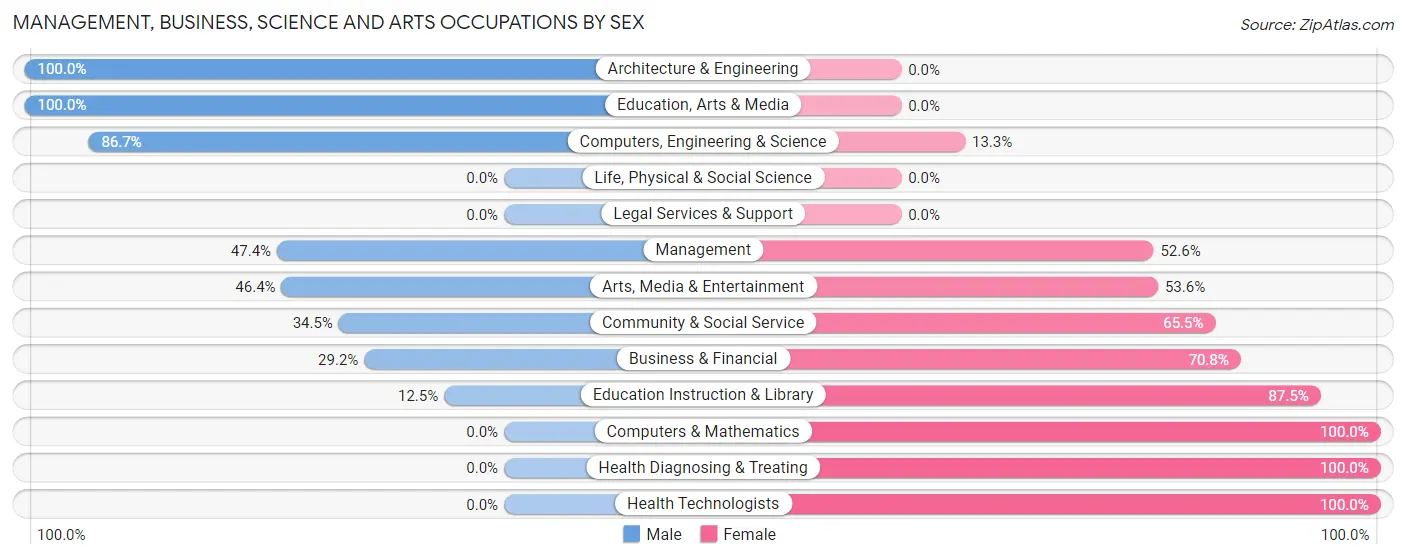
Management, Business, Science and Arts Occupations by Sex
Within the Management, Business, Science and Arts occupations in Vista Santa Rosa, the most male-oriented occupations are Architecture & Engineering (100.0%), Education, Arts & Media (100.0%), and Computers, Engineering & Science (86.7%), while the most female-oriented occupations are Computers & Mathematics (100.0%), Health Diagnosing & Treating (100.0%), and Health Technologists (100.0%).
| Occupation | Male | Female |
| Management | 45 (47.4%) | 50 (52.6%) |
| Business & Financial | 14 (29.2%) | 34 (70.8%) |
| Computers, Engineering & Science | 13 (86.7%) | 2 (13.3%) |
| Computers & Mathematics | 0 (0.0%) | 2 (100.0%) |
| Architecture & Engineering | 13 (100.0%) | 0 (0.0%) |
| Life, Physical & Social Science | 0 (0.0%) | 0 (0.0%) |
| Community & Social Service | 30 (34.5%) | 57 (65.5%) |
| Education, Arts & Media | 11 (100.0%) | 0 (0.0%) |
| Legal Services & Support | 0 (0.0%) | 0 (0.0%) |
| Education Instruction & Library | 6 (12.5%) | 42 (87.5%) |
| Arts, Media & Entertainment | 13 (46.4%) | 15 (53.6%) |
| Health Diagnosing & Treating | 0 (0.0%) | 76 (100.0%) |
| Health Technologists | 0 (0.0%) | 33 (100.0%) |
| Total (Category) | 102 (31.8%) | 219 (68.2%) |
| Total (Overall) | 435 (41.3%) | 619 (58.7%) |
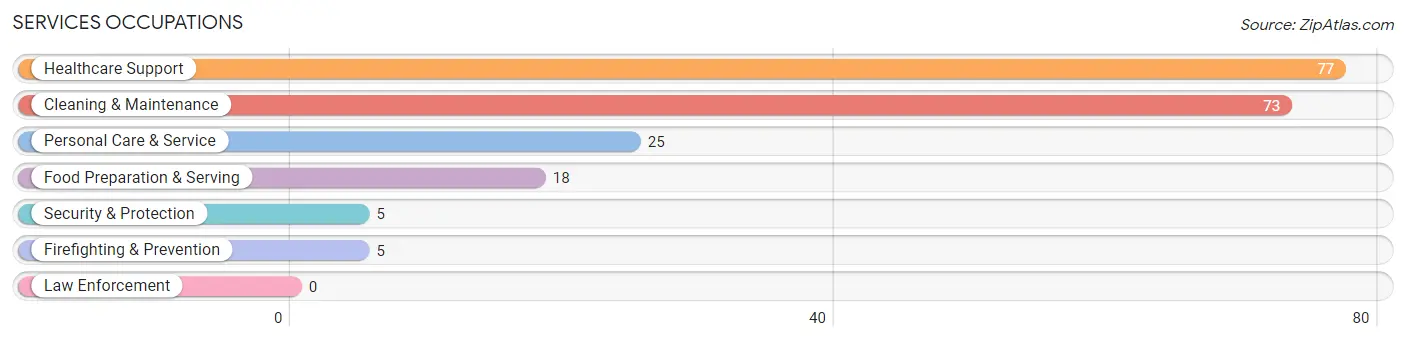
Services Occupations
The most common Services occupations in Vista Santa Rosa are Healthcare Support (77 | 7.3%), Cleaning & Maintenance (73 | 6.9%), Personal Care & Service (25 | 2.4%), Food Preparation & Serving (18 | 1.7%), and Security & Protection (5 | 0.5%).
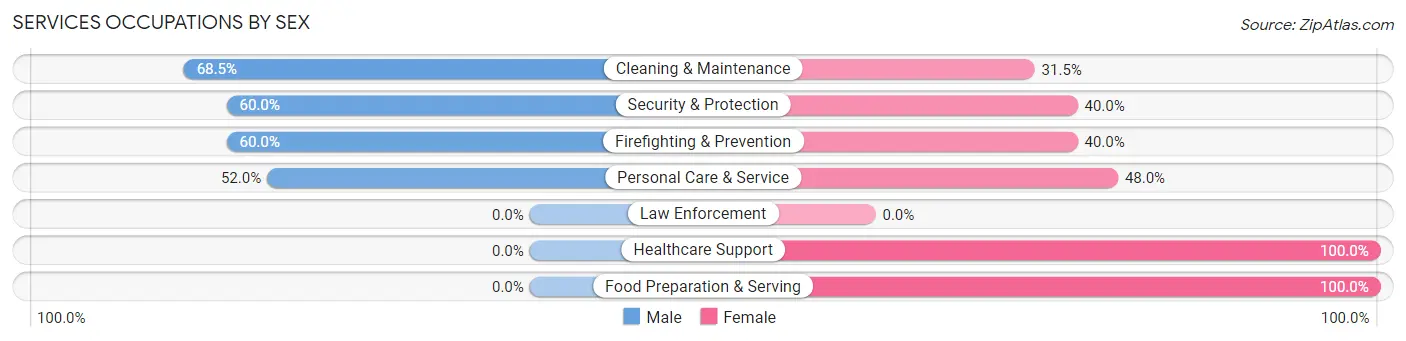
Services Occupations by Sex
Within the Services occupations in Vista Santa Rosa, the most male-oriented occupations are Cleaning & Maintenance (68.5%), Security & Protection (60.0%), and Firefighting & Prevention (60.0%), while the most female-oriented occupations are Healthcare Support (100.0%), Food Preparation & Serving (100.0%), and Personal Care & Service (48.0%).
| Occupation | Male | Female |
| Healthcare Support | 0 (0.0%) | 77 (100.0%) |
| Security & Protection | 3 (60.0%) | 2 (40.0%) |
| Firefighting & Prevention | 3 (60.0%) | 2 (40.0%) |
| Law Enforcement | 0 (0.0%) | 0 (0.0%) |
| Food Preparation & Serving | 0 (0.0%) | 18 (100.0%) |
| Cleaning & Maintenance | 50 (68.5%) | 23 (31.5%) |
| Personal Care & Service | 13 (52.0%) | 12 (48.0%) |
| Total (Category) | 66 (33.3%) | 132 (66.7%) |
| Total (Overall) | 435 (41.3%) | 619 (58.7%) |
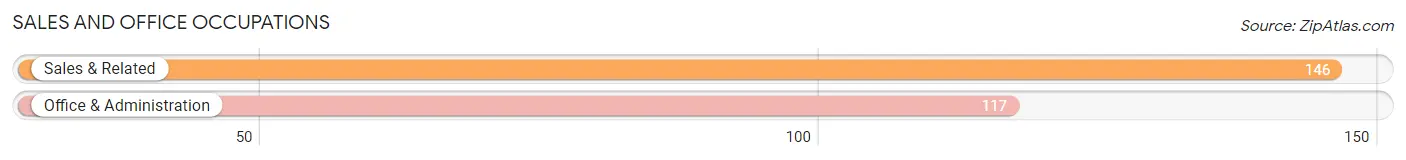
Sales and Office Occupations
The most common Sales and Office occupations in Vista Santa Rosa are Sales & Related (146 | 13.9%), and Office & Administration (117 | 11.1%).
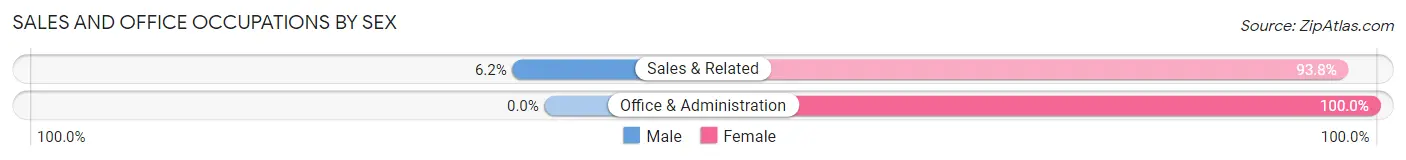
Sales and Office Occupations by Sex
| Occupation | Male | Female |
| Sales & Related | 9 (6.2%) | 137 (93.8%) |
| Office & Administration | 0 (0.0%) | 117 (100.0%) |
| Total (Category) | 9 (3.4%) | 254 (96.6%) |
| Total (Overall) | 435 (41.3%) | 619 (58.7%) |
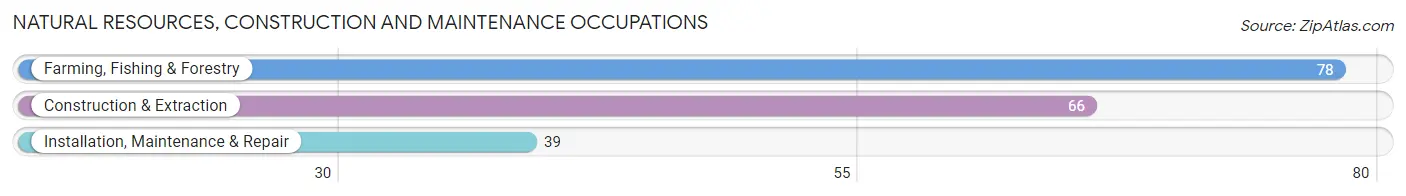
Natural Resources, Construction and Maintenance Occupations
The most common Natural Resources, Construction and Maintenance occupations in Vista Santa Rosa are Farming, Fishing & Forestry (78 | 7.4%), Construction & Extraction (66 | 6.3%), and Installation, Maintenance & Repair (39 | 3.7%).
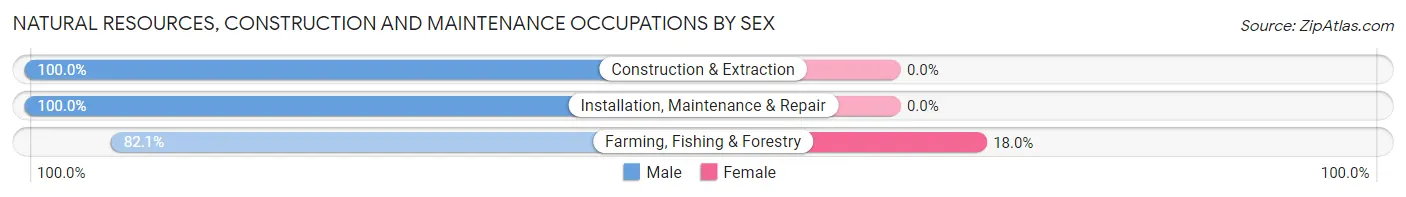
Natural Resources, Construction and Maintenance Occupations by Sex
| Occupation | Male | Female |
| Farming, Fishing & Forestry | 64 (82.1%) | 14 (17.9%) |
| Construction & Extraction | 66 (100.0%) | 0 (0.0%) |
| Installation, Maintenance & Repair | 39 (100.0%) | 0 (0.0%) |
| Total (Category) | 169 (92.3%) | 14 (7.6%) |
| Total (Overall) | 435 (41.3%) | 619 (58.7%) |
Production, Transportation and Moving Occupations
The most common Production, Transportation and Moving occupations in Vista Santa Rosa are Transportation (76 | 7.2%), and Material Moving (13 | 1.2%).
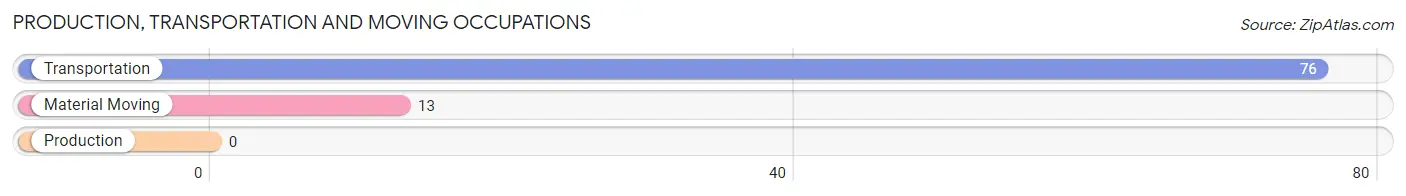
Production, Transportation and Moving Occupations by Sex
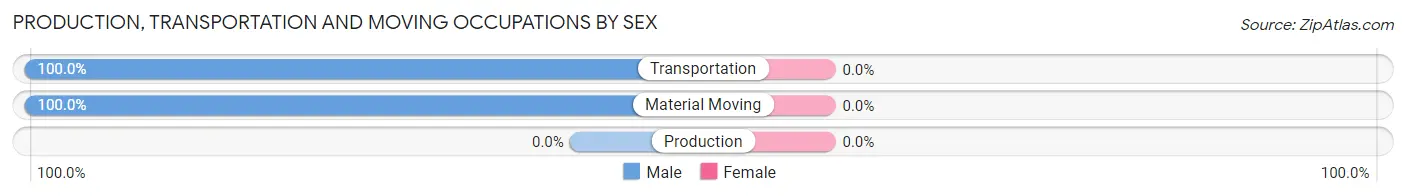
| Occupation | Male | Female |
| Production | 0 (0.0%) | 0 (0.0%) |
| Transportation | 76 (100.0%) | 0 (0.0%) |
| Material Moving | 13 (100.0%) | 0 (0.0%) |
| Total (Category) | 89 (100.0%) | 0 (0.0%) |
| Total (Overall) | 435 (41.3%) | 619 (58.7%) |
Employment Industries by Sex in Vista Santa Rosa
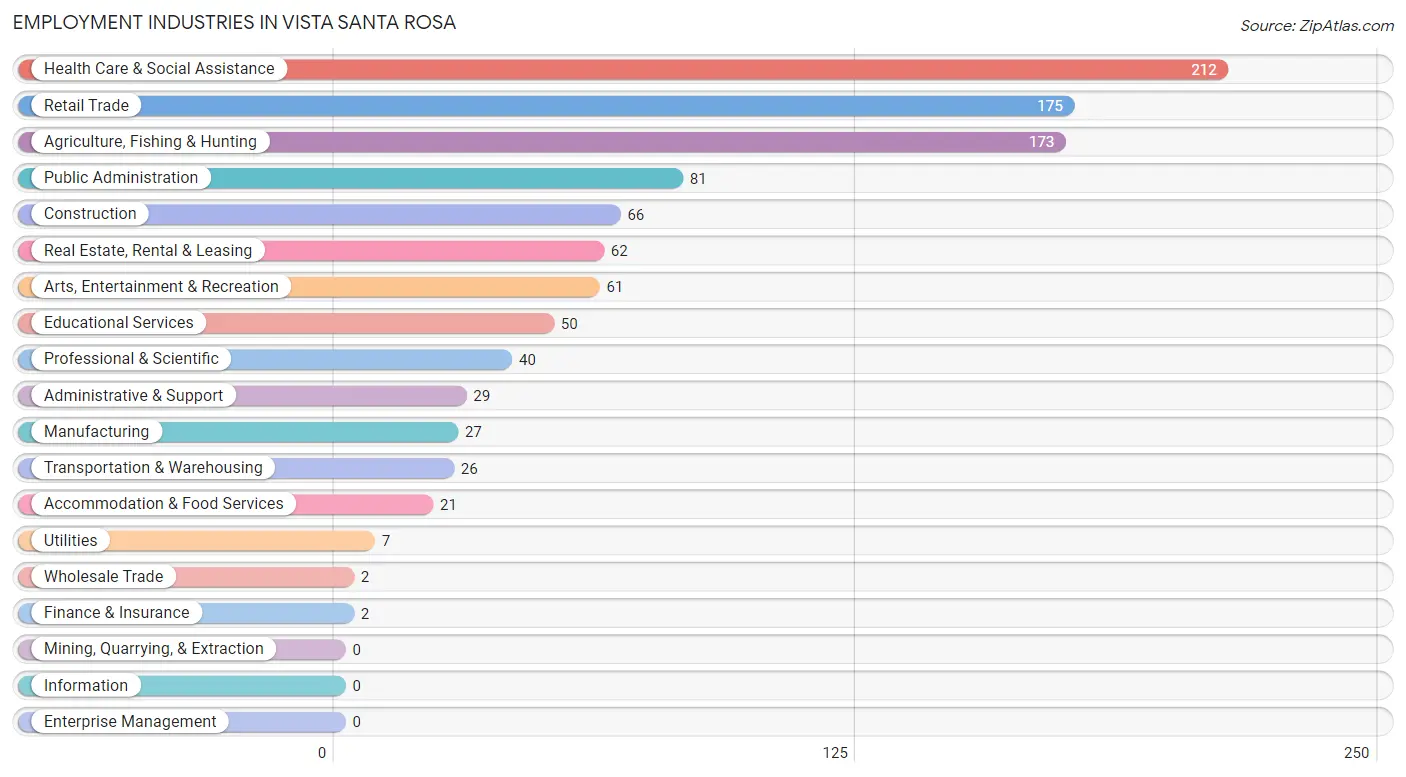
Employment Industries in Vista Santa Rosa
The major employment industries in Vista Santa Rosa include Health Care & Social Assistance (212 | 20.1%), Retail Trade (175 | 16.6%), Agriculture, Fishing & Hunting (173 | 16.4%), Public Administration (81 | 7.7%), and Construction (66 | 6.3%).
Employment Industries by Sex in Vista Santa Rosa
The Vista Santa Rosa industries that see more men than women are Construction (100.0%), Manufacturing (100.0%), and Wholesale Trade (100.0%), whereas the industries that tend to have a higher number of women are Finance & Insurance (100.0%), Real Estate, Rental & Leasing (100.0%), and Professional & Scientific (100.0%).
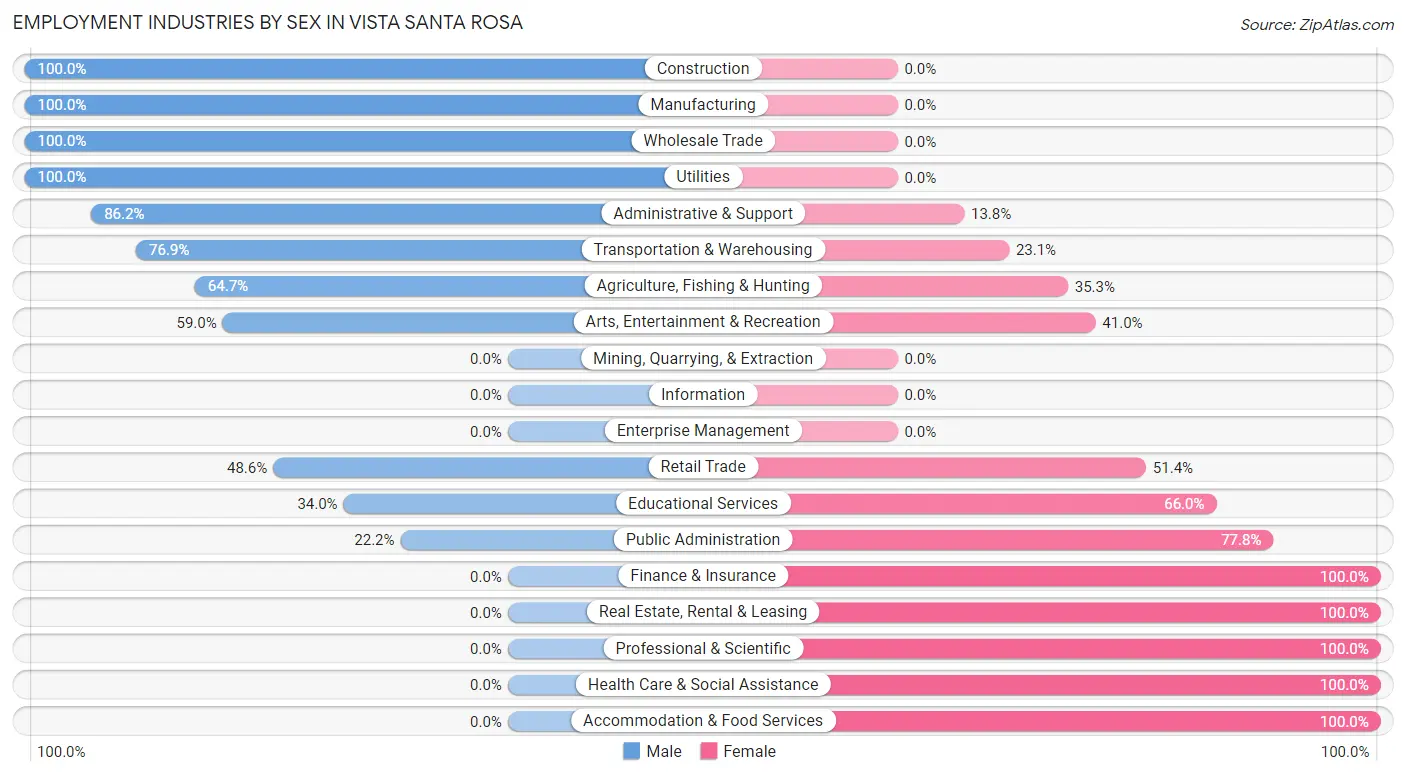
| Industry | Male | Female |
| Agriculture, Fishing & Hunting | 112 (64.7%) | 61 (35.3%) |
| Mining, Quarrying, & Extraction | 0 (0.0%) | 0 (0.0%) |
| Construction | 66 (100.0%) | 0 (0.0%) |
| Manufacturing | 27 (100.0%) | 0 (0.0%) |
| Wholesale Trade | 2 (100.0%) | 0 (0.0%) |
| Retail Trade | 85 (48.6%) | 90 (51.4%) |
| Transportation & Warehousing | 20 (76.9%) | 6 (23.1%) |
| Utilities | 7 (100.0%) | 0 (0.0%) |
| Information | 0 (0.0%) | 0 (0.0%) |
| Finance & Insurance | 0 (0.0%) | 2 (100.0%) |
| Real Estate, Rental & Leasing | 0 (0.0%) | 62 (100.0%) |
| Professional & Scientific | 0 (0.0%) | 40 (100.0%) |
| Enterprise Management | 0 (0.0%) | 0 (0.0%) |
| Administrative & Support | 25 (86.2%) | 4 (13.8%) |
| Educational Services | 17 (34.0%) | 33 (66.0%) |
| Health Care & Social Assistance | 0 (0.0%) | 212 (100.0%) |
| Arts, Entertainment & Recreation | 36 (59.0%) | 25 (41.0%) |
| Accommodation & Food Services | 0 (0.0%) | 21 (100.0%) |
| Public Administration | 18 (22.2%) | 63 (77.8%) |
| Total | 435 (41.3%) | 619 (58.7%) |
Education in Vista Santa Rosa
School Enrollment in Vista Santa Rosa
The most common levels of schooling among the 617 students in Vista Santa Rosa are elementary school (263 | 42.6%), high school (175 | 28.4%), and middle school (108 | 17.5%).
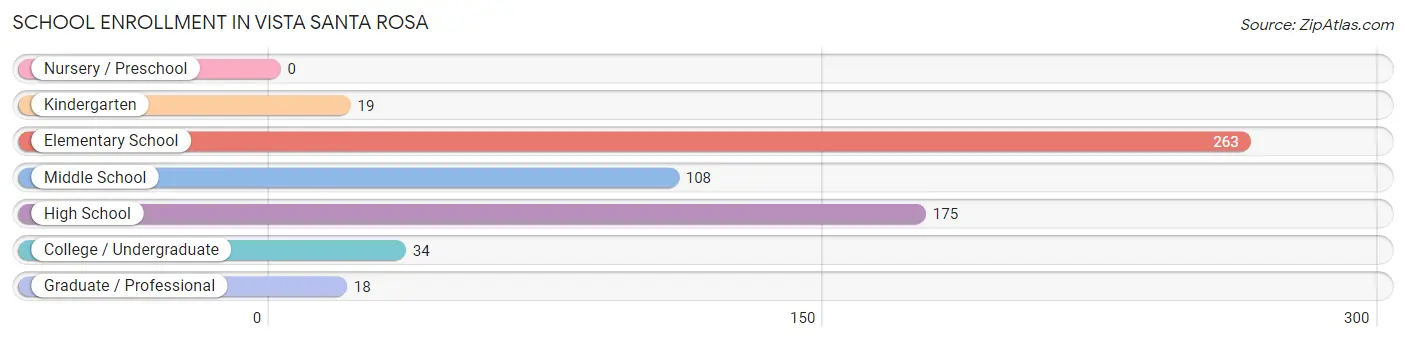
| School Level | # Students | % Students |
| Nursery / Preschool | 0 | 0.0% |
| Kindergarten | 19 | 3.1% |
| Elementary School | 263 | 42.6% |
| Middle School | 108 | 17.5% |
| High School | 175 | 28.4% |
| College / Undergraduate | 34 | 5.5% |
| Graduate / Professional | 18 | 2.9% |
| Total | 617 | 100.0% |
School Enrollment by Age by Funding Source in Vista Santa Rosa
Out of a total of 617 students who are enrolled in schools in Vista Santa Rosa, 47 (7.6%) attend a private institution, while the remaining 570 (92.4%) are enrolled in public schools. The age group of 35 years and over has the highest likelihood of being enrolled in private schools, with 34 (100.0% in the age bracket) enrolled. Conversely, the age group of 5 to 9 year old has the lowest likelihood of being enrolled in a private school, with 282 (100.0% in the age bracket) attending a public institution.
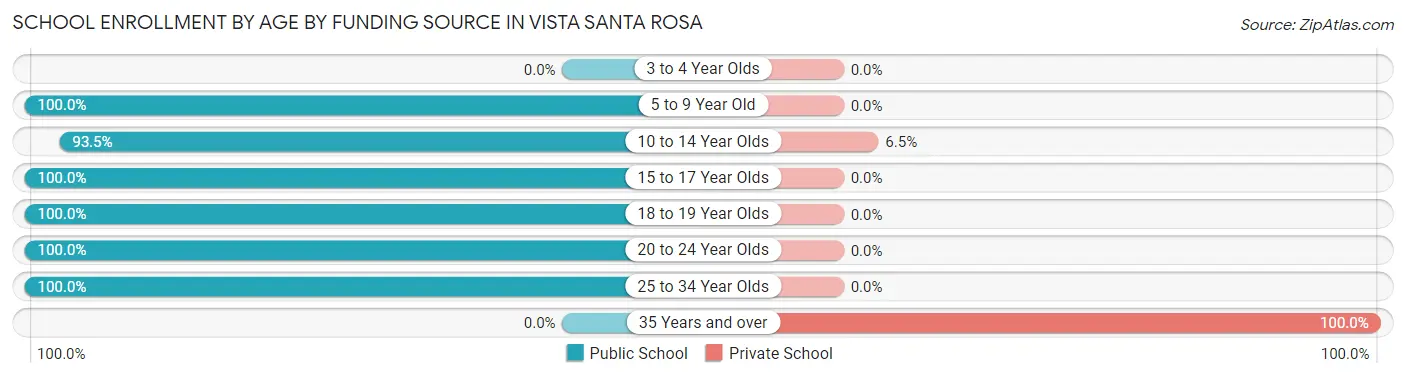
| Age Bracket | Public School | Private School |
| 3 to 4 Year Olds | 0 (0.0%) | 0 (0.0%) |
| 5 to 9 Year Old | 282 (100.0%) | 0 (0.0%) |
| 10 to 14 Year Olds | 188 (93.5%) | 13 (6.5%) |
| 15 to 17 Year Olds | 37 (100.0%) | 0 (0.0%) |
| 18 to 19 Year Olds | 11 (100.0%) | 0 (0.0%) |
| 20 to 24 Year Olds | 48 (100.0%) | 0 (0.0%) |
| 25 to 34 Year Olds | 4 (100.0%) | 0 (0.0%) |
| 35 Years and over | 0 (0.0%) | 34 (100.0%) |
| Total | 570 (92.4%) | 47 (7.6%) |
Educational Attainment by Field of Study in Vista Santa Rosa
Business (59 | 23.1%), literature & languages (50 | 19.5%), education (44 | 17.2%), social sciences (38 | 14.8%), and bio, nature & agricultural (24 | 9.4%) are the most common fields of study among 256 individuals in Vista Santa Rosa who have obtained a bachelor's degree or higher.
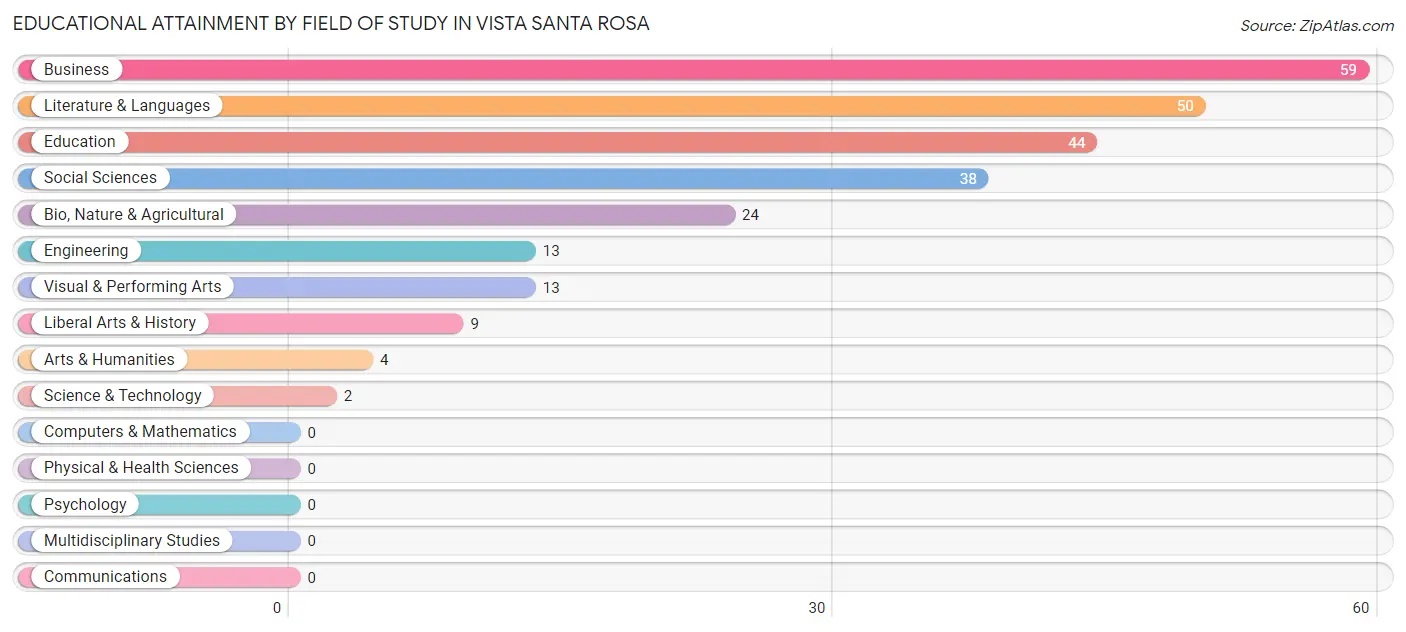
| Field of Study | # Graduates | % Graduates |
| Computers & Mathematics | 0 | 0.0% |
| Bio, Nature & Agricultural | 24 | 9.4% |
| Physical & Health Sciences | 0 | 0.0% |
| Psychology | 0 | 0.0% |
| Social Sciences | 38 | 14.8% |
| Engineering | 13 | 5.1% |
| Multidisciplinary Studies | 0 | 0.0% |
| Science & Technology | 2 | 0.8% |
| Business | 59 | 23.1% |
| Education | 44 | 17.2% |
| Literature & Languages | 50 | 19.5% |
| Liberal Arts & History | 9 | 3.5% |
| Visual & Performing Arts | 13 | 5.1% |
| Communications | 0 | 0.0% |
| Arts & Humanities | 4 | 1.6% |
| Total | 256 | 100.0% |
Transportation & Commute in Vista Santa Rosa
Vehicle Availability by Sex in Vista Santa Rosa
The most prevalent vehicle ownership categories in Vista Santa Rosa are males with 2 vehicles (176, accounting for 40.5%) and females with 2 vehicles (189, making up 30.0%).
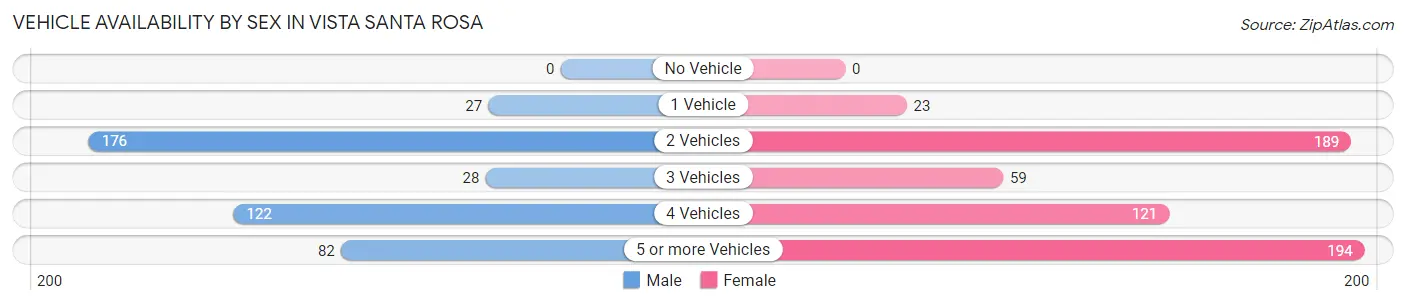
| Vehicles Available | Male | Female |
| No Vehicle | 0 (0.0%) | 0 (0.0%) |
| 1 Vehicle | 27 (6.2%) | 23 (3.9%) |
| 2 Vehicles | 176 (40.5%) | 189 (32.3%) |
| 3 Vehicles | 28 (6.4%) | 59 (10.1%) |
| 4 Vehicles | 122 (28.1%) | 121 (20.6%) |
| 5 or more Vehicles | 82 (18.9%) | 194 (33.1%) |
| Total | 435 (100.0%) | 586 (100.0%) |
Commute Time in Vista Santa Rosa
The most frequently occuring commute durations in Vista Santa Rosa are 15 to 19 minutes (195 commuters, 19.3%), 20 to 24 minutes (181 commuters, 17.9%), and 40 to 44 minutes (155 commuters, 15.4%).
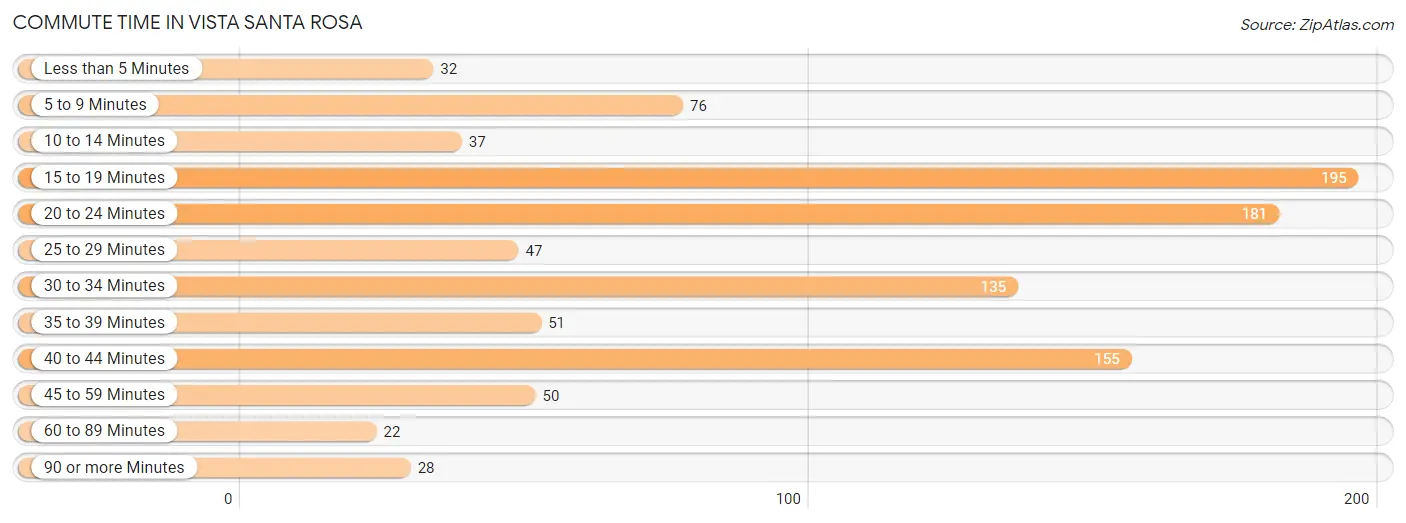
| Commute Time | # Commuters | % Commuters |
| Less than 5 Minutes | 32 | 3.2% |
| 5 to 9 Minutes | 76 | 7.5% |
| 10 to 14 Minutes | 37 | 3.7% |
| 15 to 19 Minutes | 195 | 19.3% |
| 20 to 24 Minutes | 181 | 17.9% |
| 25 to 29 Minutes | 47 | 4.7% |
| 30 to 34 Minutes | 135 | 13.4% |
| 35 to 39 Minutes | 51 | 5.1% |
| 40 to 44 Minutes | 155 | 15.4% |
| 45 to 59 Minutes | 50 | 5.0% |
| 60 to 89 Minutes | 22 | 2.2% |
| 90 or more Minutes | 28 | 2.8% |
Commute Time by Sex in Vista Santa Rosa
The most common commute times in Vista Santa Rosa are 30 to 34 minutes (101 commuters, 23.7%) for males and 15 to 19 minutes (130 commuters, 22.3%) for females.
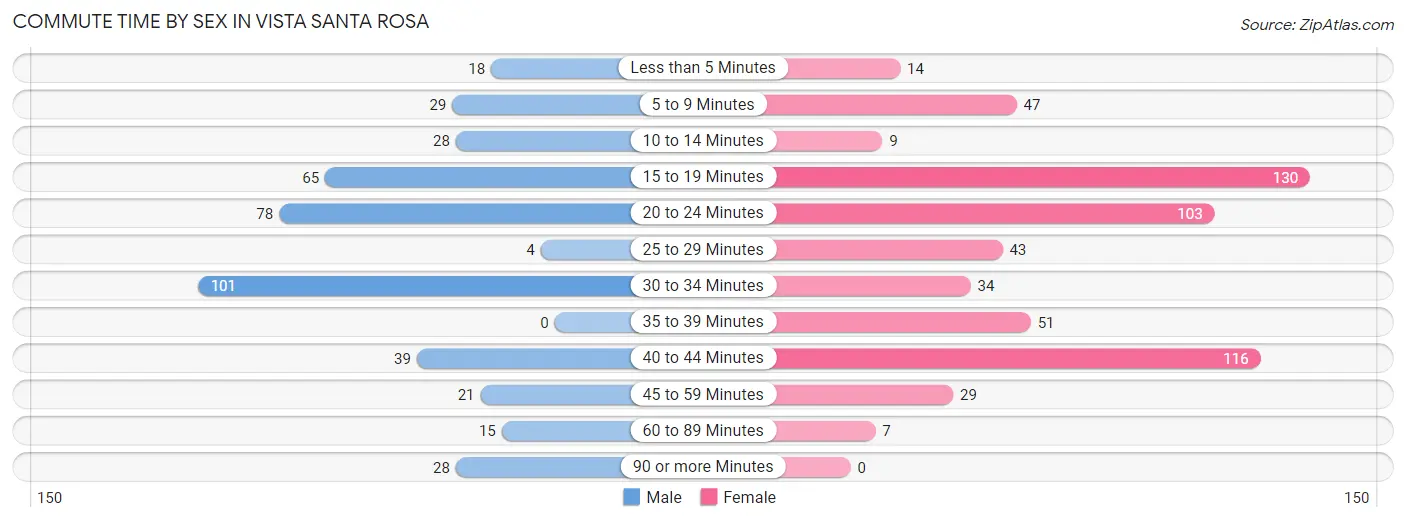
| Commute Time | Male | Female |
| Less than 5 Minutes | 18 (4.2%) | 14 (2.4%) |
| 5 to 9 Minutes | 29 (6.8%) | 47 (8.1%) |
| 10 to 14 Minutes | 28 (6.6%) | 9 (1.5%) |
| 15 to 19 Minutes | 65 (15.3%) | 130 (22.3%) |
| 20 to 24 Minutes | 78 (18.3%) | 103 (17.7%) |
| 25 to 29 Minutes | 4 (0.9%) | 43 (7.4%) |
| 30 to 34 Minutes | 101 (23.7%) | 34 (5.8%) |
| 35 to 39 Minutes | 0 (0.0%) | 51 (8.7%) |
| 40 to 44 Minutes | 39 (9.1%) | 116 (19.9%) |
| 45 to 59 Minutes | 21 (4.9%) | 29 (5.0%) |
| 60 to 89 Minutes | 15 (3.5%) | 7 (1.2%) |
| 90 or more Minutes | 28 (6.6%) | 0 (0.0%) |
Time of Departure to Work by Sex in Vista Santa Rosa
The most frequent times of departure to work in Vista Santa Rosa are 6:30 AM to 6:59 AM (94, 22.1%) for males and 7:00 AM to 7:29 AM (131, 22.5%) for females.
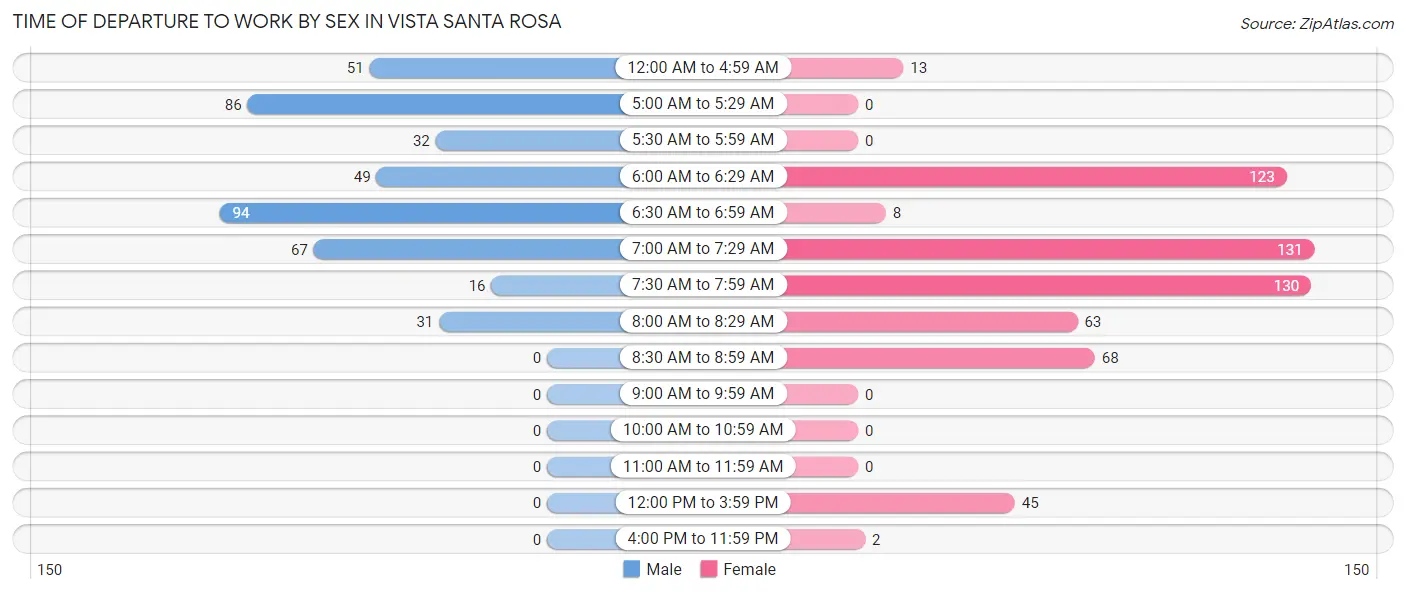
| Time of Departure | Male | Female |
| 12:00 AM to 4:59 AM | 51 (12.0%) | 13 (2.2%) |
| 5:00 AM to 5:29 AM | 86 (20.2%) | 0 (0.0%) |
| 5:30 AM to 5:59 AM | 32 (7.5%) | 0 (0.0%) |
| 6:00 AM to 6:29 AM | 49 (11.5%) | 123 (21.1%) |
| 6:30 AM to 6:59 AM | 94 (22.1%) | 8 (1.4%) |
| 7:00 AM to 7:29 AM | 67 (15.7%) | 131 (22.5%) |
| 7:30 AM to 7:59 AM | 16 (3.8%) | 130 (22.3%) |
| 8:00 AM to 8:29 AM | 31 (7.3%) | 63 (10.8%) |
| 8:30 AM to 8:59 AM | 0 (0.0%) | 68 (11.7%) |
| 9:00 AM to 9:59 AM | 0 (0.0%) | 0 (0.0%) |
| 10:00 AM to 10:59 AM | 0 (0.0%) | 0 (0.0%) |
| 11:00 AM to 11:59 AM | 0 (0.0%) | 0 (0.0%) |
| 12:00 PM to 3:59 PM | 0 (0.0%) | 45 (7.7%) |
| 4:00 PM to 11:59 PM | 0 (0.0%) | 2 (0.3%) |
| Total | 426 (100.0%) | 583 (100.0%) |
Housing Occupancy in Vista Santa Rosa
Occupancy by Ownership in Vista Santa Rosa
Of the total 664 dwellings in Vista Santa Rosa, owner-occupied units account for 524 (78.9%), while renter-occupied units make up 140 (21.1%).
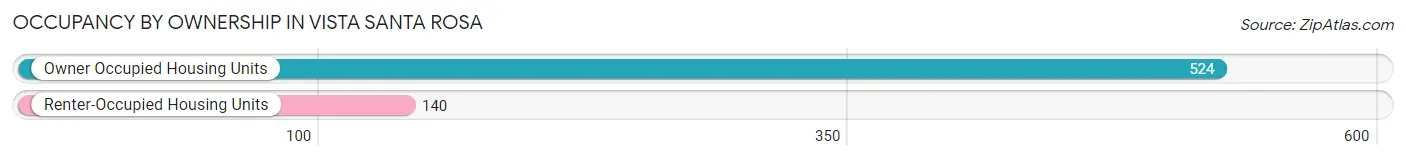
| Occupancy | # Housing Units | % Housing Units |
| Owner Occupied Housing Units | 524 | 78.9% |
| Renter-Occupied Housing Units | 140 | 21.1% |
| Total Occupied Housing Units | 664 | 100.0% |
Occupancy by Household Size in Vista Santa Rosa
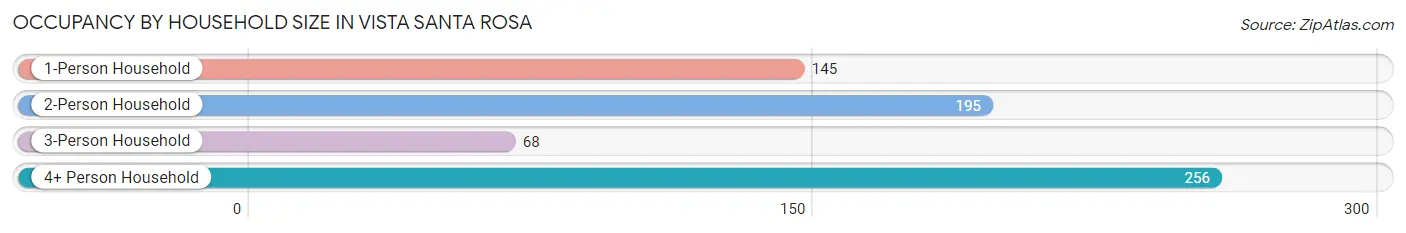
| Household Size | # Housing Units | % Housing Units |
| 1-Person Household | 145 | 21.8% |
| 2-Person Household | 195 | 29.4% |
| 3-Person Household | 68 | 10.2% |
| 4+ Person Household | 256 | 38.6% |
| Total Housing Units | 664 | 100.0% |
Occupancy by Ownership by Household Size in Vista Santa Rosa
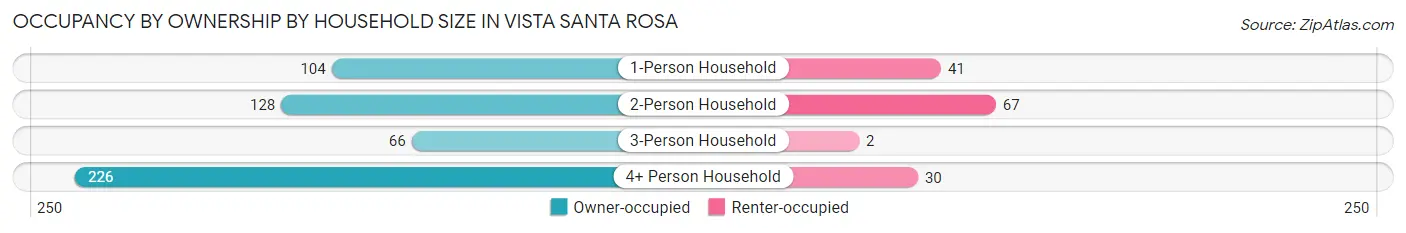
| Household Size | Owner-occupied | Renter-occupied |
| 1-Person Household | 104 (71.7%) | 41 (28.3%) |
| 2-Person Household | 128 (65.6%) | 67 (34.4%) |
| 3-Person Household | 66 (97.1%) | 2 (2.9%) |
| 4+ Person Household | 226 (88.3%) | 30 (11.7%) |
| Total Housing Units | 524 (78.9%) | 140 (21.1%) |
Occupancy by Educational Attainment in Vista Santa Rosa
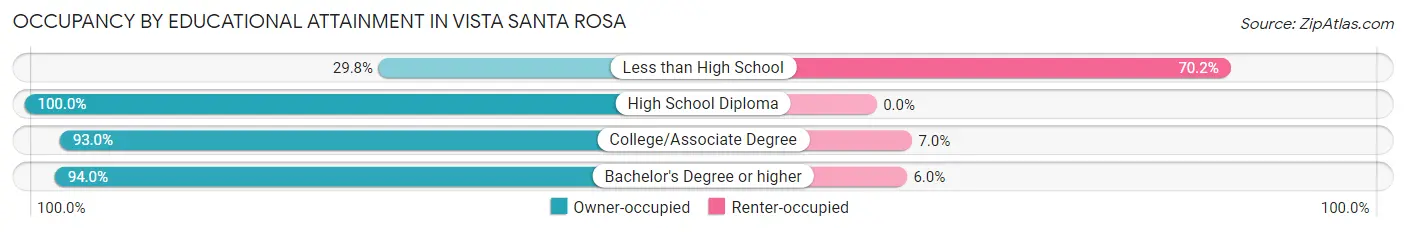
| Household Size | Owner-occupied | Renter-occupied |
| Less than High School | 50 (29.8%) | 118 (70.2%) |
| High School Diploma | 174 (100.0%) | 0 (0.0%) |
| College/Associate Degree | 253 (93.0%) | 19 (7.0%) |
| Bachelor's Degree or higher | 47 (94.0%) | 3 (6.0%) |
Occupancy by Age of Householder in Vista Santa Rosa
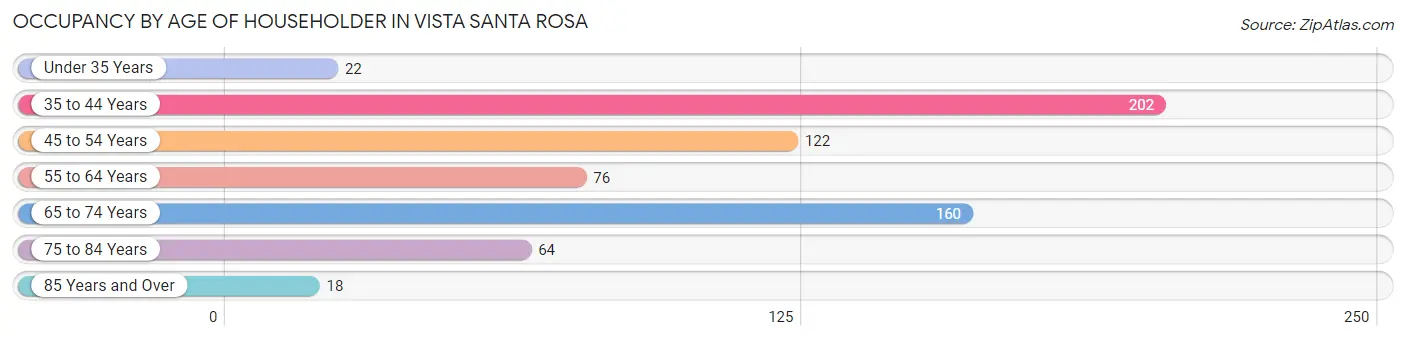
| Age Bracket | # Households | % Households |
| Under 35 Years | 22 | 3.3% |
| 35 to 44 Years | 202 | 30.4% |
| 45 to 54 Years | 122 | 18.4% |
| 55 to 64 Years | 76 | 11.5% |
| 65 to 74 Years | 160 | 24.1% |
| 75 to 84 Years | 64 | 9.6% |
| 85 Years and Over | 18 | 2.7% |
| Total | 664 | 100.0% |
Housing Finances in Vista Santa Rosa
Median Income by Occupancy in Vista Santa Rosa
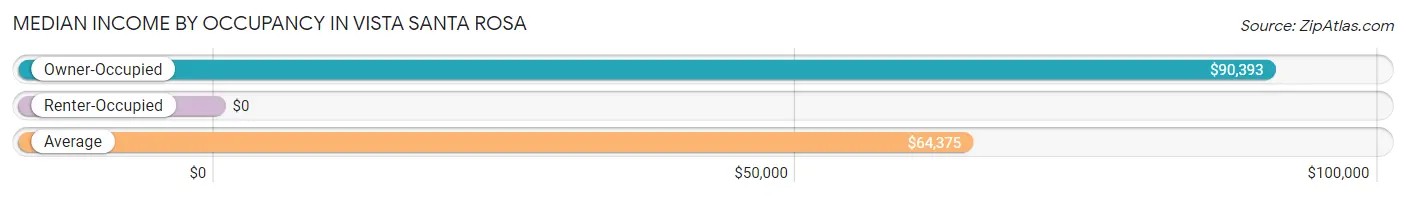
| Occupancy Type | # Households | Median Income |
| Owner-Occupied | 524 (78.9%) | $90,393 |
| Renter-Occupied | 140 (21.1%) | $0 |
| Average | 664 (100.0%) | $64,375 |
Occupancy by Householder Income Bracket in Vista Santa Rosa
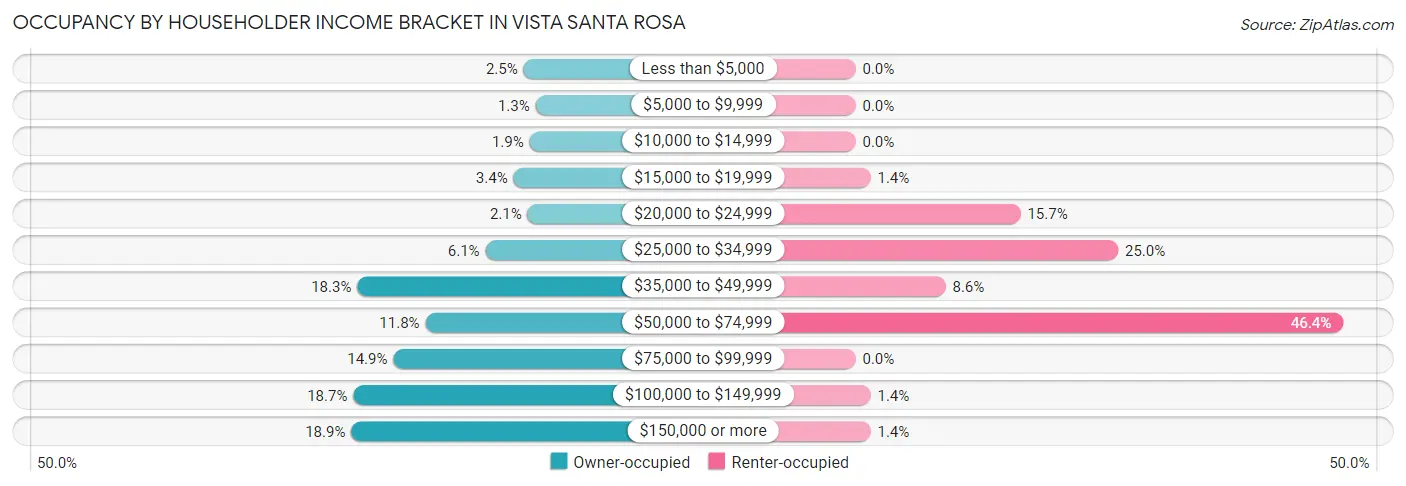
| Income Bracket | Owner-occupied | Renter-occupied |
| Less than $5,000 | 13 (2.5%) | 0 (0.0%) |
| $5,000 to $9,999 | 7 (1.3%) | 0 (0.0%) |
| $10,000 to $14,999 | 10 (1.9%) | 0 (0.0%) |
| $15,000 to $19,999 | 18 (3.4%) | 2 (1.4%) |
| $20,000 to $24,999 | 11 (2.1%) | 22 (15.7%) |
| $25,000 to $34,999 | 32 (6.1%) | 35 (25.0%) |
| $35,000 to $49,999 | 96 (18.3%) | 12 (8.6%) |
| $50,000 to $74,999 | 62 (11.8%) | 65 (46.4%) |
| $75,000 to $99,999 | 78 (14.9%) | 0 (0.0%) |
| $100,000 to $149,999 | 98 (18.7%) | 2 (1.4%) |
| $150,000 or more | 99 (18.9%) | 2 (1.4%) |
| Total | 524 (100.0%) | 140 (100.0%) |
Monthly Housing Cost Tiers in Vista Santa Rosa
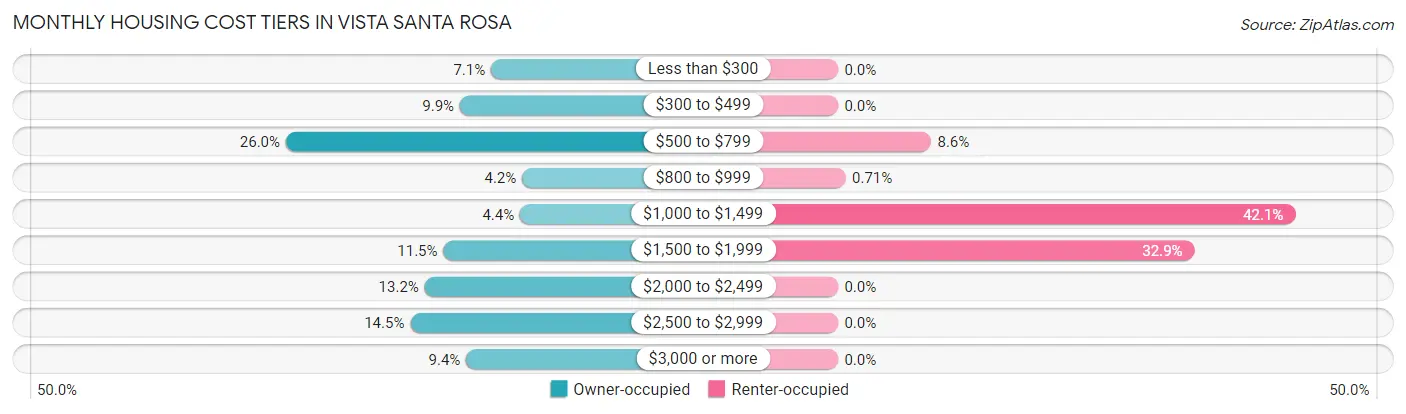
| Monthly Cost | Owner-occupied | Renter-occupied |
| Less than $300 | 37 (7.1%) | 0 (0.0%) |
| $300 to $499 | 52 (9.9%) | 0 (0.0%) |
| $500 to $799 | 136 (26.0%) | 12 (8.6%) |
| $800 to $999 | 22 (4.2%) | 1 (0.7%) |
| $1,000 to $1,499 | 23 (4.4%) | 59 (42.1%) |
| $1,500 to $1,999 | 60 (11.5%) | 46 (32.9%) |
| $2,000 to $2,499 | 69 (13.2%) | 0 (0.0%) |
| $2,500 to $2,999 | 76 (14.5%) | 0 (0.0%) |
| $3,000 or more | 49 (9.3%) | 0 (0.0%) |
| Total | 524 (100.0%) | 140 (100.0%) |
Physical Housing Characteristics in Vista Santa Rosa
Housing Structures in Vista Santa Rosa
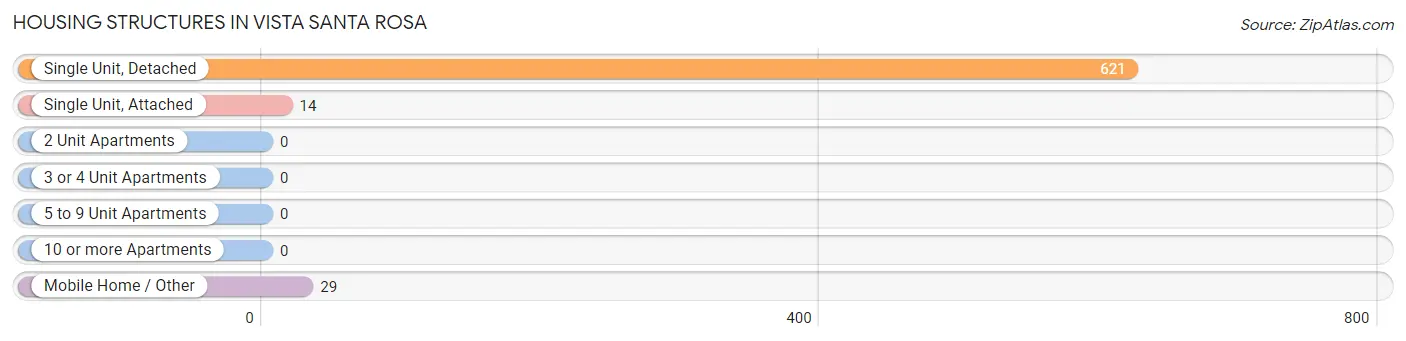
| Structure Type | # Housing Units | % Housing Units |
| Single Unit, Detached | 621 | 93.5% |
| Single Unit, Attached | 14 | 2.1% |
| 2 Unit Apartments | 0 | 0.0% |
| 3 or 4 Unit Apartments | 0 | 0.0% |
| 5 to 9 Unit Apartments | 0 | 0.0% |
| 10 or more Apartments | 0 | 0.0% |
| Mobile Home / Other | 29 | 4.4% |
| Total | 664 | 100.0% |
Housing Structures by Occupancy in Vista Santa Rosa
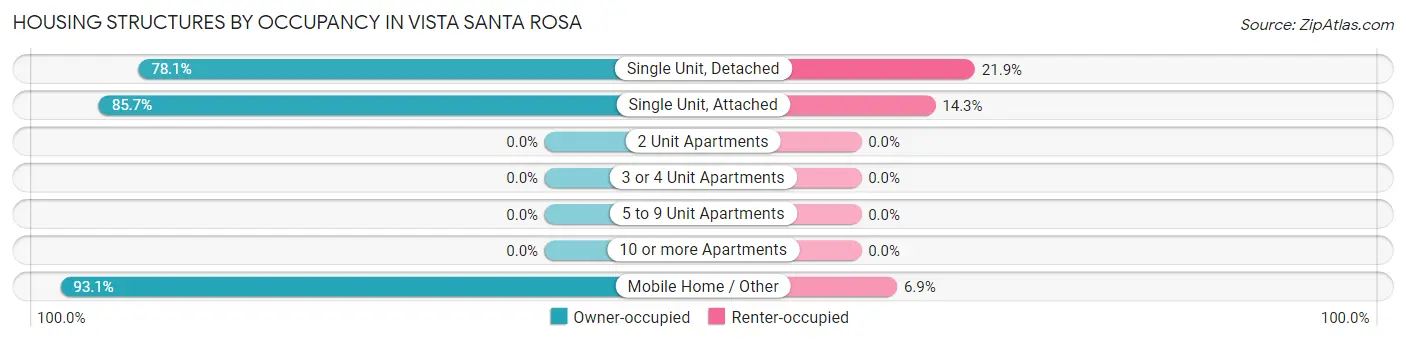
| Structure Type | Owner-occupied | Renter-occupied |
| Single Unit, Detached | 485 (78.1%) | 136 (21.9%) |
| Single Unit, Attached | 12 (85.7%) | 2 (14.3%) |
| 2 Unit Apartments | 0 (0.0%) | 0 (0.0%) |
| 3 or 4 Unit Apartments | 0 (0.0%) | 0 (0.0%) |
| 5 to 9 Unit Apartments | 0 (0.0%) | 0 (0.0%) |
| 10 or more Apartments | 0 (0.0%) | 0 (0.0%) |
| Mobile Home / Other | 27 (93.1%) | 2 (6.9%) |
| Total | 524 (78.9%) | 140 (21.1%) |
Housing Structures by Number of Rooms in Vista Santa Rosa
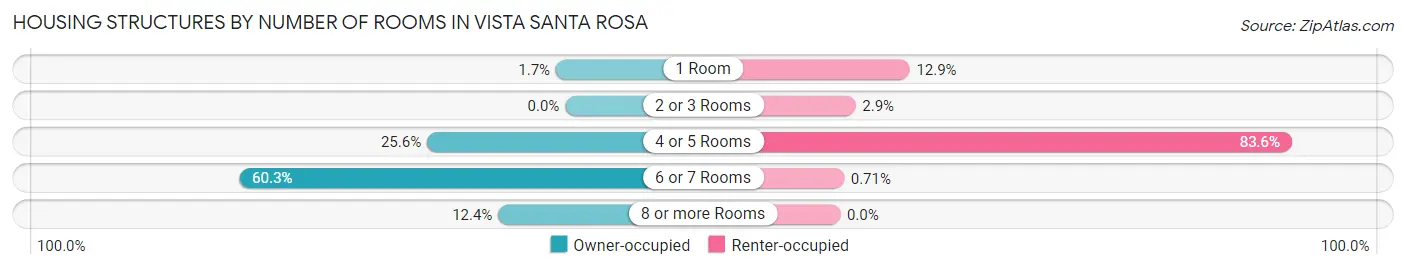
| Number of Rooms | Owner-occupied | Renter-occupied |
| 1 Room | 9 (1.7%) | 18 (12.9%) |
| 2 or 3 Rooms | 0 (0.0%) | 4 (2.9%) |
| 4 or 5 Rooms | 134 (25.6%) | 117 (83.6%) |
| 6 or 7 Rooms | 316 (60.3%) | 1 (0.7%) |
| 8 or more Rooms | 65 (12.4%) | 0 (0.0%) |
| Total | 524 (100.0%) | 140 (100.0%) |
Housing Structure by Heating Type in Vista Santa Rosa
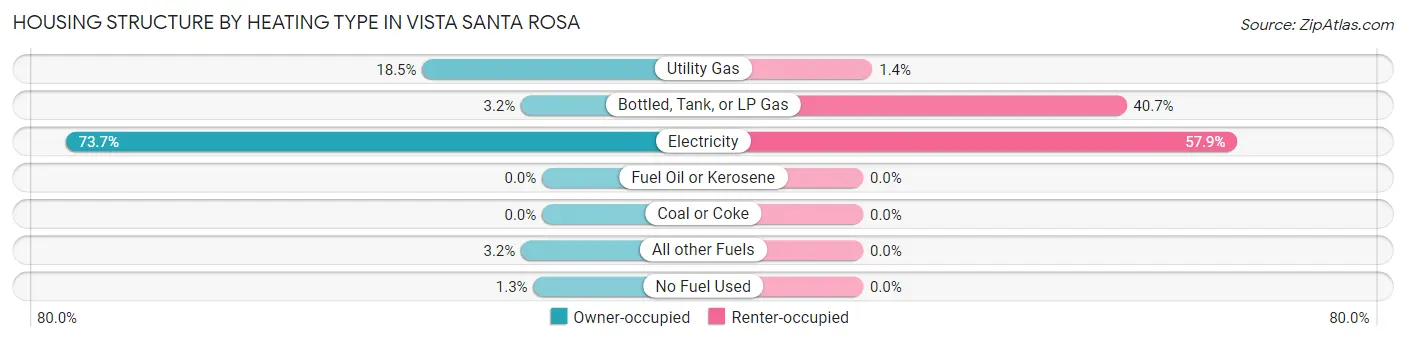
| Heating Type | Owner-occupied | Renter-occupied |
| Utility Gas | 97 (18.5%) | 2 (1.4%) |
| Bottled, Tank, or LP Gas | 17 (3.2%) | 57 (40.7%) |
| Electricity | 386 (73.7%) | 81 (57.9%) |
| Fuel Oil or Kerosene | 0 (0.0%) | 0 (0.0%) |
| Coal or Coke | 0 (0.0%) | 0 (0.0%) |
| All other Fuels | 17 (3.2%) | 0 (0.0%) |
| No Fuel Used | 7 (1.3%) | 0 (0.0%) |
| Total | 524 (100.0%) | 140 (100.0%) |
Household Vehicle Usage in Vista Santa Rosa
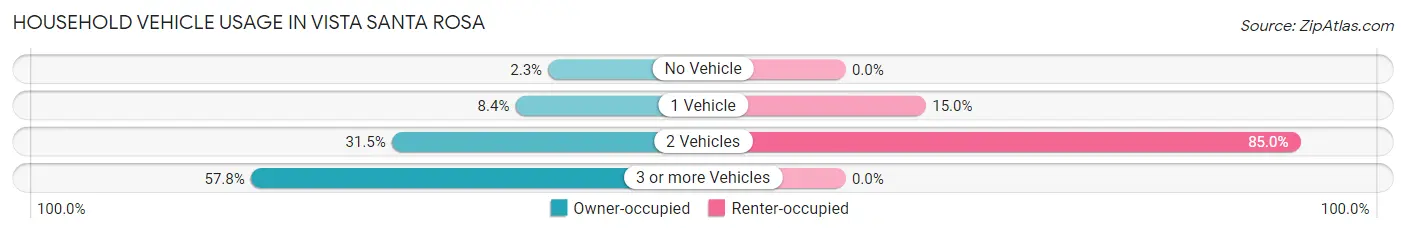
| Vehicles per Household | Owner-occupied | Renter-occupied |
| No Vehicle | 12 (2.3%) | 0 (0.0%) |
| 1 Vehicle | 44 (8.4%) | 21 (15.0%) |
| 2 Vehicles | 165 (31.5%) | 119 (85.0%) |
| 3 or more Vehicles | 303 (57.8%) | 0 (0.0%) |
| Total | 524 (100.0%) | 140 (100.0%) |
Real Estate & Mortgages in Vista Santa Rosa
Real Estate and Mortgage Overview in Vista Santa Rosa
| Characteristic | Without Mortgage | With Mortgage |
| Housing Units | 246 | 278 |
| Median Property Value | $330,400 | $487,700 |
| Median Household Income | $90,143 | $84 |
| Monthly Housing Costs | $538 | $37 |
| Real Estate Taxes | $2,425 | $1 |
Property Value by Mortgage Status in Vista Santa Rosa
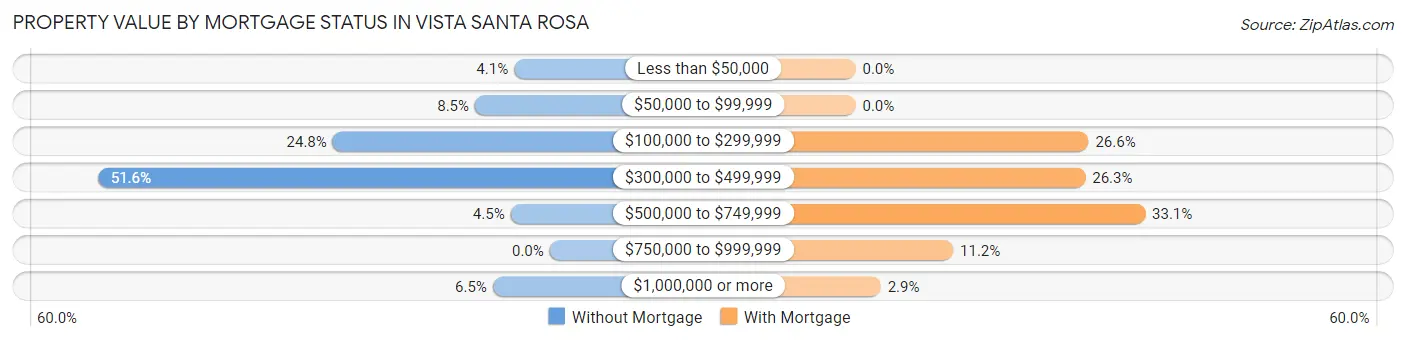
| Property Value | Without Mortgage | With Mortgage |
| Less than $50,000 | 10 (4.1%) | 0 (0.0%) |
| $50,000 to $99,999 | 21 (8.5%) | 0 (0.0%) |
| $100,000 to $299,999 | 61 (24.8%) | 74 (26.6%) |
| $300,000 to $499,999 | 127 (51.6%) | 73 (26.3%) |
| $500,000 to $749,999 | 11 (4.5%) | 92 (33.1%) |
| $750,000 to $999,999 | 0 (0.0%) | 31 (11.2%) |
| $1,000,000 or more | 16 (6.5%) | 8 (2.9%) |
| Total | 246 (100.0%) | 278 (100.0%) |
Household Income by Mortgage Status in Vista Santa Rosa
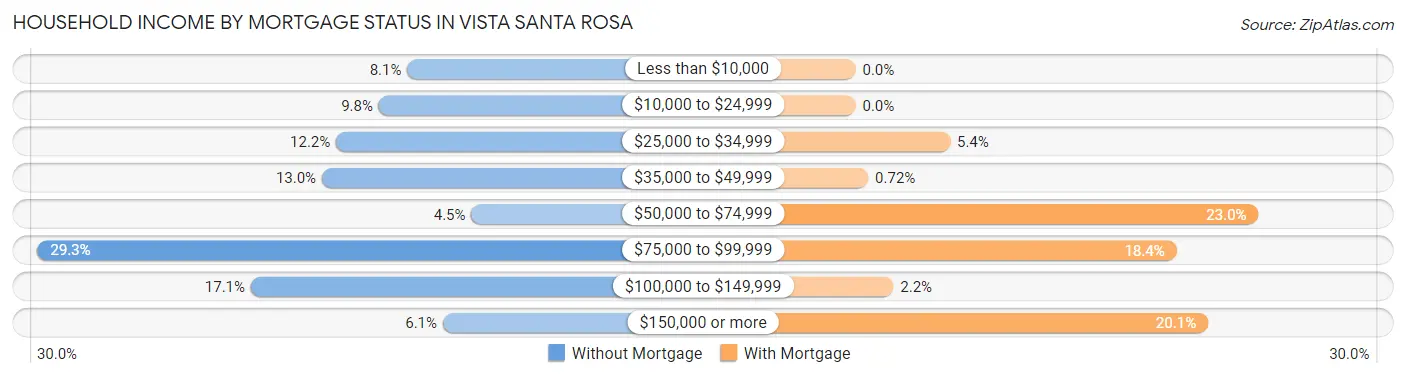
| Household Income | Without Mortgage | With Mortgage |
| Less than $10,000 | 20 (8.1%) | 0 (0.0%) |
| $10,000 to $24,999 | 24 (9.8%) | 0 (0.0%) |
| $25,000 to $34,999 | 30 (12.2%) | 15 (5.4%) |
| $35,000 to $49,999 | 32 (13.0%) | 2 (0.7%) |
| $50,000 to $74,999 | 11 (4.5%) | 64 (23.0%) |
| $75,000 to $99,999 | 72 (29.3%) | 51 (18.3%) |
| $100,000 to $149,999 | 42 (17.1%) | 6 (2.2%) |
| $150,000 or more | 15 (6.1%) | 56 (20.1%) |
| Total | 246 (100.0%) | 278 (100.0%) |
Property Value to Household Income Ratio in Vista Santa Rosa
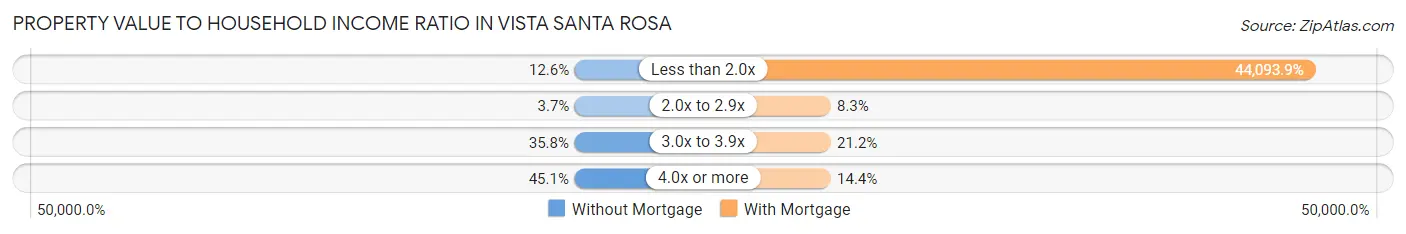
| Value-to-Income Ratio | Without Mortgage | With Mortgage |
| Less than 2.0x | 31 (12.6%) | 122,581 (44,093.9%) |
| 2.0x to 2.9x | 9 (3.7%) | 23 (8.3%) |
| 3.0x to 3.9x | 88 (35.8%) | 59 (21.2%) |
| 4.0x or more | 111 (45.1%) | 40 (14.4%) |
| Total | 246 (100.0%) | 278 (100.0%) |
Real Estate Taxes by Mortgage Status in Vista Santa Rosa
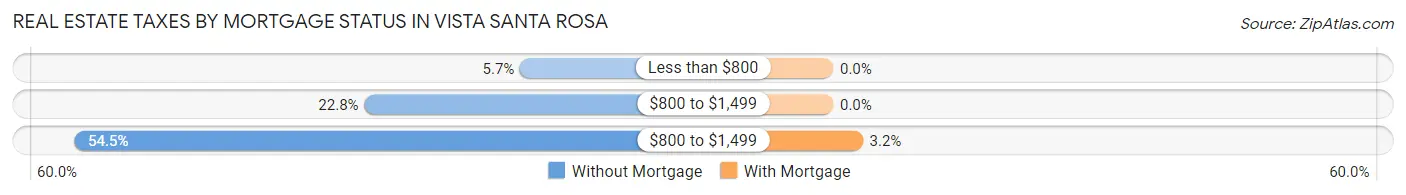
| Property Taxes | Without Mortgage | With Mortgage |
| Less than $800 | 14 (5.7%) | 0 (0.0%) |
| $800 to $1,499 | 56 (22.8%) | 0 (0.0%) |
| $800 to $1,499 | 134 (54.5%) | 9 (3.2%) |
| Total | 246 (100.0%) | 278 (100.0%) |
Health & Disability in Vista Santa Rosa
Health Insurance Coverage by Age in Vista Santa Rosa
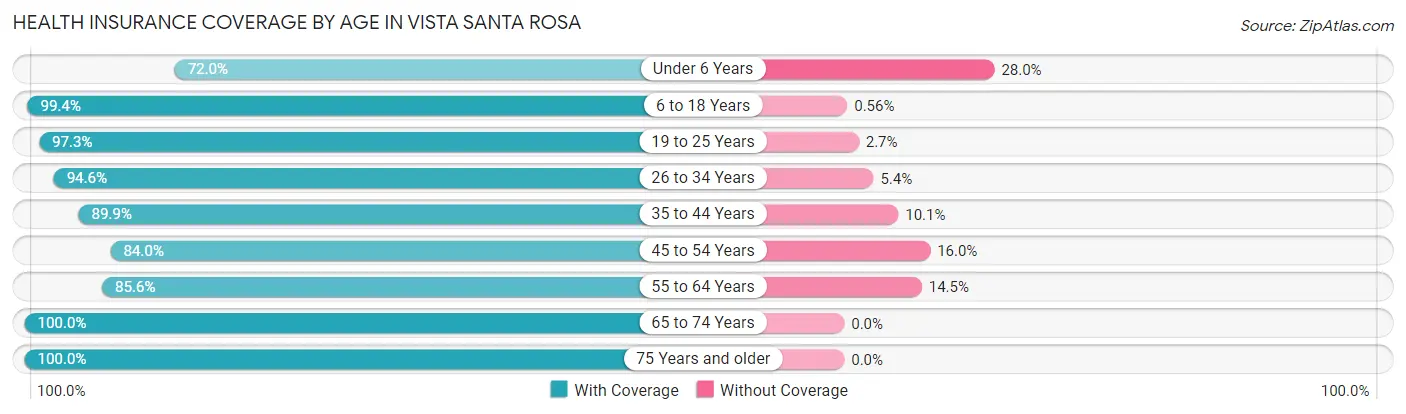
| Age Bracket | With Coverage | Without Coverage |
| Under 6 Years | 18 (72.0%) | 7 (28.0%) |
| 6 to 18 Years | 529 (99.4%) | 3 (0.6%) |
| 19 to 25 Years | 108 (97.3%) | 3 (2.7%) |
| 26 to 34 Years | 139 (94.6%) | 8 (5.4%) |
| 35 to 44 Years | 491 (89.9%) | 55 (10.1%) |
| 45 to 54 Years | 173 (84.0%) | 33 (16.0%) |
| 55 to 64 Years | 219 (85.6%) | 37 (14.4%) |
| 65 to 74 Years | 261 (100.0%) | 0 (0.0%) |
| 75 Years and older | 185 (100.0%) | 0 (0.0%) |
| Total | 2,123 (93.6%) | 146 (6.4%) |
Health Insurance Coverage by Citizenship Status in Vista Santa Rosa
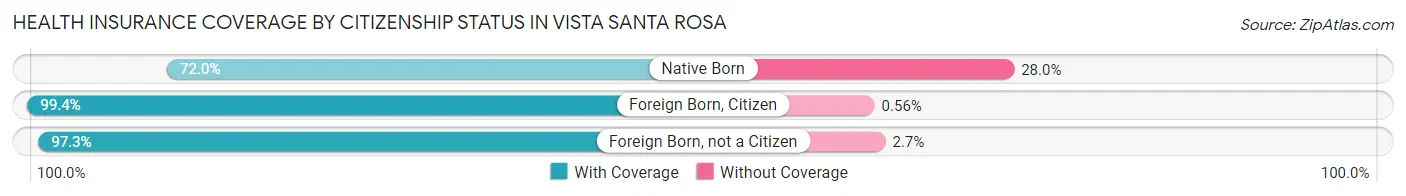
| Citizenship Status | With Coverage | Without Coverage |
| Native Born | 18 (72.0%) | 7 (28.0%) |
| Foreign Born, Citizen | 529 (99.4%) | 3 (0.6%) |
| Foreign Born, not a Citizen | 108 (97.3%) | 3 (2.7%) |
Health Insurance Coverage by Household Income in Vista Santa Rosa
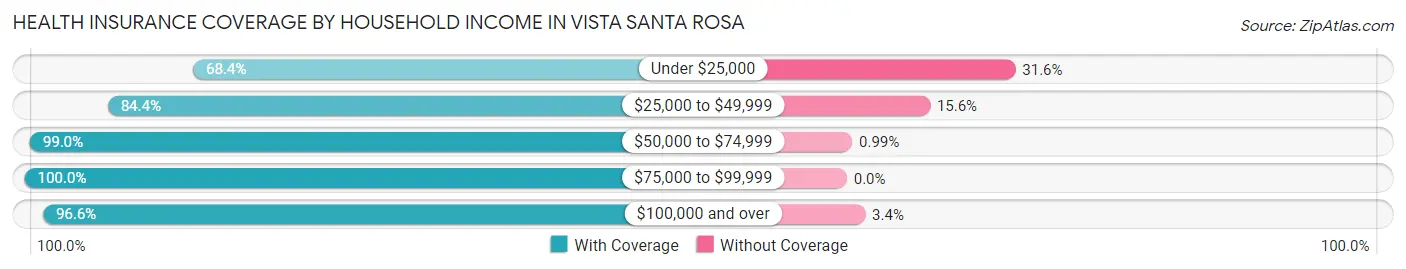
| Household Income | With Coverage | Without Coverage |
| Under $25,000 | 78 (68.4%) | 36 (31.6%) |
| $25,000 to $49,999 | 390 (84.4%) | 72 (15.6%) |
| $50,000 to $74,999 | 501 (99.0%) | 5 (1.0%) |
| $75,000 to $99,999 | 229 (100.0%) | 0 (0.0%) |
| $100,000 and over | 925 (96.6%) | 33 (3.4%) |
Public vs Private Health Insurance Coverage by Age in Vista Santa Rosa
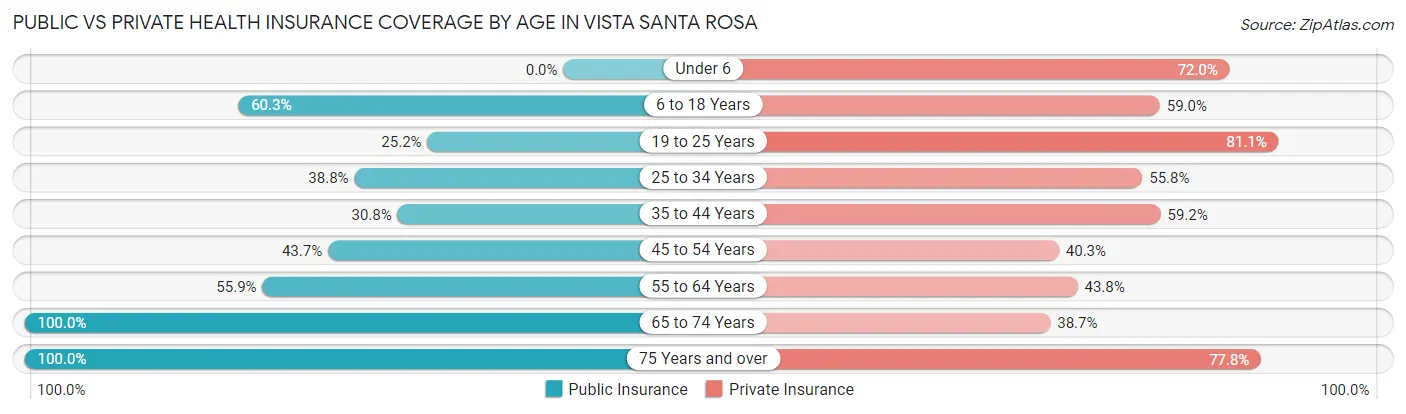
| Age Bracket | Public Insurance | Private Insurance |
| Under 6 | 0 (0.0%) | 18 (72.0%) |
| 6 to 18 Years | 321 (60.3%) | 314 (59.0%) |
| 19 to 25 Years | 28 (25.2%) | 90 (81.1%) |
| 25 to 34 Years | 57 (38.8%) | 82 (55.8%) |
| 35 to 44 Years | 168 (30.8%) | 323 (59.2%) |
| 45 to 54 Years | 90 (43.7%) | 83 (40.3%) |
| 55 to 64 Years | 143 (55.9%) | 112 (43.8%) |
| 65 to 74 Years | 261 (100.0%) | 101 (38.7%) |
| 75 Years and over | 185 (100.0%) | 144 (77.8%) |
| Total | 1,253 (55.2%) | 1,267 (55.8%) |
Disability Status by Sex by Age in Vista Santa Rosa
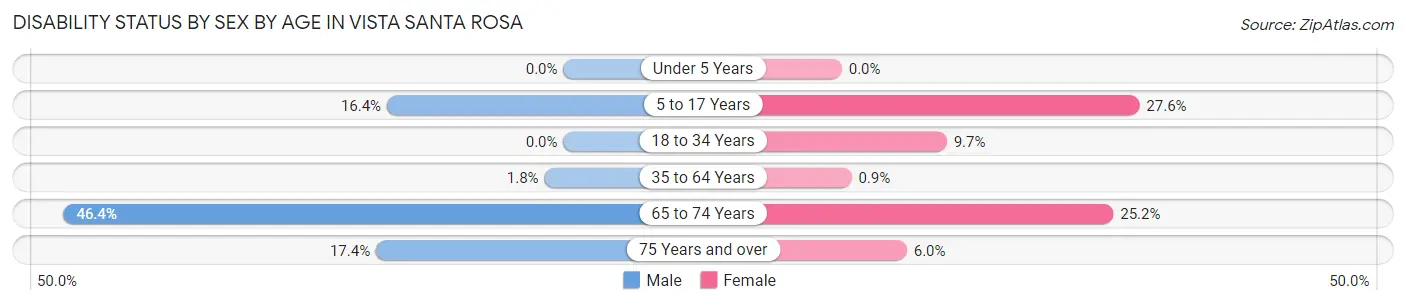
| Age Bracket | Male | Female |
| Under 5 Years | 0 (0.0%) | 0 (0.0%) |
| 5 to 17 Years | 46 (16.4%) | 66 (27.6%) |
| 18 to 34 Years | 0 (0.0%) | 19 (9.7%) |
| 35 to 64 Years | 8 (1.8%) | 5 (0.9%) |
| 65 to 74 Years | 64 (46.4%) | 31 (25.2%) |
| 75 Years and over | 12 (17.4%) | 7 (6.0%) |
Disability Class by Sex by Age in Vista Santa Rosa
Disability Class: Hearing Difficulty
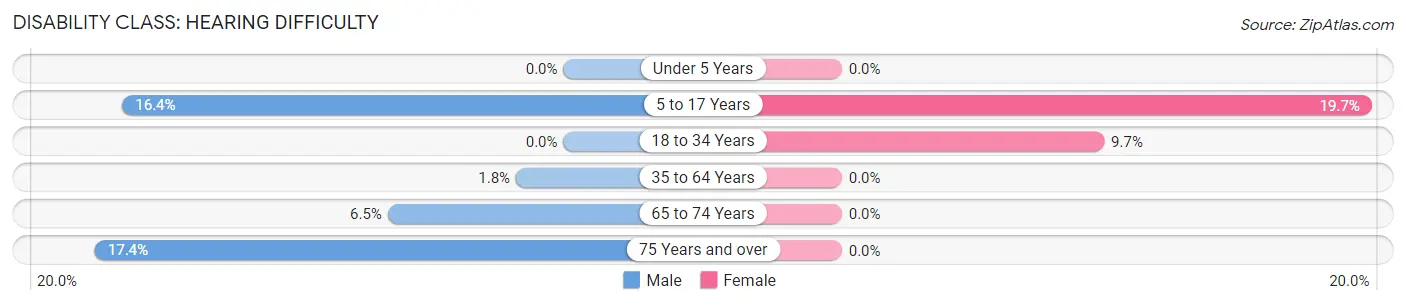
| Age Bracket | Male | Female |
| Under 5 Years | 0 (0.0%) | 0 (0.0%) |
| 5 to 17 Years | 46 (16.4%) | 47 (19.7%) |
| 18 to 34 Years | 0 (0.0%) | 19 (9.7%) |
| 35 to 64 Years | 8 (1.8%) | 0 (0.0%) |
| 65 to 74 Years | 9 (6.5%) | 0 (0.0%) |
| 75 Years and over | 12 (17.4%) | 0 (0.0%) |
Disability Class: Vision Difficulty
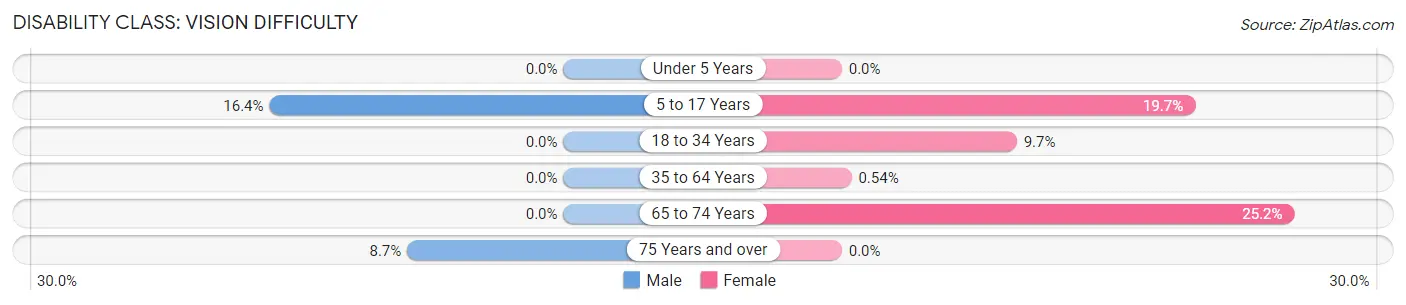
| Age Bracket | Male | Female |
| Under 5 Years | 0 (0.0%) | 0 (0.0%) |
| 5 to 17 Years | 46 (16.4%) | 47 (19.7%) |
| 18 to 34 Years | 0 (0.0%) | 19 (9.7%) |
| 35 to 64 Years | 0 (0.0%) | 3 (0.5%) |
| 65 to 74 Years | 0 (0.0%) | 31 (25.2%) |
| 75 Years and over | 6 (8.7%) | 0 (0.0%) |
Disability Class: Cognitive Difficulty
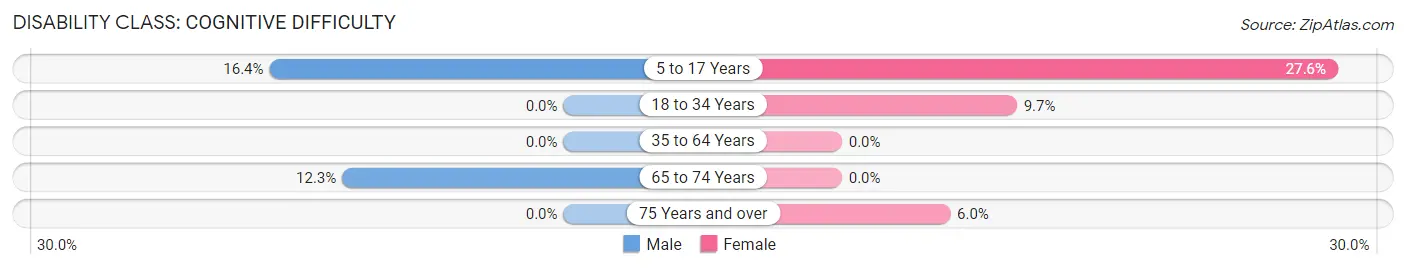
| Age Bracket | Male | Female |
| 5 to 17 Years | 46 (16.4%) | 66 (27.6%) |
| 18 to 34 Years | 0 (0.0%) | 19 (9.7%) |
| 35 to 64 Years | 0 (0.0%) | 0 (0.0%) |
| 65 to 74 Years | 17 (12.3%) | 0 (0.0%) |
| 75 Years and over | 0 (0.0%) | 7 (6.0%) |
Disability Class: Ambulatory Difficulty
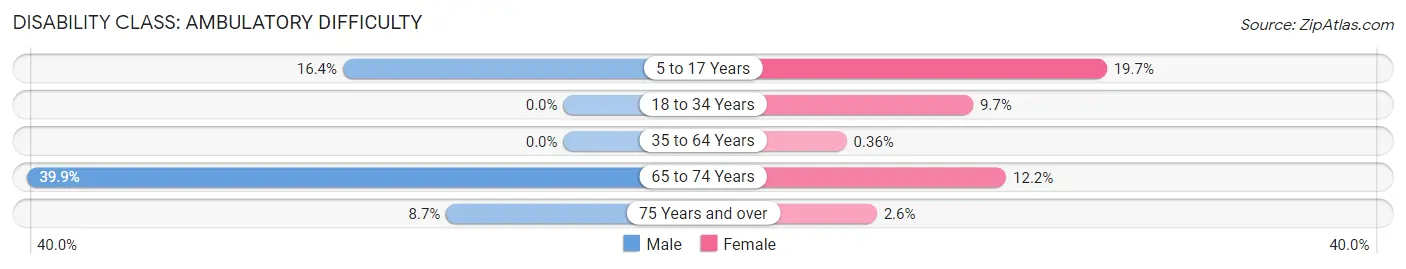
| Age Bracket | Male | Female |
| 5 to 17 Years | 46 (16.4%) | 47 (19.7%) |
| 18 to 34 Years | 0 (0.0%) | 19 (9.7%) |
| 35 to 64 Years | 0 (0.0%) | 2 (0.4%) |
| 65 to 74 Years | 55 (39.9%) | 15 (12.2%) |
| 75 Years and over | 6 (8.7%) | 3 (2.6%) |
Disability Class: Self-Care Difficulty
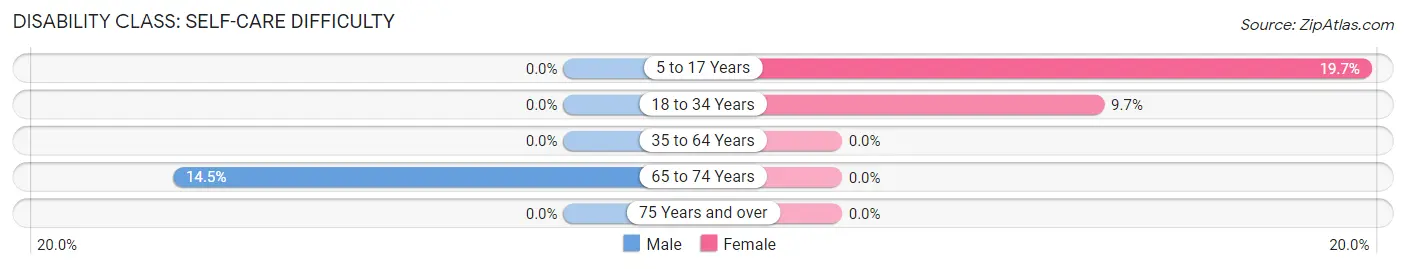
| Age Bracket | Male | Female |
| 5 to 17 Years | 0 (0.0%) | 47 (19.7%) |
| 18 to 34 Years | 0 (0.0%) | 19 (9.7%) |
| 35 to 64 Years | 0 (0.0%) | 0 (0.0%) |
| 65 to 74 Years | 20 (14.5%) | 0 (0.0%) |
| 75 Years and over | 0 (0.0%) | 0 (0.0%) |
Technology Access in Vista Santa Rosa
Computing Device Access in Vista Santa Rosa
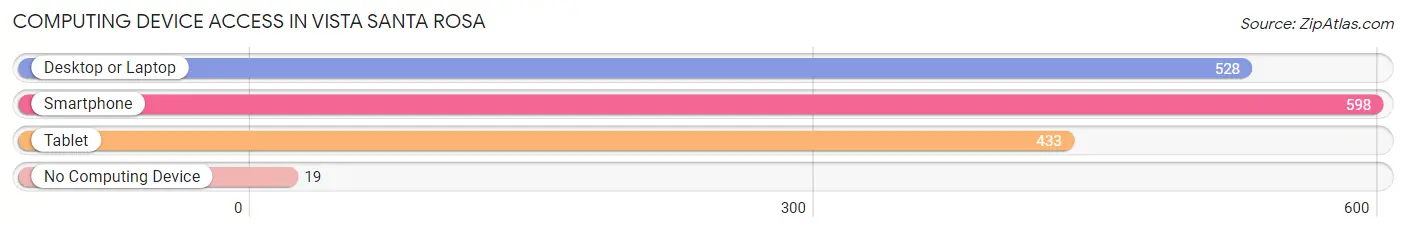
| Device Type | # Households | % Households |
| Desktop or Laptop | 528 | 79.5% |
| Smartphone | 598 | 90.1% |
| Tablet | 433 | 65.2% |
| No Computing Device | 19 | 2.9% |
| Total | 664 | 100.0% |
Internet Access in Vista Santa Rosa
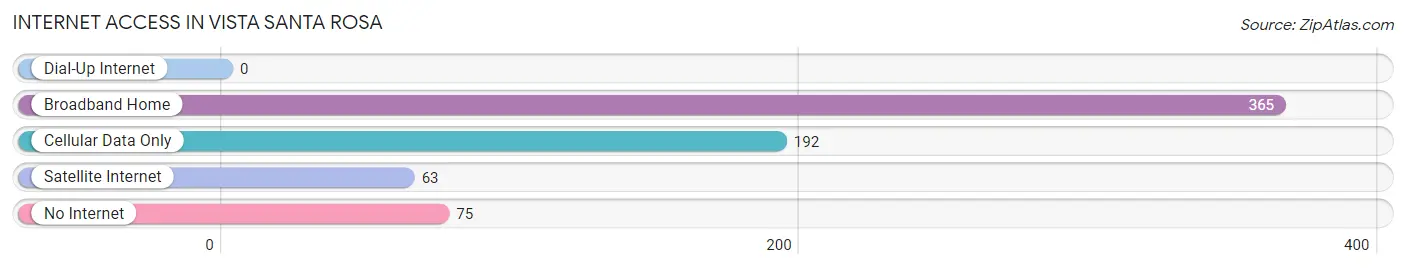
| Internet Type | # Households | % Households |
| Dial-Up Internet | 0 | 0.0% |
| Broadband Home | 365 | 55.0% |
| Cellular Data Only | 192 | 28.9% |
| Satellite Internet | 63 | 9.5% |
| No Internet | 75 | 11.3% |
| Total | 664 | 100.0% |
Vista Santa Rosa Summary
Santa Rosa, California is a city located in Sonoma County, California, United States. It is the county seat and largest city in Sonoma County. The population of Santa Rosa was 167,815 as of the 2010 census, making it the fifth-largest city in the San Francisco Bay Area after San Jose, San Francisco, Oakland, and Fremont. Santa Rosa is the largest city in California's Redwood Empire, Wine Country and the North Bay.
History
The area around what is now Santa Rosa was originally inhabited by the Pomo people, who lived in villages along the Russian River. The first European settlement in the area was a Spanish mission established in 1823. The mission was named after Saint Rose of Lima, the patron saint of Peru. The area was later settled by American settlers in the 1840s, and the town of Santa Rosa was founded in 1849.
The town was named after the nearby Santa Rosa Creek, which was named after the Spanish mission. The town grew rapidly in the late 19th century, and by the early 20th century it had become a major agricultural center. The city was incorporated in 1868, and by the 1920s it had become a major tourist destination.
Geography
Santa Rosa is located in the northern part of Sonoma County, about 50 miles north of San Francisco. The city is situated in the heart of the Sonoma Valley, surrounded by rolling hills and vineyards. The city is located at the confluence of the Santa Rosa Creek and the Matanzas Creek. The city is located at the northern end of the Santa Rosa Plain, an alluvial plain that stretches from the Santa Rosa Mountains to the Pacific Ocean.
The city has a total area of 37.3 square miles, of which 36.7 square miles is land and 0.6 square miles is water. The city is located at an elevation of about 200 feet above sea level.
Economy
Santa Rosa is a major economic center in the North Bay region of California. The city is home to a number of major employers, including Kaiser Permanente, Sutter Health, and the Santa Rosa Memorial Hospital. The city is also home to a number of technology companies, including Agilent Technologies, Autodesk, and Adobe Systems.
The city is also a major center for the wine industry, with more than 200 wineries located in the surrounding area. The city is also home to a number of breweries, including Lagunitas Brewing Company and Russian River Brewing Company.
Demographics
As of the 2010 census, the population of Santa Rosa was 167,815. The racial makeup of the city was 68.2% White, 11.3% Hispanic or Latino, 8.2% Asian, 6.2% African American, 0.7% Native American, 0.2% Pacific Islander, and 5.2% from other races. The median household income was $60,837, and the median family income was $71,837.
The city is home to a number of educational institutions, including Santa Rosa Junior College, Sonoma State University, and the University of California, Santa Rosa. The city is also home to a number of cultural attractions, including the Charles M. Schulz Museum and Research Center, the Sonoma County Museum, and the Luther Burbank Home and Gardens.
Common Questions
What is Per Capita Income in Vista Santa Rosa?
Per Capita income in Vista Santa Rosa is $29,024.
What is the Median Family Income in Vista Santa Rosa?
Median Family Income in Vista Santa Rosa is $66,141.
What is the Median Household income in Vista Santa Rosa?
Median Household Income in Vista Santa Rosa is $64,375.
What is Income or Wage Gap in Vista Santa Rosa?
Income or Wage Gap in Vista Santa Rosa is 24.9%.
Women in Vista Santa Rosa earn 75.1 cents for every dollar earned by a man.
What is Inequality or Gini Index in Vista Santa Rosa?
Inequality or Gini Index in Vista Santa Rosa is 0.42.
What is the Total Population of Vista Santa Rosa?
Total Population of Vista Santa Rosa is 2,269.
What is the Total Male Population of Vista Santa Rosa?
Total Male Population of Vista Santa Rosa is 1,025.
What is the Total Female Population of Vista Santa Rosa?
Total Female Population of Vista Santa Rosa is 1,244.
What is the Ratio of Males per 100 Females in Vista Santa Rosa?
There are 82.40 Males per 100 Females in Vista Santa Rosa.
What is the Ratio of Females per 100 Males in Vista Santa Rosa?
There are 121.37 Females per 100 Males in Vista Santa Rosa.
What is the Median Population Age in Vista Santa Rosa?
Median Population Age in Vista Santa Rosa is 40.6 Years.
What is the Average Family Size in Vista Santa Rosa
Average Family Size in Vista Santa Rosa is 3.9 People.
What is the Average Household Size in Vista Santa Rosa
Average Household Size in Vista Santa Rosa is 3.4 People.
How Large is the Labor Force in Vista Santa Rosa?
There are 1,121 People in the Labor Forcein in Vista Santa Rosa.
What is the Percentage of People in the Labor Force in Vista Santa Rosa?
64.0% of People are in the Labor Force in Vista Santa Rosa.
What is the Unemployment Rate in Vista Santa Rosa?
Unemployment Rate in Vista Santa Rosa is 6.0%.