Cities with the Lowest Poverty Level Among Single Females in Ohio
RELATED REPORTS & OPTIONS
Lowest Poverty | Single Female
Ohio
Compare Cities
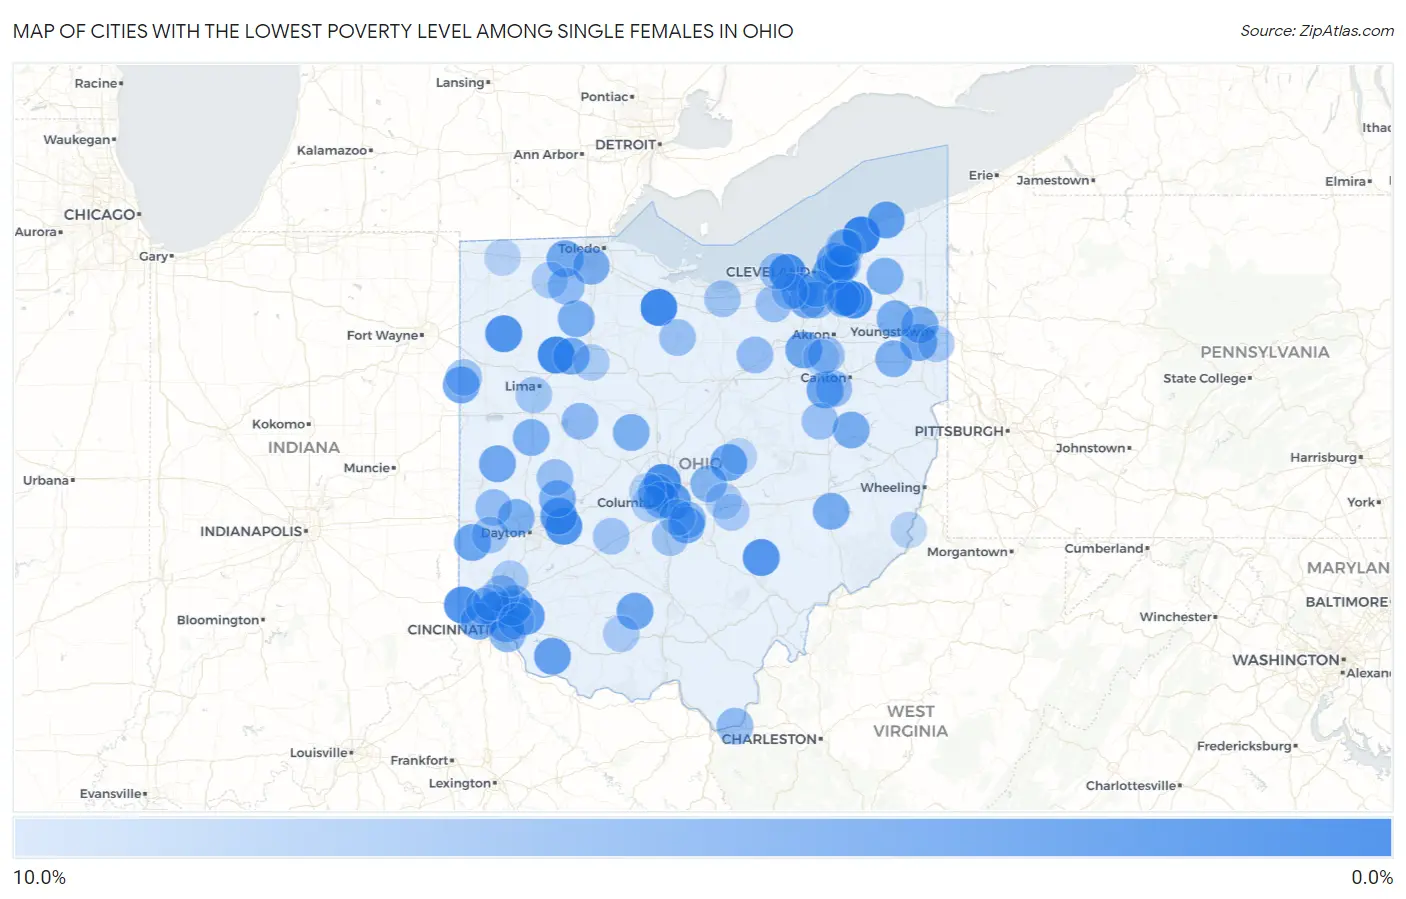
Map of Cities with the Lowest Poverty Level Among Single Females in Ohio
10.0%
0.0%
Cities with the Lowest Poverty Level Among Single Females in Ohio
| City | Single Female Poverty | vs State | vs National | |
| 1. | Grand River | 1.6% | 28.5%(-26.9)#1 | 24.1%(-22.5)#52 |
| 2. | Green Springs | 2.1% | 28.5%(-26.4)#2 | 24.1%(-21.9)#108 |
| 3. | Pandora | 2.2% | 28.5%(-26.4)#3 | 24.1%(-21.9)#115 |
| 4. | Aurora | 2.2% | 28.5%(-26.3)#4 | 24.1%(-21.8)#125 |
| 5. | Bay Village | 2.6% | 28.5%(-25.9)#5 | 24.1%(-21.4)#165 |
| 6. | Worthington | 2.7% | 28.5%(-25.8)#6 | 24.1%(-21.4)#180 |
| 7. | Harrison | 2.9% | 28.5%(-25.6)#7 | 24.1%(-21.1)#221 |
| 8. | Wyoming | 3.1% | 28.5%(-25.5)#8 | 24.1%(-21.0)#246 |
| 9. | Melrose | 3.1% | 28.5%(-25.4)#9 | 24.1%(-21.0)#258 |
| 10. | Yellow Springs | 3.2% | 28.5%(-25.4)#10 | 24.1%(-20.9)#266 |
| 11. | Hemlock | 3.3% | 28.5%(-25.2)#11 | 24.1%(-20.7)#300 |
| 12. | Lyndhurst | 3.6% | 28.5%(-24.9)#12 | 24.1%(-20.5)#367 |
| 13. | Reminderville | 3.7% | 28.5%(-24.9)#13 | 24.1%(-20.4)#376 |
| 14. | Mount Repose | 3.8% | 28.5%(-24.8)#14 | 24.1%(-20.3)#391 |
| 15. | Bexley | 3.9% | 28.5%(-24.7)#15 | 24.1%(-20.2)#426 |
| 16. | Enon | 3.9% | 28.5%(-24.6)#16 | 24.1%(-20.1)#434 |
| 17. | North Madison | 4.1% | 28.5%(-24.4)#17 | 24.1%(-20.0)#465 |
| 18. | Hamersville | 4.3% | 28.5%(-24.2)#18 | 24.1%(-19.7)#521 |
| 19. | University Heights | 4.6% | 28.5%(-24.0)#19 | 24.1%(-19.5)#584 |
| 20. | Lake Lakengren | 4.7% | 28.5%(-23.9)#20 | 24.1%(-19.4)#608 |
| 21. | Brewster | 4.7% | 28.5%(-23.8)#21 | 24.1%(-19.4)#617 |
| 22. | Utica | 4.8% | 28.5%(-23.8)#22 | 24.1%(-19.3)#630 |
| 23. | Rittman | 4.8% | 28.5%(-23.7)#23 | 24.1%(-19.2)#660 |
| 24. | Bainbridge | 4.9% | 28.5%(-23.7)#24 | 24.1%(-19.2)#670 |
| 25. | Canfield | 4.9% | 28.5%(-23.6)#25 | 24.1%(-19.2)#678 |
| 26. | Fairfax | 4.9% | 28.5%(-23.6)#26 | 24.1%(-19.1)#682 |
| 27. | Versailles | 5.0% | 28.5%(-23.5)#27 | 24.1%(-19.1)#696 |
| 28. | Willshire | 5.0% | 28.5%(-23.5)#28 | 24.1%(-19.1)#708 |
| 29. | Lithopolis | 5.1% | 28.5%(-23.5)#29 | 24.1%(-19.0)#722 |
| 30. | Swanton | 5.1% | 28.5%(-23.4)#30 | 24.1%(-19.0)#735 |
| 31. | Bridgetown | 5.2% | 28.5%(-23.4)#31 | 24.1%(-18.9)#754 |
| 32. | Richmond Heights | 5.2% | 28.5%(-23.3)#32 | 24.1%(-18.9)#760 |
| 33. | Mount Cory | 5.3% | 28.5%(-23.3)#33 | 24.1%(-18.8)#788 |
| 34. | Mineral Ridge | 5.4% | 28.5%(-23.1)#34 | 24.1%(-18.7)#816 |
| 35. | Barnhill | 5.4% | 28.5%(-23.1)#35 | 24.1%(-18.7)#823 |
| 36. | Hoytville | 5.4% | 28.5%(-23.1)#36 | 24.1%(-18.7)#825 |
| 37. | Perrysburg | 5.4% | 28.5%(-23.1)#37 | 24.1%(-18.7)#830 |
| 38. | Pleasant City | 5.4% | 28.5%(-23.1)#38 | 24.1%(-18.6)#832 |
| 39. | North Royalton | 5.4% | 28.5%(-23.1)#39 | 24.1%(-18.6)#833 |
| 40. | North Hampton | 5.6% | 28.5%(-23.0)#40 | 24.1%(-18.5)#866 |
| 41. | Highland Heights | 5.6% | 28.5%(-22.9)#41 | 24.1%(-18.5)#878 |
| 42. | Newton Falls | 5.6% | 28.5%(-22.9)#42 | 24.1%(-18.4)#891 |
| 43. | Richwood | 5.7% | 28.5%(-22.9)#43 | 24.1%(-18.4)#894 |
| 44. | Englewood | 5.7% | 28.5%(-22.8)#44 | 24.1%(-18.4)#907 |
| 45. | Middlefield | 5.8% | 28.5%(-22.8)#45 | 24.1%(-18.3)#932 |
| 46. | Upper Arlington | 5.9% | 28.5%(-22.7)#46 | 24.1%(-18.2)#948 |
| 47. | Anna | 5.9% | 28.5%(-22.7)#47 | 24.1%(-18.2)#960 |
| 48. | Beloit | 5.9% | 28.5%(-22.7)#48 | 24.1%(-18.2)#962 |
| 49. | Middleburg Heights | 5.9% | 28.5%(-22.6)#49 | 24.1%(-18.2)#981 |
| 50. | Grandview Heights | 6.2% | 28.5%(-22.3)#50 | 24.1%(-17.8)#1,074 |
| 51. | Alexandria | 6.2% | 28.5%(-22.3)#51 | 24.1%(-17.8)#1,091 |
| 52. | Sixteen Mile Stand | 6.4% | 28.5%(-22.2)#52 | 24.1%(-17.7)#1,128 |
| 53. | Salem Heights | 6.4% | 28.5%(-22.1)#53 | 24.1%(-17.7)#1,137 |
| 54. | Broadview Heights | 6.5% | 28.5%(-22.0)#54 | 24.1%(-17.6)#1,162 |
| 55. | Montgomery | 6.6% | 28.5%(-21.9)#55 | 24.1%(-17.4)#1,198 |
| 56. | Canal Winchester | 6.6% | 28.5%(-21.9)#56 | 24.1%(-17.4)#1,201 |
| 57. | Belle Center | 6.7% | 28.5%(-21.9)#57 | 24.1%(-17.4)#1,227 |
| 58. | Grand Rapids | 6.9% | 28.5%(-21.6)#58 | 24.1%(-17.2)#1,296 |
| 59. | Proctorville | 6.9% | 28.5%(-21.6)#59 | 24.1%(-17.2)#1,303 |
| 60. | Seven Hills | 6.9% | 28.5%(-21.6)#60 | 24.1%(-17.1)#1,309 |
| 61. | Beckett Ridge | 7.0% | 28.5%(-21.5)#61 | 24.1%(-17.1)#1,329 |
| 62. | Northgate | 7.1% | 28.5%(-21.4)#62 | 24.1%(-17.0)#1,348 |
| 63. | Navarre | 7.1% | 28.5%(-21.4)#63 | 24.1%(-16.9)#1,362 |
| 64. | Polk | 7.1% | 28.5%(-21.4)#64 | 24.1%(-16.9)#1,384 |
| 65. | Gordon | 7.1% | 28.5%(-21.4)#65 | 24.1%(-16.9)#1,390 |
| 66. | Wilkshire Hills | 7.2% | 28.5%(-21.3)#66 | 24.1%(-16.9)#1,405 |
| 67. | Willoughby | 7.2% | 28.5%(-21.3)#67 | 24.1%(-16.9)#1,407 |
| 68. | Mayfield | 7.2% | 28.5%(-21.3)#68 | 24.1%(-16.8)#1,419 |
| 69. | Grafton | 7.3% | 28.5%(-21.2)#69 | 24.1%(-16.8)#1,433 |
| 70. | Attica | 7.3% | 28.5%(-21.2)#70 | 24.1%(-16.8)#1,437 |
| 71. | St Paris | 7.3% | 28.5%(-21.2)#71 | 24.1%(-16.7)#1,446 |
| 72. | New Franklin | 7.4% | 28.5%(-21.2)#72 | 24.1%(-16.7)#1,452 |
| 73. | Sugarcreek | 7.5% | 28.5%(-21.0)#73 | 24.1%(-16.6)#1,502 |
| 74. | Olmsted Falls | 7.5% | 28.5%(-21.0)#74 | 24.1%(-16.5)#1,524 |
| 75. | Avon Lake | 7.6% | 28.5%(-21.0)#75 | 24.1%(-16.5)#1,528 |
| 76. | Twinsburg | 7.7% | 28.5%(-20.9)#76 | 24.1%(-16.4)#1,552 |
| 77. | West Alexandria | 7.7% | 28.5%(-20.8)#77 | 24.1%(-16.4)#1,569 |
| 78. | Berlin Heights | 7.7% | 28.5%(-20.8)#78 | 24.1%(-16.4)#1,575 |
| 79. | Midway | 7.7% | 28.5%(-20.8)#79 | 24.1%(-16.4)#1,600 |
| 80. | Wren | 7.7% | 28.5%(-20.8)#80 | 24.1%(-16.4)#1,602 |
| 81. | Ashville | 7.8% | 28.5%(-20.8)#81 | 24.1%(-16.3)#1,623 |
| 82. | Eastlake | 7.9% | 28.5%(-20.6)#82 | 24.1%(-16.1)#1,680 |
| 83. | Fort Shawnee | 8.0% | 28.5%(-20.5)#83 | 24.1%(-16.0)#1,717 |
| 84. | Poland | 8.1% | 28.5%(-20.5)#84 | 24.1%(-16.0)#1,726 |
| 85. | Monroe | 8.3% | 28.5%(-20.2)#85 | 24.1%(-15.8)#1,789 |
| 86. | Thornville | 8.3% | 28.5%(-20.2)#86 | 24.1%(-15.7)#1,801 |
| 87. | Sinking Spring | 8.3% | 28.5%(-20.2)#87 | 24.1%(-15.7)#1,837 |
| 88. | Kingsville | 8.4% | 28.5%(-20.1)#88 | 24.1%(-15.7)#1,865 |
| 89. | Lincoln Village | 8.5% | 28.5%(-20.1)#89 | 24.1%(-15.6)#1,870 |
| 90. | Arlington | 8.5% | 28.5%(-20.0)#90 | 24.1%(-15.6)#1,881 |
| 91. | Liberty Center | 8.5% | 28.5%(-20.0)#91 | 24.1%(-15.6)#1,882 |
| 92. | Clinton | 8.7% | 28.5%(-19.8)#92 | 24.1%(-15.4)#1,935 |
| 93. | Hebron | 8.7% | 28.5%(-19.8)#93 | 24.1%(-15.3)#1,959 |
| 94. | Forest Park | 8.9% | 28.5%(-19.7)#94 | 24.1%(-15.2)#1,997 |
| 95. | Groveport | 9.0% | 28.5%(-19.5)#95 | 24.1%(-15.1)#2,033 |
| 96. | Hilliard | 9.0% | 28.5%(-19.5)#96 | 24.1%(-15.1)#2,035 |
| 97. | Terrace Park | 9.1% | 28.5%(-19.4)#97 | 24.1%(-15.0)#2,055 |
| 98. | West Unity | 9.1% | 28.5%(-19.4)#98 | 24.1%(-15.0)#2,058 |
| 99. | Clarington | 9.1% | 28.5%(-19.4)#99 | 24.1%(-15.0)#2,093 |
| 100. | Martinsburg | 9.1% | 28.5%(-19.4)#100 | 24.1%(-15.0)#2,098 |
Common Questions
What are the Top 10 Cities with the Lowest Poverty Level Among Single Females in Ohio?
Top 10 Cities with the Lowest Poverty Level Among Single Females in Ohio are:
#1
1.6%
#2
2.1%
#3
2.2%
#4
2.2%
#5
2.6%
#6
2.7%
#7
2.9%
#8
3.1%
#9
3.1%
#10
3.2%
What city has the Lowest Poverty Level Among Single Females in Ohio?
Grand River has the Lowest Poverty Level Among Single Females in Ohio with 1.6%.
What is the Poverty Level Among Single Females in the State of Ohio?
Poverty Level Among Single Females in Ohio is 28.5%.
What is the Poverty Level Among Single Females in the United States?
Poverty Level Among Single Females in the United States is 24.1%.