Sunnyside, CA Map & Demographics
Sunnyside Map
Sunnyside Overview
$39,018
PER CAPITA INCOME
$127,881
AVG FAMILY INCOME
$106,750
AVG HOUSEHOLD INCOME
34.7%
WAGE / INCOME GAP [ % ]
65.3¢/ $1
WAGE / INCOME GAP [ $ ]
0.44
INEQUALITY / GINI INDEX
4,565
TOTAL POPULATION
2,268
MALE POPULATION
2,297
FEMALE POPULATION
98.74
MALES / 100 FEMALES
101.28
FEMALES / 100 MALES
39.8
MEDIAN AGE
3.5
AVG FAMILY SIZE
3.1
AVG HOUSEHOLD SIZE
2,267
LABOR FORCE [ PEOPLE ]
61.7%
PERCENT IN LABOR FORCE
5.7%
UNEMPLOYMENT RATE
Income in Sunnyside
Income Overview in Sunnyside
Per Capita Income in Sunnyside is $39,018, while median incomes of families and households are $127,881 and $106,750 respectively.
| Characteristic | Number | Measure |
| Per Capita Income | 4,565 | $39,018 |
| Median Family Income | 1,174 | $127,881 |
| Mean Family Income | 1,174 | $145,152 |
| Median Household Income | 1,491 | $106,750 |
| Mean Household Income | 1,491 | $125,745 |
| Income Deficit | 1,174 | $0 |
| Wage / Income Gap (%) | 4,565 | 34.68% |
| Wage / Income Gap ($) | 4,565 | 65.32¢ per $1 |
| Gini / Inequality Index | 4,565 | 0.44 |
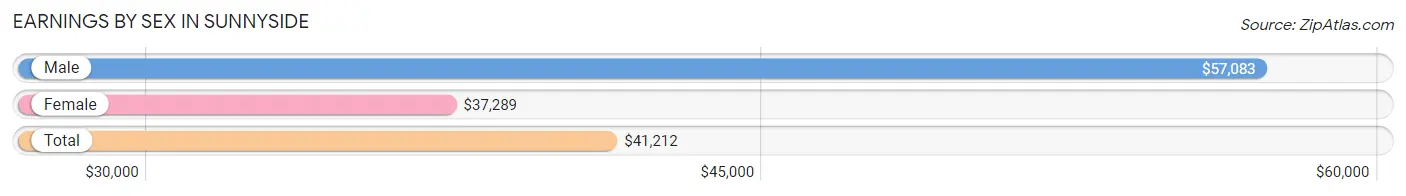
Earnings by Sex in Sunnyside
Average Earnings in Sunnyside are $41,212, $57,083 for men and $37,289 for women, a difference of 34.7%.
| Sex | Number | Average Earnings |
| Male | 1,224 (52.3%) | $57,083 |
| Female | 1,117 (47.7%) | $37,289 |
| Total | 2,341 (100.0%) | $41,212 |
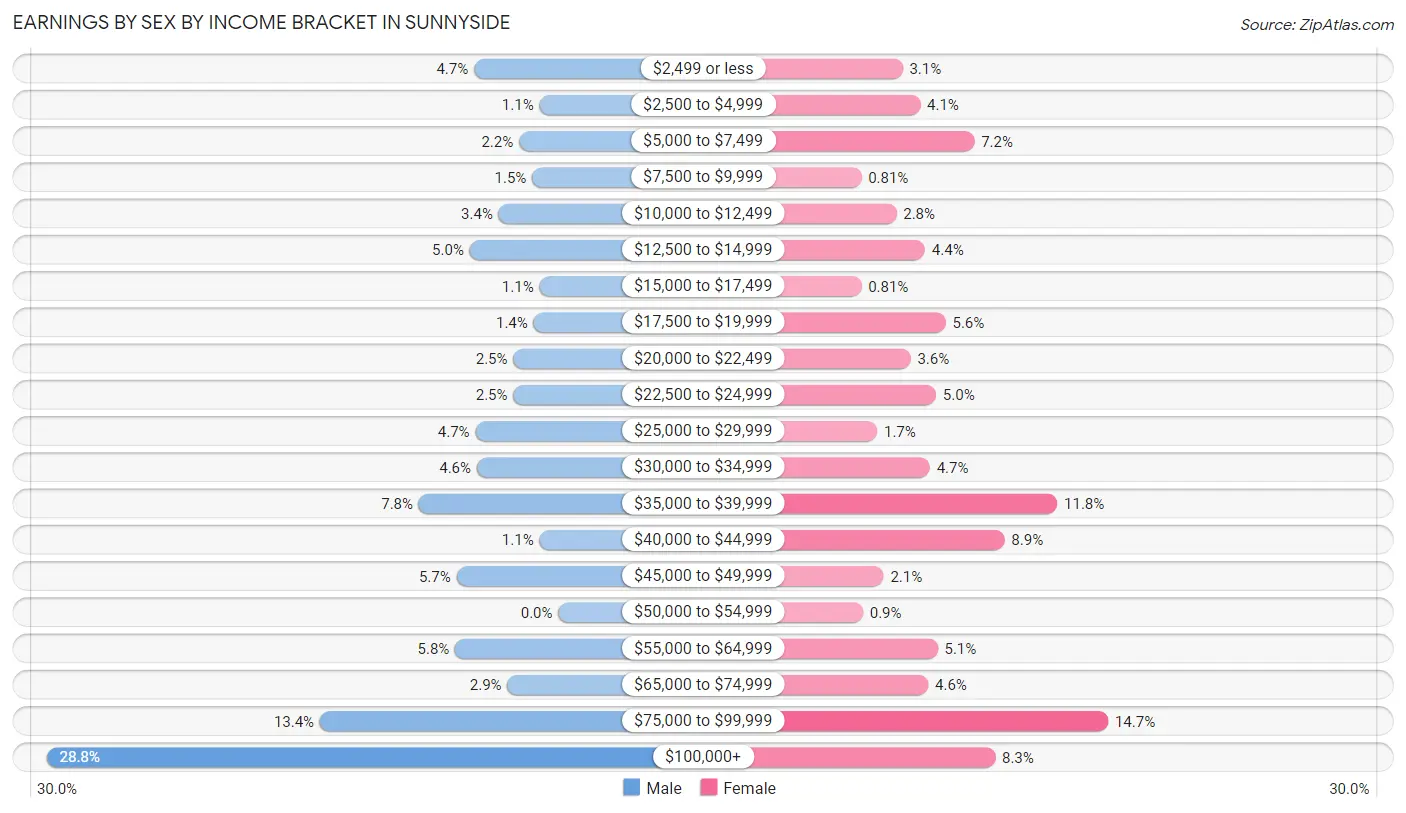
Earnings by Sex by Income Bracket in Sunnyside
The most common earnings brackets in Sunnyside are $100,000+ for men (352 | 28.8%) and $75,000 to $99,999 for women (164 | 14.7%).
| Income | Male | Female |
| $2,499 or less | 58 (4.7%) | 35 (3.1%) |
| $2,500 to $4,999 | 13 (1.1%) | 46 (4.1%) |
| $5,000 to $7,499 | 27 (2.2%) | 80 (7.2%) |
| $7,500 to $9,999 | 18 (1.5%) | 9 (0.8%) |
| $10,000 to $12,499 | 41 (3.4%) | 31 (2.8%) |
| $12,500 to $14,999 | 61 (5.0%) | 49 (4.4%) |
| $15,000 to $17,499 | 13 (1.1%) | 9 (0.8%) |
| $17,500 to $19,999 | 17 (1.4%) | 62 (5.6%) |
| $20,000 to $22,499 | 31 (2.5%) | 40 (3.6%) |
| $22,500 to $24,999 | 31 (2.5%) | 56 (5.0%) |
| $25,000 to $29,999 | 57 (4.7%) | 19 (1.7%) |
| $30,000 to $34,999 | 56 (4.6%) | 52 (4.7%) |
| $35,000 to $39,999 | 96 (7.8%) | 132 (11.8%) |
| $40,000 to $44,999 | 13 (1.1%) | 99 (8.9%) |
| $45,000 to $49,999 | 70 (5.7%) | 23 (2.1%) |
| $50,000 to $54,999 | 0 (0.0%) | 10 (0.9%) |
| $55,000 to $64,999 | 71 (5.8%) | 57 (5.1%) |
| $65,000 to $74,999 | 35 (2.9%) | 51 (4.6%) |
| $75,000 to $99,999 | 164 (13.4%) | 164 (14.7%) |
| $100,000+ | 352 (28.8%) | 93 (8.3%) |
| Total | 1,224 (100.0%) | 1,117 (100.0%) |
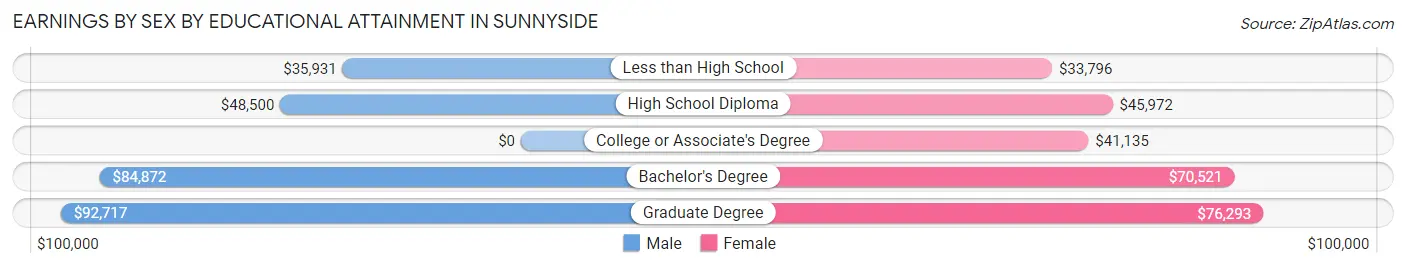
Earnings by Sex by Educational Attainment in Sunnyside
Average earnings in Sunnyside are $63,963 for men and $39,205 for women, a difference of 38.7%. Men with an educational attainment of graduate degree enjoy the highest average annual earnings of $92,717, while those with less than high school education earn the least with $35,931. Women with an educational attainment of graduate degree earn the most with the average annual earnings of $76,293, while those with less than high school education have the smallest earnings of $33,796.
| Educational Attainment | Male Income | Female Income |
| Less than High School | $35,931 | $33,796 |
| High School Diploma | $48,500 | $45,972 |
| College or Associate's Degree | - | - |
| Bachelor's Degree | $84,872 | $70,521 |
| Graduate Degree | $92,717 | $76,293 |
| Total | $63,963 | $39,205 |
Family Income in Sunnyside
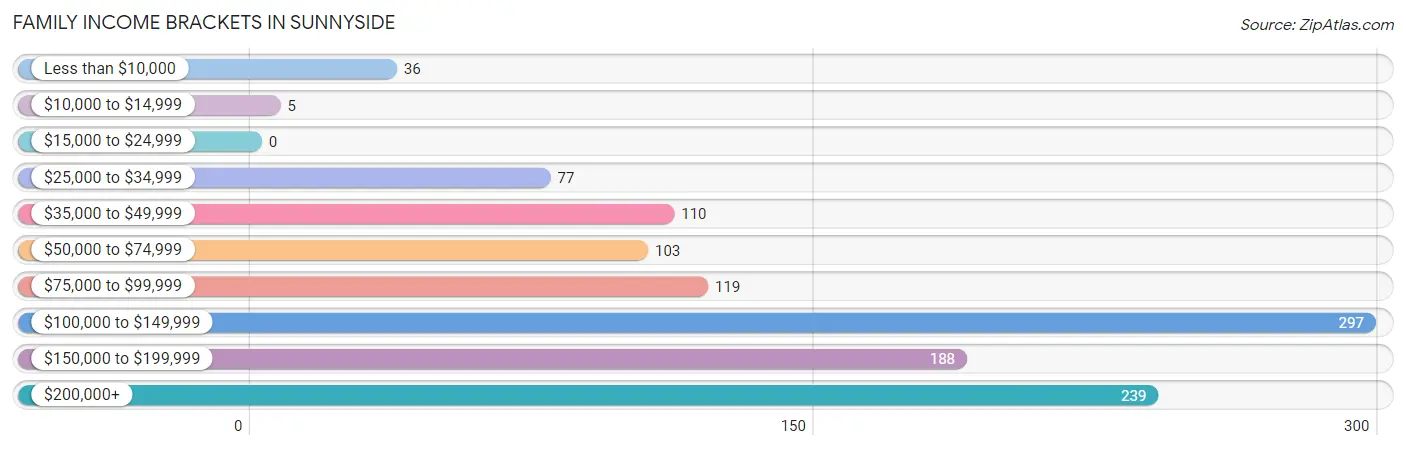
Family Income Brackets in Sunnyside
According to the Sunnyside family income data, there are 297 families falling into the $100,000 to $149,999 income range, which is the most common income bracket and makes up 25.3% of all families.
| Income Bracket | # Families | % Families |
| Less than $10,000 | 36 | 3.1% |
| $10,000 to $14,999 | 5 | 0.4% |
| $15,000 to $24,999 | 0 | 0.0% |
| $25,000 to $34,999 | 77 | 6.6% |
| $35,000 to $49,999 | 110 | 9.4% |
| $50,000 to $74,999 | 103 | 8.8% |
| $75,000 to $99,999 | 119 | 10.1% |
| $100,000 to $149,999 | 297 | 25.3% |
| $150,000 to $199,999 | 188 | 16.0% |
| $200,000+ | 239 | 20.4% |
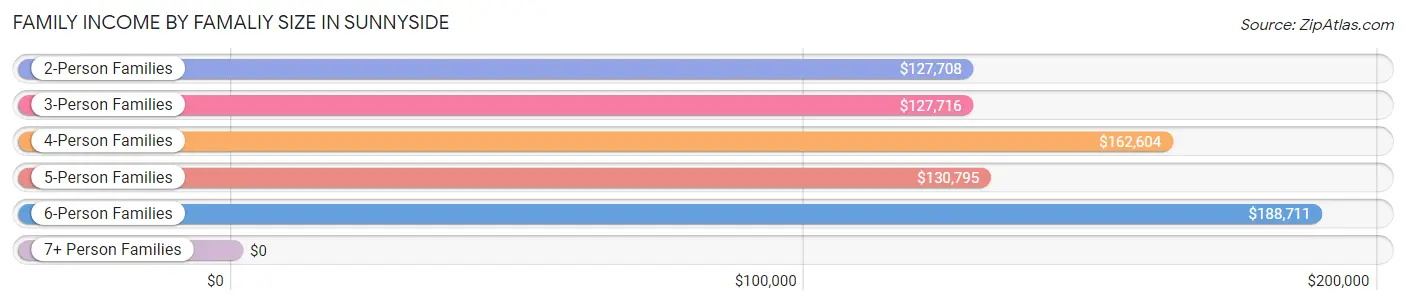
Family Income by Famaliy Size in Sunnyside
6-person families (73 | 6.2%) account for the highest median family income in Sunnyside with $188,711 per family, while 2-person families (519 | 44.2%) have the highest median income of $63,854 per family member.
| Income Bracket | # Families | Median Income |
| 2-Person Families | 519 (44.2%) | $127,708 |
| 3-Person Families | 163 (13.9%) | $127,716 |
| 4-Person Families | 258 (22.0%) | $162,604 |
| 5-Person Families | 113 (9.6%) | $130,795 |
| 6-Person Families | 73 (6.2%) | $188,711 |
| 7+ Person Families | 48 (4.1%) | $0 |
| Total | 1,174 (100.0%) | $127,881 |
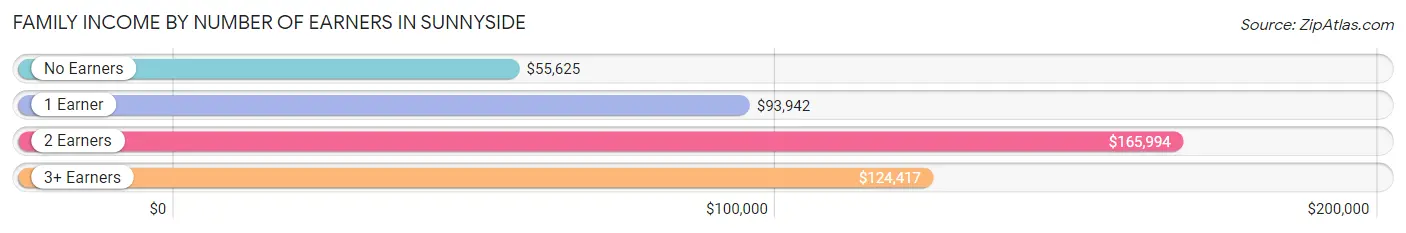
Family Income by Number of Earners in Sunnyside
The median family income in Sunnyside is $127,881, with families comprising 2 earners (465) having the highest median family income of $165,994, while families with no earners (131) have the lowest median family income of $55,625, accounting for 39.6% and 11.2% of families, respectively.
| Number of Earners | # Families | Median Income |
| No Earners | 131 (11.2%) | $55,625 |
| 1 Earner | 363 (30.9%) | $93,942 |
| 2 Earners | 465 (39.6%) | $165,994 |
| 3+ Earners | 215 (18.3%) | $124,417 |
| Total | 1,174 (100.0%) | $127,881 |
Household Income in Sunnyside
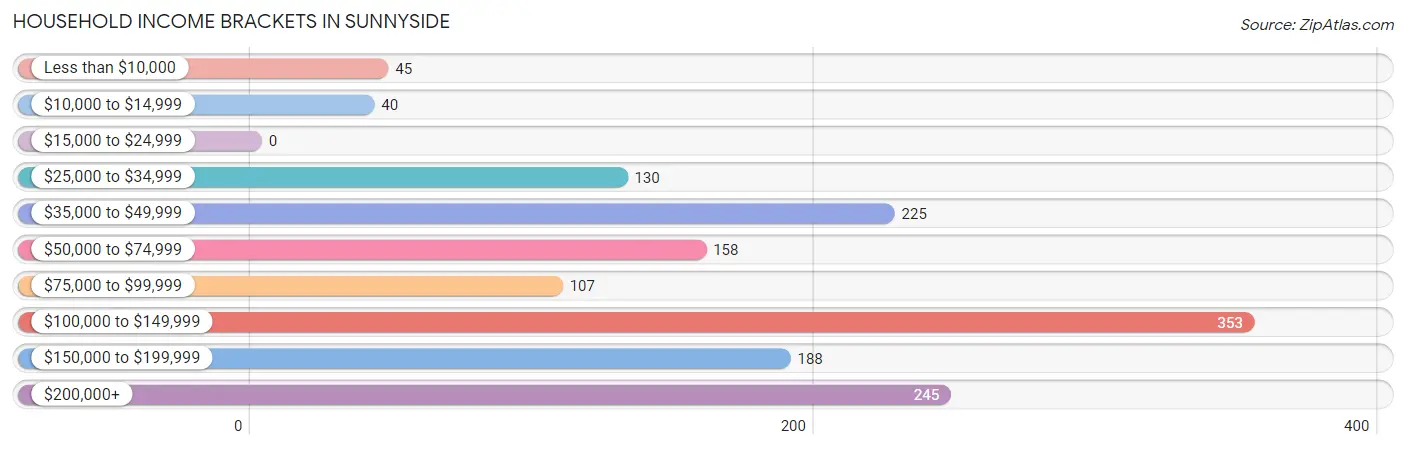
Household Income Brackets in Sunnyside
With 353 households falling in the category, the $100,000 to $149,999 income range is the most frequent in Sunnyside, accounting for 23.7% of all households.
| Income Bracket | # Households | % Households |
| Less than $10,000 | 45 | 3.0% |
| $10,000 to $14,999 | 40 | 2.7% |
| $15,000 to $24,999 | 0 | 0.0% |
| $25,000 to $34,999 | 130 | 8.7% |
| $35,000 to $49,999 | 225 | 15.1% |
| $50,000 to $74,999 | 158 | 10.6% |
| $75,000 to $99,999 | 107 | 7.2% |
| $100,000 to $149,999 | 353 | 23.7% |
| $150,000 to $199,999 | 188 | 12.6% |
| $200,000+ | 245 | 16.4% |
Household Income by Householder Age in Sunnyside
The median household income in Sunnyside is $106,750, with the highest median household income of $130,263 found in the 45 to 64 years age bracket for the primary householder. A total of 530 households (35.5%) fall into this category.
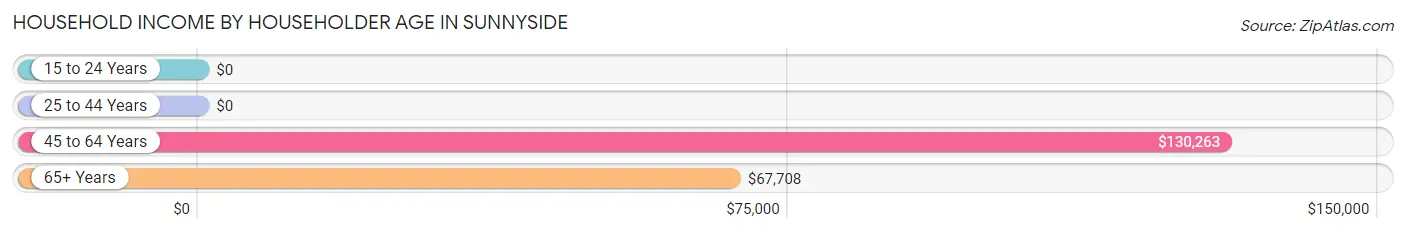
| Income Bracket | # Households | Median Income |
| 15 to 24 Years | 0 (0.0%) | $0 |
| 25 to 44 Years | 448 (30.0%) | $0 |
| 45 to 64 Years | 530 (35.5%) | $130,263 |
| 65+ Years | 513 (34.4%) | $67,708 |
| Total | 1,491 (100.0%) | $106,750 |
Poverty in Sunnyside
Income Below Poverty by Sex and Age in Sunnyside
With 12.0% poverty level for males and 11.3% for females among the residents of Sunnyside, 5 year old males and 5 year old females are the most vulnerable to poverty, with 21 males (58.3%) and 20 females (43.5%) in their respective age groups living below the poverty level.
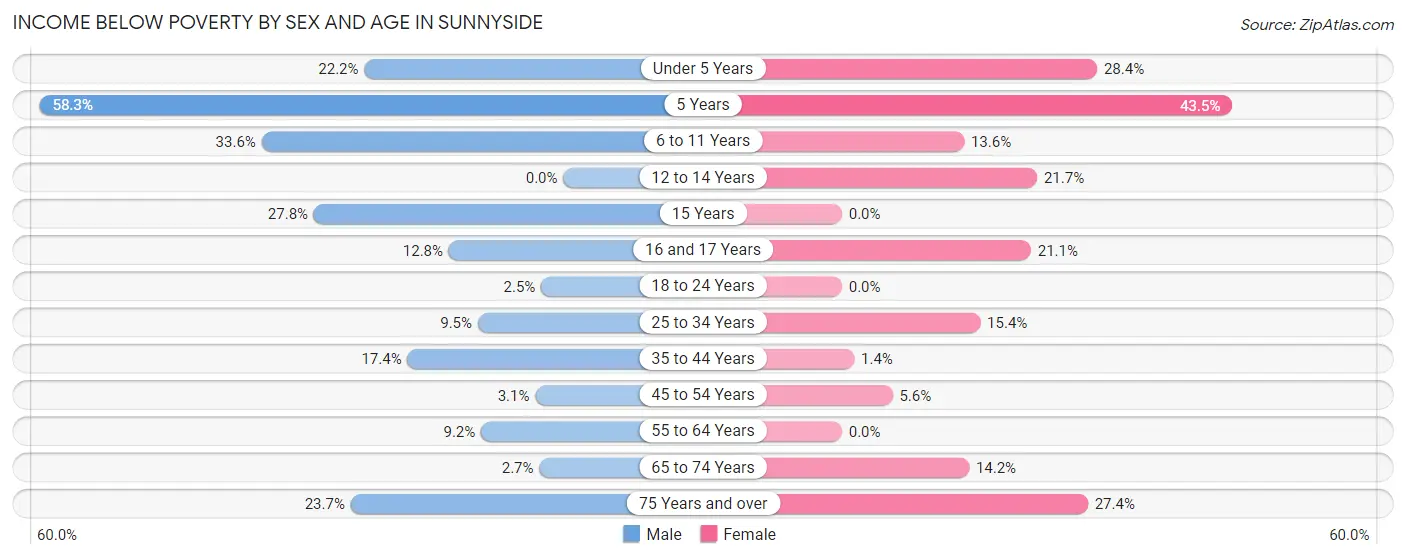
| Age Bracket | Male | Female |
| Under 5 Years | 39 (22.2%) | 27 (28.4%) |
| 5 Years | 21 (58.3%) | 20 (43.5%) |
| 6 to 11 Years | 42 (33.6%) | 20 (13.6%) |
| 12 to 14 Years | 0 (0.0%) | 20 (21.7%) |
| 15 Years | 10 (27.8%) | 0 (0.0%) |
| 16 and 17 Years | 19 (12.8%) | 4 (21.0%) |
| 18 to 24 Years | 4 (2.5%) | 0 (0.0%) |
| 25 to 34 Years | 28 (9.5%) | 57 (15.4%) |
| 35 to 44 Years | 50 (17.4%) | 4 (1.4%) |
| 45 to 54 Years | 9 (3.1%) | 15 (5.6%) |
| 55 to 64 Years | 23 (9.2%) | 0 (0.0%) |
| 65 to 74 Years | 7 (2.7%) | 50 (14.2%) |
| 75 Years and over | 18 (23.7%) | 43 (27.4%) |
| Total | 270 (12.0%) | 260 (11.3%) |
Income Above Poverty by Sex and Age in Sunnyside
According to the poverty statistics in Sunnyside, males aged 12 to 14 years and females aged 15 years are the age groups that are most secure financially, with 100.0% of males and 100.0% of females in these age groups living above the poverty line.
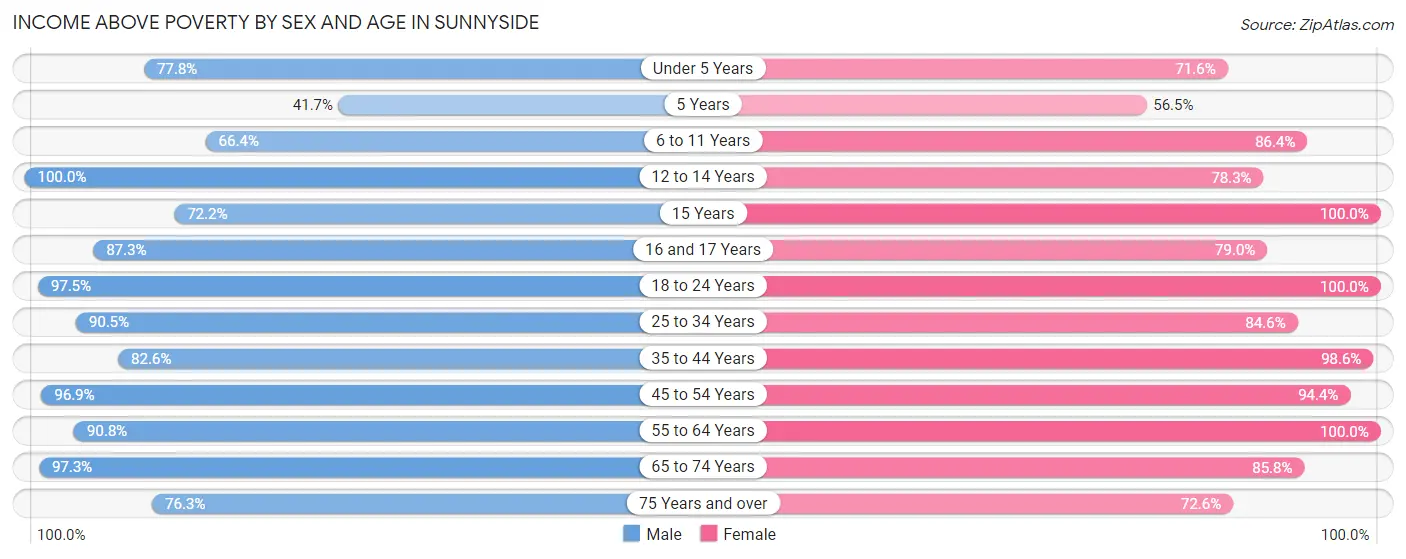
| Age Bracket | Male | Female |
| Under 5 Years | 137 (77.8%) | 68 (71.6%) |
| 5 Years | 15 (41.7%) | 26 (56.5%) |
| 6 to 11 Years | 83 (66.4%) | 127 (86.4%) |
| 12 to 14 Years | 112 (100.0%) | 72 (78.3%) |
| 15 Years | 26 (72.2%) | 13 (100.0%) |
| 16 and 17 Years | 130 (87.3%) | 15 (78.9%) |
| 18 to 24 Years | 158 (97.5%) | 164 (100.0%) |
| 25 to 34 Years | 266 (90.5%) | 313 (84.6%) |
| 35 to 44 Years | 238 (82.6%) | 288 (98.6%) |
| 45 to 54 Years | 279 (96.9%) | 251 (94.4%) |
| 55 to 64 Years | 228 (90.8%) | 283 (100.0%) |
| 65 to 74 Years | 255 (97.3%) | 303 (85.8%) |
| 75 Years and over | 58 (76.3%) | 114 (72.6%) |
| Total | 1,985 (88.0%) | 2,037 (88.7%) |
Income Below Poverty Among Married-Couple Families in Sunnyside
The poverty statistics for married-couple families in Sunnyside show that 8.0% or 80 of the total 997 families live below the poverty line. Families with 5 or more children have the highest poverty rate of 100.0%, comprising of 20 families. On the other hand, families with 3 or 4 children have the lowest poverty rate of 0.0%, which includes 0 families.
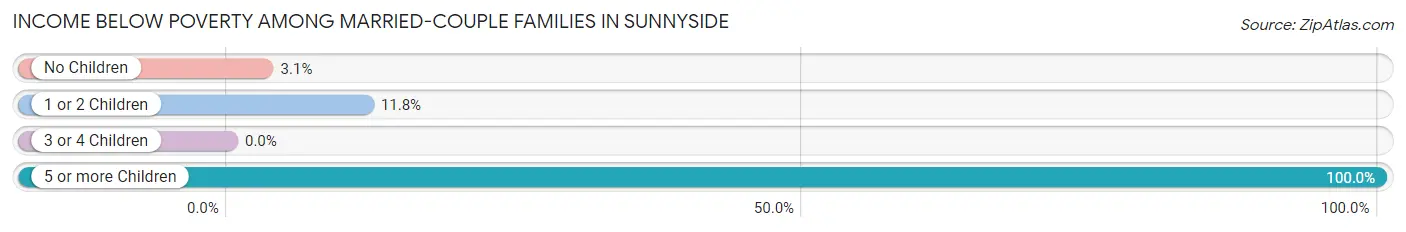
| Children | Above Poverty | Below Poverty |
| No Children | 563 (96.9%) | 18 (3.1%) |
| 1 or 2 Children | 313 (88.2%) | 42 (11.8%) |
| 3 or 4 Children | 41 (100.0%) | 0 (0.0%) |
| 5 or more Children | 0 (0.0%) | 20 (100.0%) |
| Total | 917 (92.0%) | 80 (8.0%) |
Income Below Poverty Among Single-Parent Households in Sunnyside
According to the poverty data in Sunnyside, 32.4% or 12 single-father households and 4.3% or 6 single-mother households are living below the poverty line. Among single-father households, those with 3 or 4 children have the highest poverty rate, with 12 households (100.0%) experiencing poverty. Likewise, among single-mother households, those with no children have the highest poverty rate, with 6 households (6.8%) falling below the poverty line.
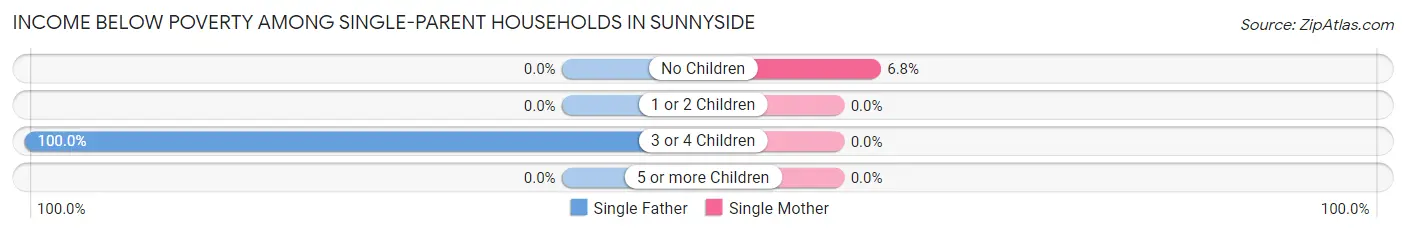
| Children | Single Father | Single Mother |
| No Children | 0 (0.0%) | 6 (6.8%) |
| 1 or 2 Children | 0 (0.0%) | 0 (0.0%) |
| 3 or 4 Children | 12 (100.0%) | 0 (0.0%) |
| 5 or more Children | 0 (0.0%) | 0 (0.0%) |
| Total | 12 (32.4%) | 6 (4.3%) |
Income Below Poverty Among Married-Couple vs Single-Parent Households in Sunnyside
The poverty data for Sunnyside shows that 80 of the married-couple family households (8.0%) and 18 of the single-parent households (10.2%) are living below the poverty level. Within the married-couple family households, those with 5 or more children have the highest poverty rate, with 20 households (100.0%) falling below the poverty line. Among the single-parent households, those with 3 or 4 children have the highest poverty rate, with 12 household (29.3%) living below poverty.
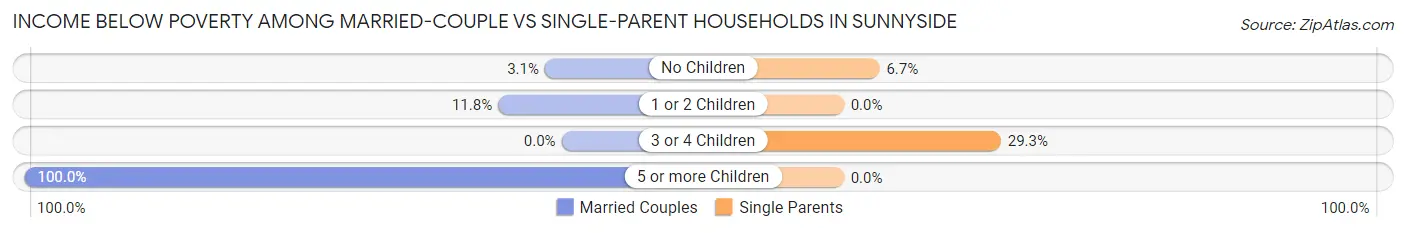
| Children | Married-Couple Families | Single-Parent Households |
| No Children | 18 (3.1%) | 6 (6.7%) |
| 1 or 2 Children | 42 (11.8%) | 0 (0.0%) |
| 3 or 4 Children | 0 (0.0%) | 12 (29.3%) |
| 5 or more Children | 20 (100.0%) | 0 (0.0%) |
| Total | 80 (8.0%) | 18 (10.2%) |
Race in Sunnyside
The most populous races in Sunnyside are White / Caucasian (2,316 | 50.7%), Hispanic or Latino (2,274 | 49.8%), and Two or more Races (1,075 | 23.5%).
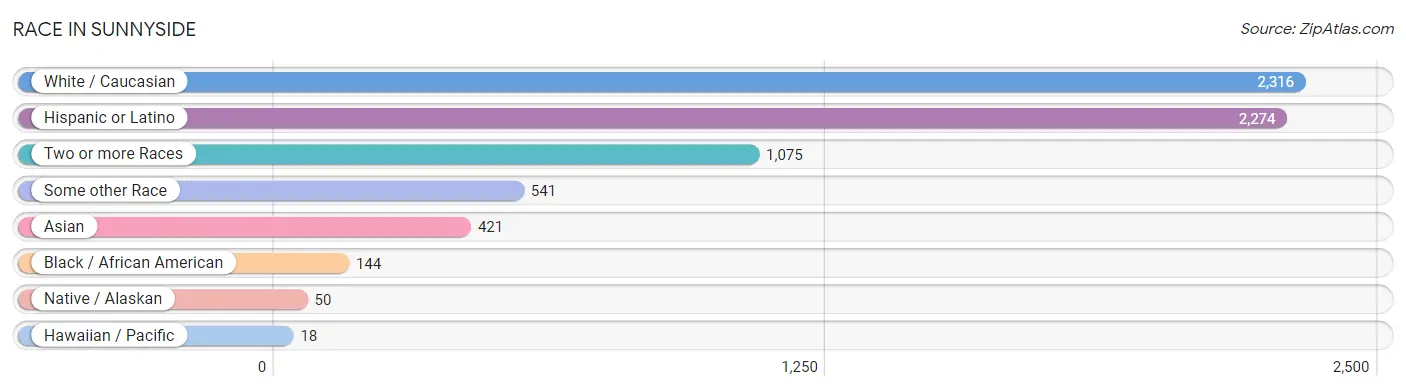
| Race | # Population | % Population |
| Asian | 421 | 9.2% |
| Black / African American | 144 | 3.2% |
| Hawaiian / Pacific | 18 | 0.4% |
| Hispanic or Latino | 2,274 | 49.8% |
| Native / Alaskan | 50 | 1.1% |
| White / Caucasian | 2,316 | 50.7% |
| Two or more Races | 1,075 | 23.5% |
| Some other Race | 541 | 11.8% |
| Total | 4,565 | 100.0% |
Ancestry in Sunnyside
The most populous ancestries reported in Sunnyside are Mexican (2,224 | 48.7%), Irish (323 | 7.1%), German (320 | 7.0%), English (285 | 6.2%), and Armenian (191 | 4.2%), together accounting for 73.2% of all Sunnyside residents.
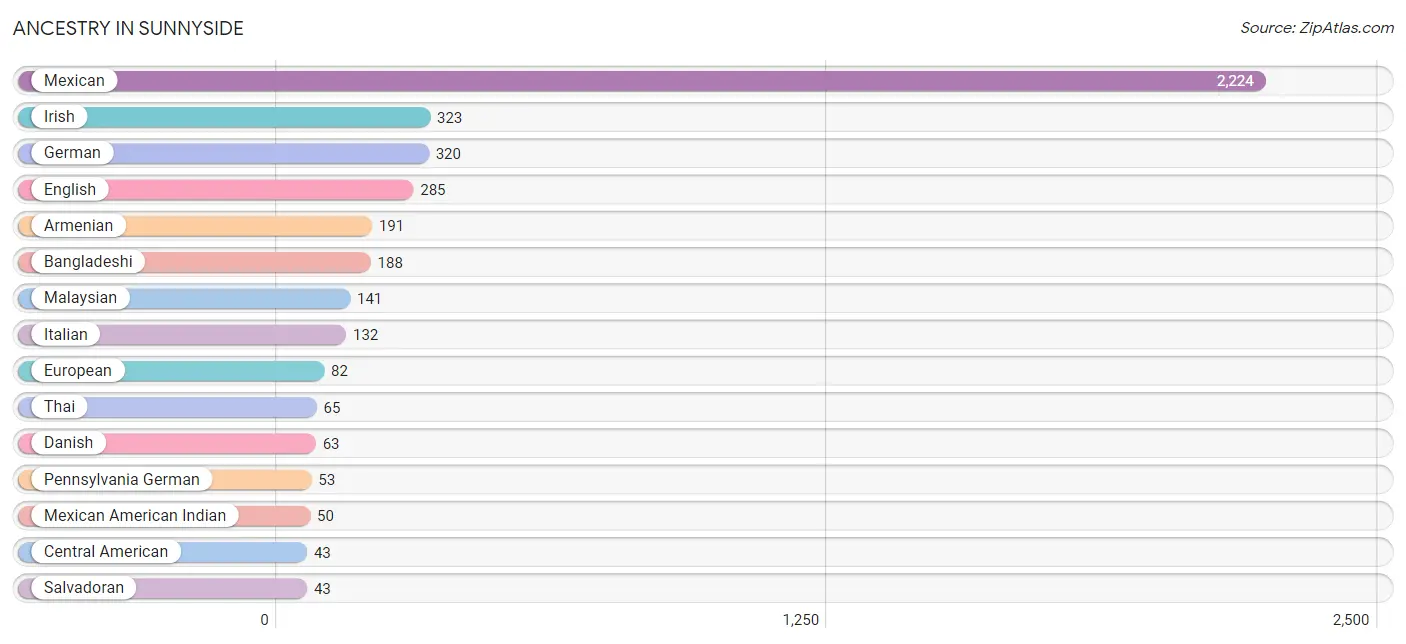
| Ancestry | # Population | % Population |
| American | 29 | 0.6% |
| Arab | 24 | 0.5% |
| Armenian | 191 | 4.2% |
| Australian | 12 | 0.3% |
| Bangladeshi | 188 | 4.1% |
| Brazilian | 9 | 0.2% |
| British | 32 | 0.7% |
| Central American | 43 | 0.9% |
| Czechoslovakian | 12 | 0.3% |
| Danish | 63 | 1.4% |
| Dutch | 10 | 0.2% |
| English | 285 | 6.2% |
| European | 82 | 1.8% |
| Finnish | 4 | 0.1% |
| French | 37 | 0.8% |
| French Canadian | 20 | 0.4% |
| German | 320 | 7.0% |
| Hopi | 4 | 0.1% |
| Hungarian | 4 | 0.1% |
| Indian (Asian) | 40 | 0.9% |
| Irish | 323 | 7.1% |
| Italian | 132 | 2.9% |
| Japanese | 18 | 0.4% |
| Korean | 5 | 0.1% |
| Laotian | 3 | 0.1% |
| Lithuanian | 9 | 0.2% |
| Malaysian | 141 | 3.1% |
| Mexican | 2,224 | 48.7% |
| Mexican American Indian | 50 | 1.1% |
| Native Hawaiian | 18 | 0.4% |
| Norwegian | 17 | 0.4% |
| Pakistani | 10 | 0.2% |
| Pennsylvania German | 53 | 1.2% |
| Polish | 13 | 0.3% |
| Portuguese | 15 | 0.3% |
| Salvadoran | 43 | 0.9% |
| Scottish | 21 | 0.5% |
| Slavic | 5 | 0.1% |
| Spanish | 7 | 0.2% |
| Swedish | 28 | 0.6% |
| Swiss | 11 | 0.2% |
| Thai | 65 | 1.4% |
| Welsh | 27 | 0.6% |
| Yugoslavian | 7 | 0.2% | View All 44 Rows |
Immigrants in Sunnyside
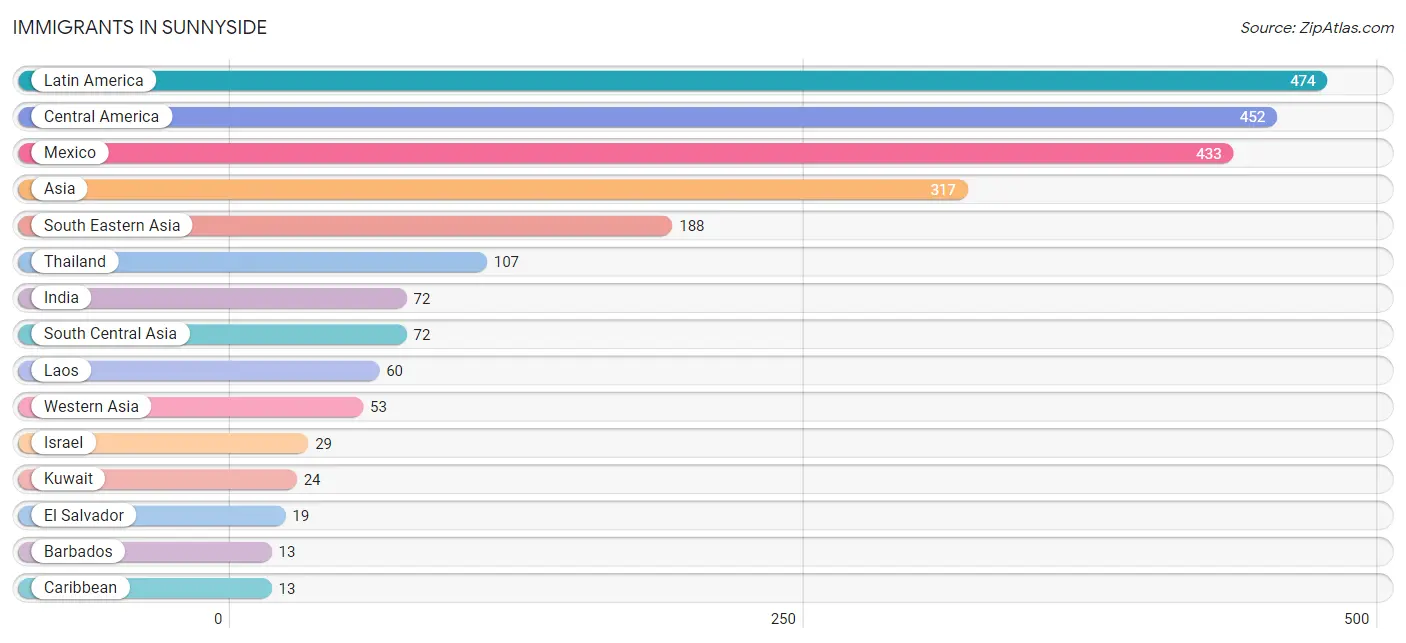
The most numerous immigrant groups reported in Sunnyside came from Latin America (474 | 10.4%), Central America (452 | 9.9%), Mexico (433 | 9.5%), Asia (317 | 6.9%), and South Eastern Asia (188 | 4.1%), together accounting for 40.8% of all Sunnyside residents.
| Immigration Origin | # Population | % Population |
| Asia | 317 | 6.9% |
| Barbados | 13 | 0.3% |
| Brazil | 9 | 0.2% |
| Cambodia | 9 | 0.2% |
| Caribbean | 13 | 0.3% |
| Central America | 452 | 9.9% |
| China | 4 | 0.1% |
| Eastern Asia | 4 | 0.1% |
| El Salvador | 19 | 0.4% |
| India | 72 | 1.6% |
| Israel | 29 | 0.6% |
| Kuwait | 24 | 0.5% |
| Laos | 60 | 1.3% |
| Latin America | 474 | 10.4% |
| Malaysia | 7 | 0.2% |
| Mexico | 433 | 9.5% |
| Philippines | 5 | 0.1% |
| South America | 9 | 0.2% |
| South Central Asia | 72 | 1.6% |
| South Eastern Asia | 188 | 4.1% |
| Thailand | 107 | 2.3% |
| Western Asia | 53 | 1.2% | View All 22 Rows |
Sex and Age in Sunnyside
Sex and Age in Sunnyside
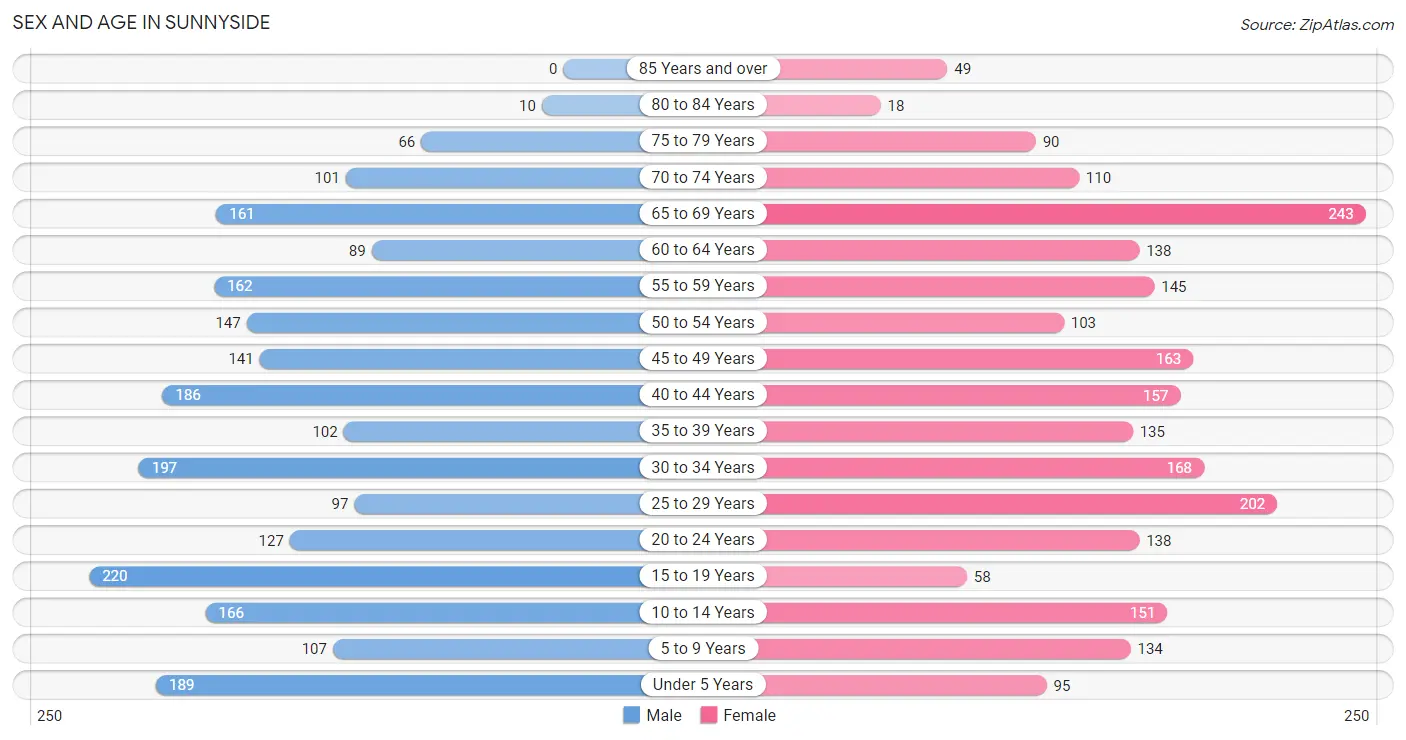
The most populous age groups in Sunnyside are 15 to 19 Years (220 | 9.7%) for men and 65 to 69 Years (243 | 10.6%) for women.
| Age Bracket | Male | Female |
| Under 5 Years | 189 (8.3%) | 95 (4.1%) |
| 5 to 9 Years | 107 (4.7%) | 134 (5.8%) |
| 10 to 14 Years | 166 (7.3%) | 151 (6.6%) |
| 15 to 19 Years | 220 (9.7%) | 58 (2.5%) |
| 20 to 24 Years | 127 (5.6%) | 138 (6.0%) |
| 25 to 29 Years | 97 (4.3%) | 202 (8.8%) |
| 30 to 34 Years | 197 (8.7%) | 168 (7.3%) |
| 35 to 39 Years | 102 (4.5%) | 135 (5.9%) |
| 40 to 44 Years | 186 (8.2%) | 157 (6.8%) |
| 45 to 49 Years | 141 (6.2%) | 163 (7.1%) |
| 50 to 54 Years | 147 (6.5%) | 103 (4.5%) |
| 55 to 59 Years | 162 (7.1%) | 145 (6.3%) |
| 60 to 64 Years | 89 (3.9%) | 138 (6.0%) |
| 65 to 69 Years | 161 (7.1%) | 243 (10.6%) |
| 70 to 74 Years | 101 (4.4%) | 110 (4.8%) |
| 75 to 79 Years | 66 (2.9%) | 90 (3.9%) |
| 80 to 84 Years | 10 (0.4%) | 18 (0.8%) |
| 85 Years and over | 0 (0.0%) | 49 (2.1%) |
| Total | 2,268 (100.0%) | 2,297 (100.0%) |
Families and Households in Sunnyside
Median Family Size in Sunnyside
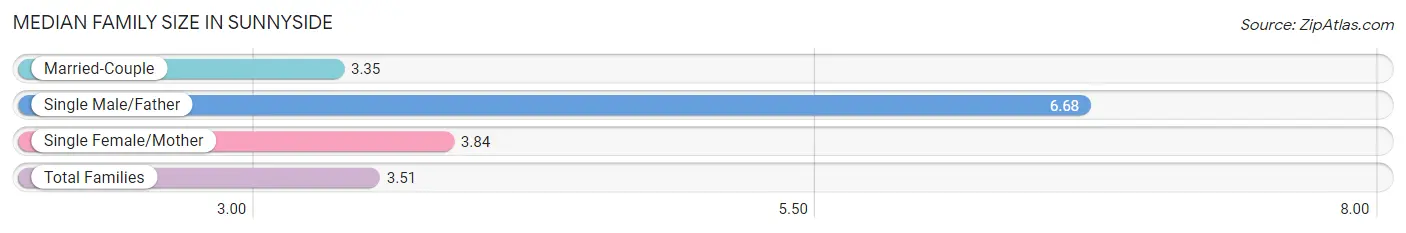
The median family size in Sunnyside is 3.51 persons per family, with single male/father families (37 | 3.2%) accounting for the largest median family size of 6.68 persons per family. On the other hand, married-couple families (997 | 84.9%) represent the smallest median family size with 3.35 persons per family.
| Family Type | # Families | Family Size |
| Married-Couple | 997 (84.9%) | 3.35 |
| Single Male/Father | 37 (3.2%) | 6.68 |
| Single Female/Mother | 140 (11.9%) | 3.84 |
| Total Families | 1,174 (100.0%) | 3.51 |
Median Household Size in Sunnyside
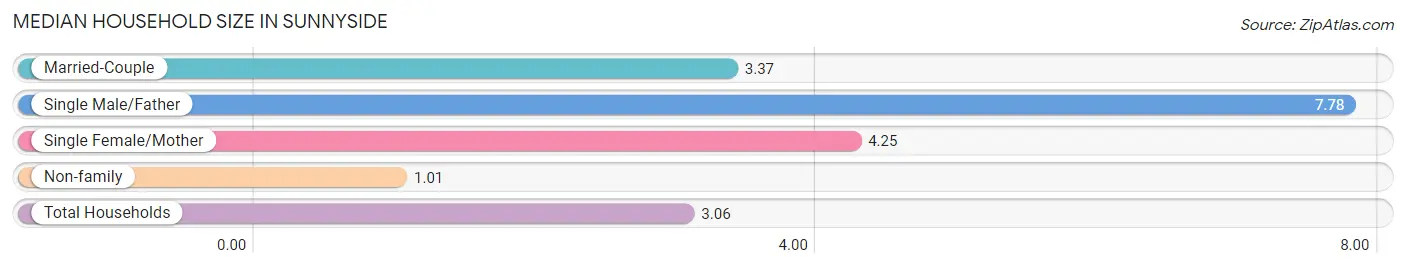
The median household size in Sunnyside is 3.06 persons per household, with single male/father households (37 | 2.5%) accounting for the largest median household size of 7.78 persons per household. non-family households (317 | 21.3%) represent the smallest median household size with 1.01 persons per household.
| Household Type | # Households | Household Size |
| Married-Couple | 997 (66.9%) | 3.37 |
| Single Male/Father | 37 (2.5%) | 7.78 |
| Single Female/Mother | 140 (9.4%) | 4.25 |
| Non-family | 317 (21.3%) | 1.01 |
| Total Households | 1,491 (100.0%) | 3.06 |
Household Size by Marriage Status in Sunnyside
Out of a total of 1,491 households in Sunnyside, 1,174 (78.7%) are family households, while 317 (21.3%) are nonfamily households. The most numerous type of family households are 2-person households, comprising 504, and the most common type of nonfamily households are 1-person households, comprising 314.
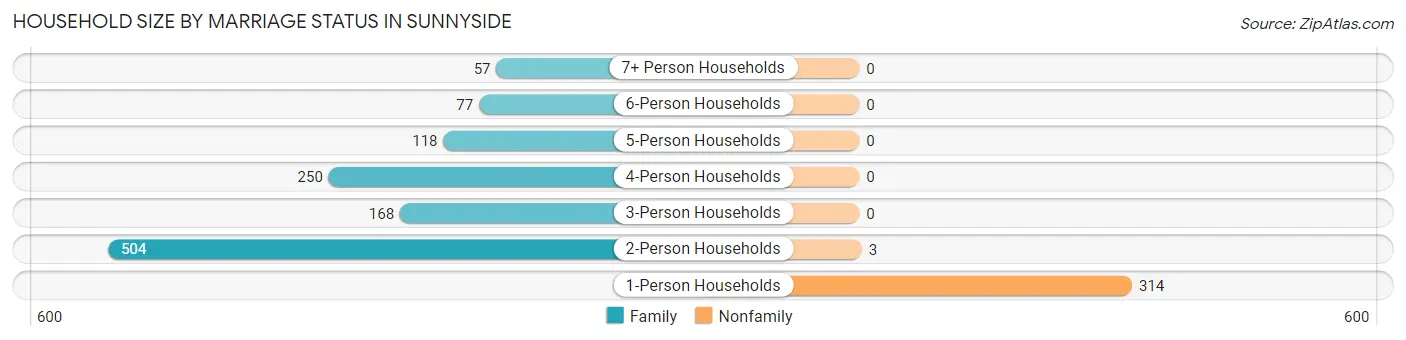
| Household Size | Family Households | Nonfamily Households |
| 1-Person Households | - | 314 (21.1%) |
| 2-Person Households | 504 (33.8%) | 3 (0.2%) |
| 3-Person Households | 168 (11.3%) | 0 (0.0%) |
| 4-Person Households | 250 (16.8%) | 0 (0.0%) |
| 5-Person Households | 118 (7.9%) | 0 (0.0%) |
| 6-Person Households | 77 (5.2%) | 0 (0.0%) |
| 7+ Person Households | 57 (3.8%) | 0 (0.0%) |
| Total | 1,174 (78.7%) | 317 (21.3%) |
Female Fertility in Sunnyside
Fertility by Age in Sunnyside
Average fertility rate in Sunnyside is 19.0 births per 1,000 women. Women in the age bracket of 20 to 34 years have the highest fertility rate with 39.0 births per 1,000 women. Women in the age bracket of 20 to 34 years acount for 100.0% of all women with births.
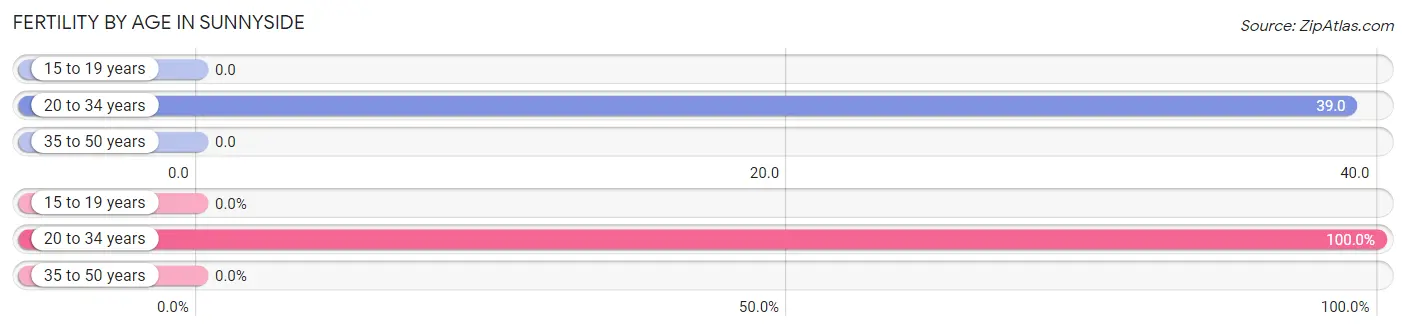
| Age Bracket | Women with Births | Births / 1,000 Women |
| 15 to 19 years | 0 (0.0%) | 0.0 |
| 20 to 34 years | 20 (100.0%) | 39.0 |
| 35 to 50 years | 0 (0.0%) | 0.0 |
| Total | 20 (100.0%) | 19.0 |
Fertility by Age by Marriage Status in Sunnyside
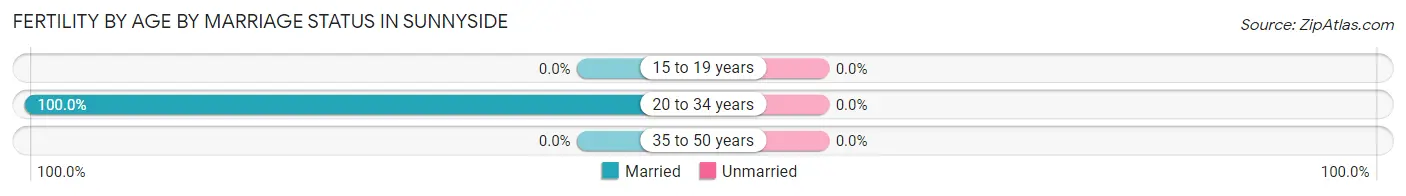
| Age Bracket | Married | Unmarried |
| 15 to 19 years | 0 (0.0%) | 0 (0.0%) |
| 20 to 34 years | 20 (100.0%) | 0 (0.0%) |
| 35 to 50 years | 0 (0.0%) | 0 (0.0%) |
| Total | 20 (100.0%) | 0 (0.0%) |
Fertility by Education in Sunnyside
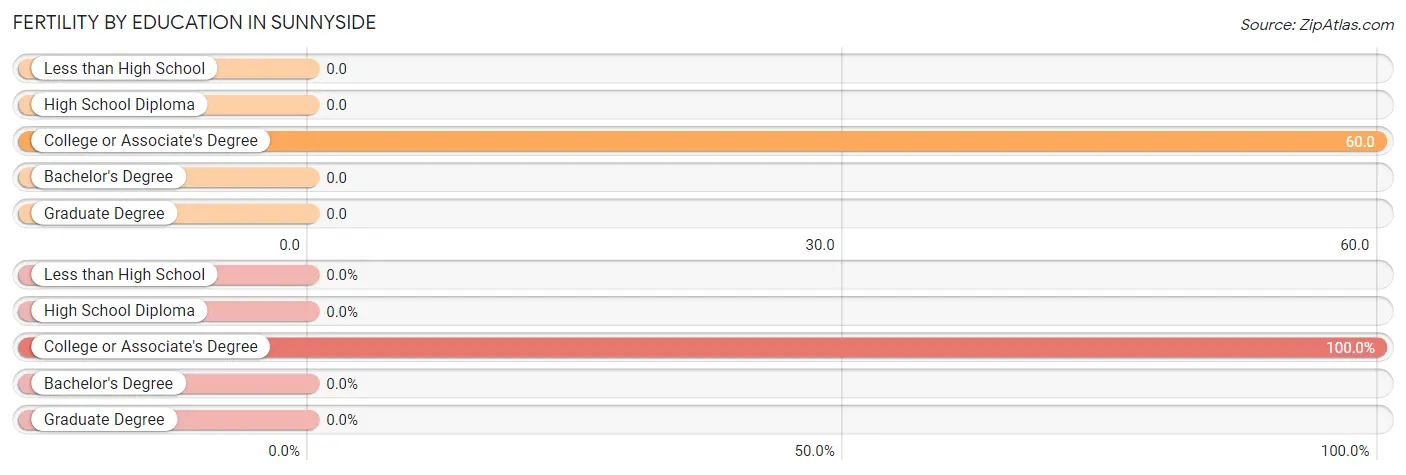
| Educational Attainment | Women with Births | Births / 1,000 Women |
| Less than High School | 0 (0.0%) | 0.0 |
| High School Diploma | 0 (0.0%) | 0.0 |
| College or Associate's Degree | 20 (100.0%) | 60.0 |
| Bachelor's Degree | 0 (0.0%) | 0.0 |
| Graduate Degree | 0 (0.0%) | 0.0 |
| Total | 20 (100.0%) | 19.0 |
Fertility by Education by Marriage Status in Sunnyside
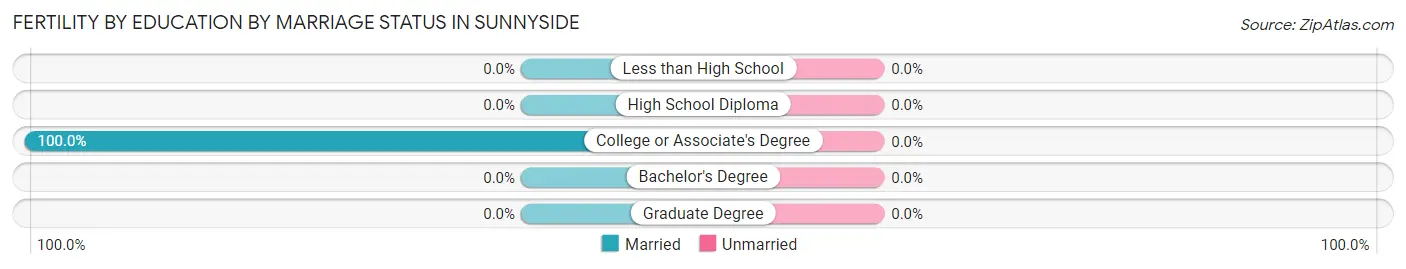
| Educational Attainment | Married | Unmarried |
| Less than High School | 0 (0.0%) | 0 (0.0%) |
| High School Diploma | 0 (0.0%) | 0 (0.0%) |
| College or Associate's Degree | 20 (100.0%) | 0 (0.0%) |
| Bachelor's Degree | 0 (0.0%) | 0 (0.0%) |
| Graduate Degree | 0 (0.0%) | 0 (0.0%) |
| Total | 20 (100.0%) | 0 (0.0%) |
Employment Characteristics in Sunnyside
Employment by Class of Employer in Sunnyside
Among the 2,133 employed individuals in Sunnyside, private company employees (1,242 | 58.2%), local government employees (261 | 12.2%), and self-employed (not incorporated) (256 | 12.0%) make up the most common classes of employment.
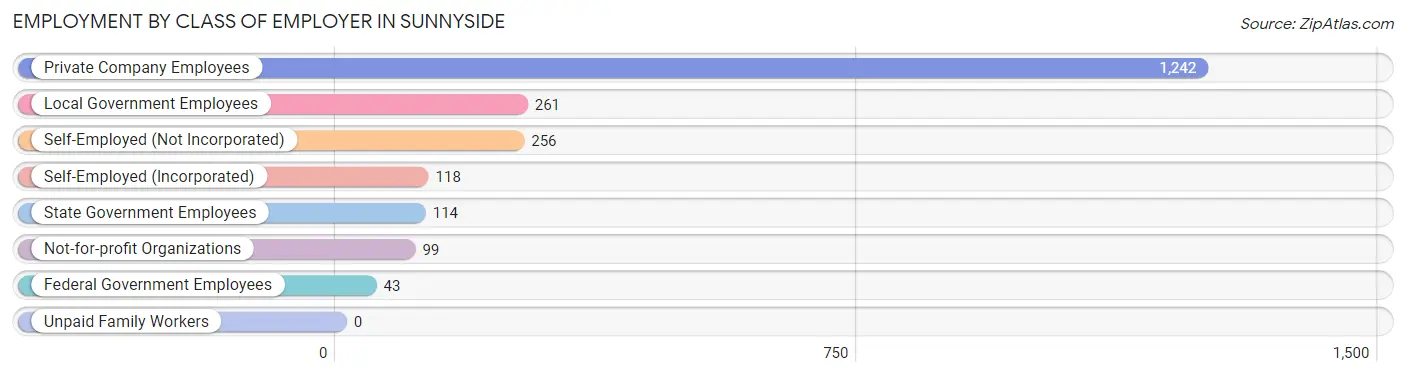
| Employer Class | # Employees | % Employees |
| Private Company Employees | 1,242 | 58.2% |
| Self-Employed (Incorporated) | 118 | 5.5% |
| Self-Employed (Not Incorporated) | 256 | 12.0% |
| Not-for-profit Organizations | 99 | 4.6% |
| Local Government Employees | 261 | 12.2% |
| State Government Employees | 114 | 5.3% |
| Federal Government Employees | 43 | 2.0% |
| Unpaid Family Workers | 0 | 0.0% |
| Total | 2,133 | 100.0% |
Employment Status by Age in Sunnyside
According to the labor force statistics for Sunnyside, out of the total population over 16 years of age (3,674), 61.7% or 2,267 individuals are in the labor force, with 5.7% or 129 of them unemployed. The age group with the highest labor force participation rate is 35 to 44 years, with 91.7% or 532 individuals in the labor force. Within the labor force, the 16 to 19 years age range has the highest percentage of unemployed individuals, with 55.6% or 20 of them being unemployed.
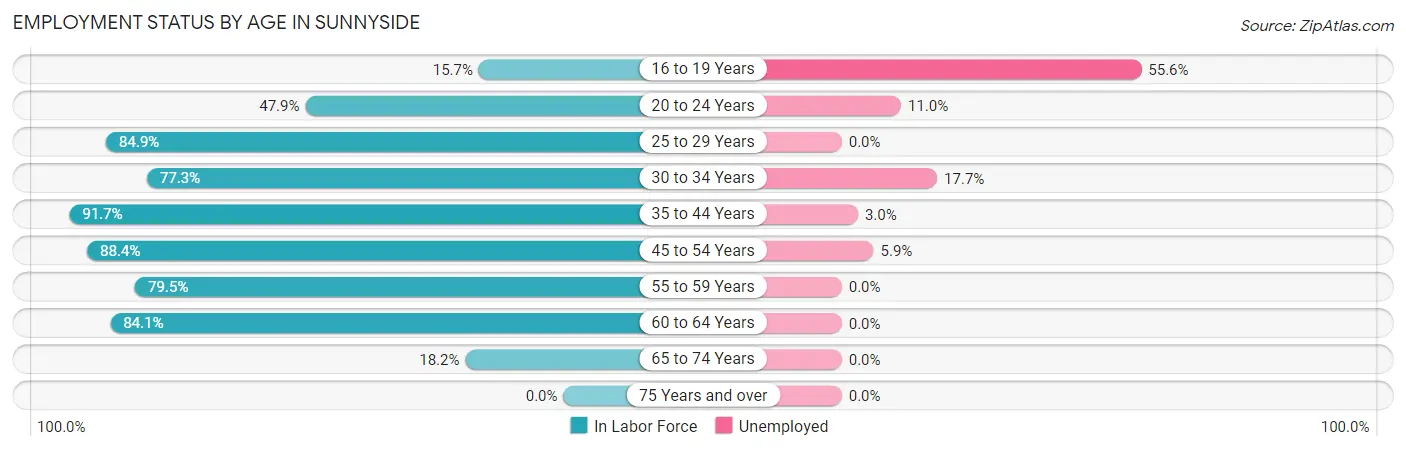
| Age Bracket | In Labor Force | Unemployed |
| 16 to 19 Years | 36 (15.7%) | 20 (55.6%) |
| 20 to 24 Years | 127 (47.9%) | 14 (11.0%) |
| 25 to 29 Years | 254 (84.9%) | 0 (0.0%) |
| 30 to 34 Years | 282 (77.3%) | 50 (17.7%) |
| 35 to 44 Years | 532 (91.7%) | 16 (3.0%) |
| 45 to 54 Years | 490 (88.4%) | 29 (5.9%) |
| 55 to 59 Years | 244 (79.5%) | 0 (0.0%) |
| 60 to 64 Years | 191 (84.1%) | 0 (0.0%) |
| 65 to 74 Years | 112 (18.2%) | 0 (0.0%) |
| 75 Years and over | 0 (0.0%) | 0 (0.0%) |
| Total | 2,267 (61.7%) | 129 (5.7%) |
Employment Status by Educational Attainment in Sunnyside
According to labor force statistics for Sunnyside, 85.5% of individuals (1,994) out of the total population between 25 and 64 years of age (2,332) are in the labor force, with 4.8% or 96 of them being unemployed. The group with the highest labor force participation rate are those with the educational attainment of bachelor's degree or higher, with 96.6% or 691 individuals in the labor force. Within the labor force, individuals with high school diploma education have the highest percentage of unemployment, with 9.3% or 34 of them being unemployed.
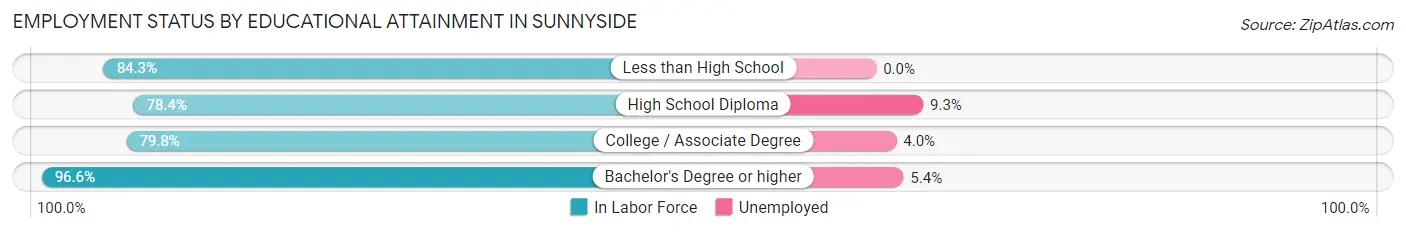
| Educational Attainment | In Labor Force | Unemployed |
| Less than High School | 338 (84.3%) | 0 (0.0%) |
| High School Diploma | 367 (78.4%) | 44 (9.3%) |
| College / Associate Degree | 597 (79.8%) | 30 (4.0%) |
| Bachelor's Degree or higher | 691 (96.6%) | 39 (5.4%) |
| Total | 1,994 (85.5%) | 112 (4.8%) |
Employment Occupations by Sex in Sunnyside
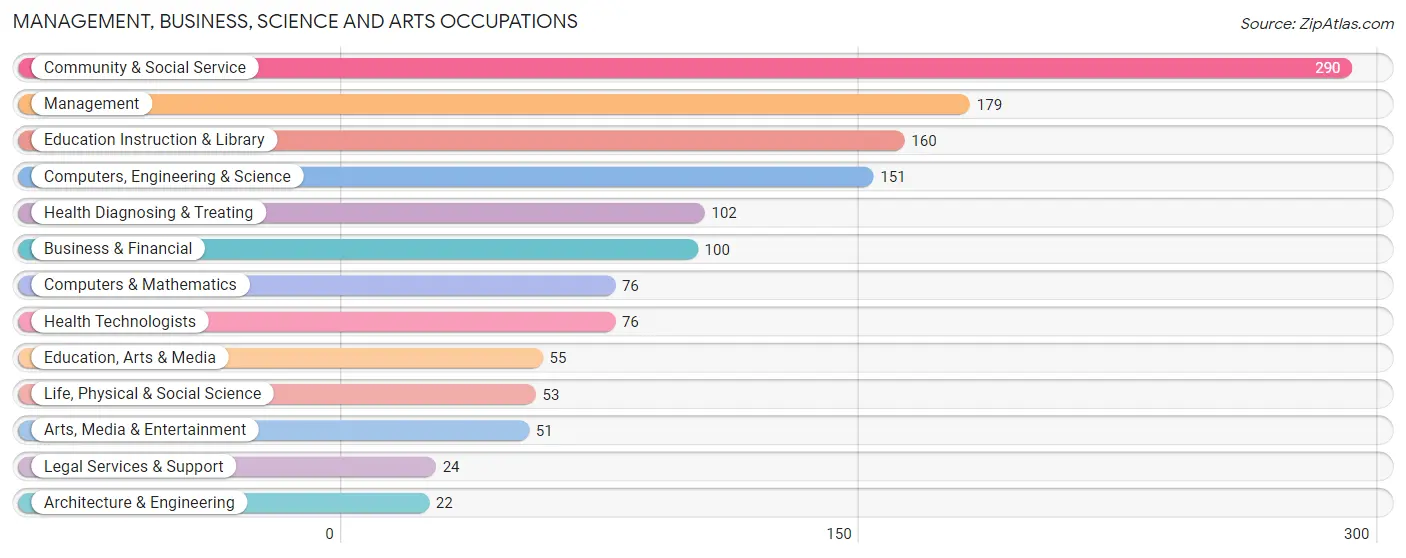
Management, Business, Science and Arts Occupations
The most common Management, Business, Science and Arts occupations in Sunnyside are Community & Social Service (290 | 13.6%), Management (179 | 8.4%), Education Instruction & Library (160 | 7.5%), Computers, Engineering & Science (151 | 7.1%), and Health Diagnosing & Treating (102 | 4.8%).
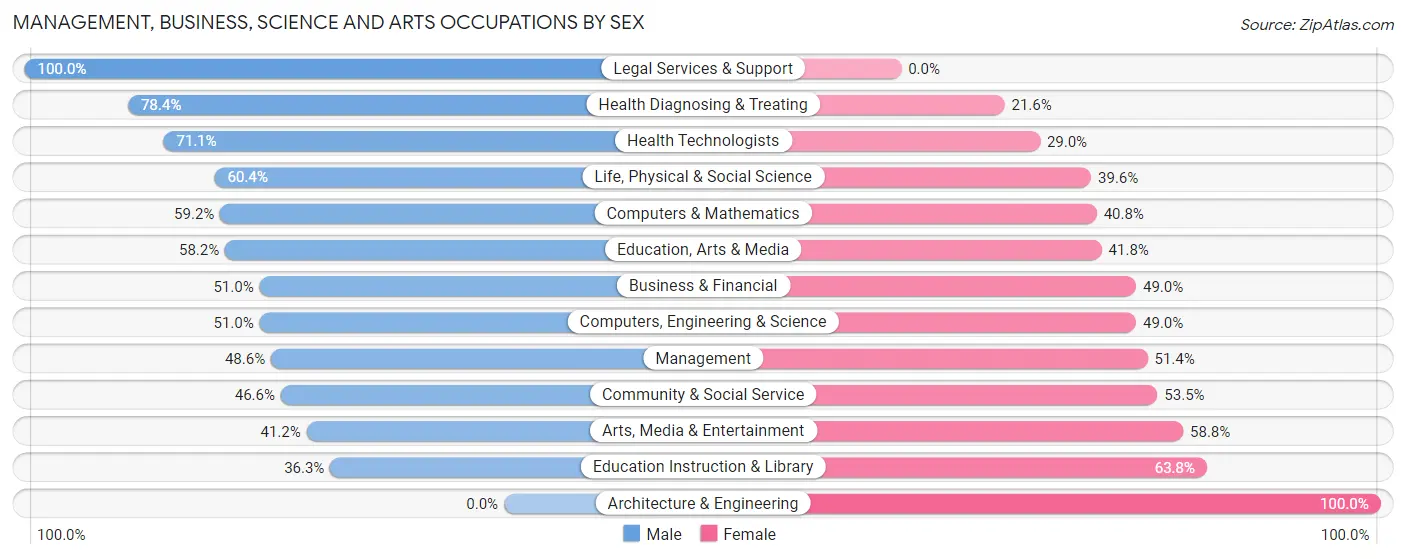
Management, Business, Science and Arts Occupations by Sex
Within the Management, Business, Science and Arts occupations in Sunnyside, the most male-oriented occupations are Legal Services & Support (100.0%), Health Diagnosing & Treating (78.4%), and Health Technologists (71.1%), while the most female-oriented occupations are Architecture & Engineering (100.0%), Education Instruction & Library (63.7%), and Arts, Media & Entertainment (58.8%).
| Occupation | Male | Female |
| Management | 87 (48.6%) | 92 (51.4%) |
| Business & Financial | 51 (51.0%) | 49 (49.0%) |
| Computers, Engineering & Science | 77 (51.0%) | 74 (49.0%) |
| Computers & Mathematics | 45 (59.2%) | 31 (40.8%) |
| Architecture & Engineering | 0 (0.0%) | 22 (100.0%) |
| Life, Physical & Social Science | 32 (60.4%) | 21 (39.6%) |
| Community & Social Service | 135 (46.6%) | 155 (53.4%) |
| Education, Arts & Media | 32 (58.2%) | 23 (41.8%) |
| Legal Services & Support | 24 (100.0%) | 0 (0.0%) |
| Education Instruction & Library | 58 (36.2%) | 102 (63.7%) |
| Arts, Media & Entertainment | 21 (41.2%) | 30 (58.8%) |
| Health Diagnosing & Treating | 80 (78.4%) | 22 (21.6%) |
| Health Technologists | 54 (71.1%) | 22 (28.9%) |
| Total (Category) | 430 (52.3%) | 392 (47.7%) |
| Total (Overall) | 1,166 (54.5%) | 973 (45.5%) |
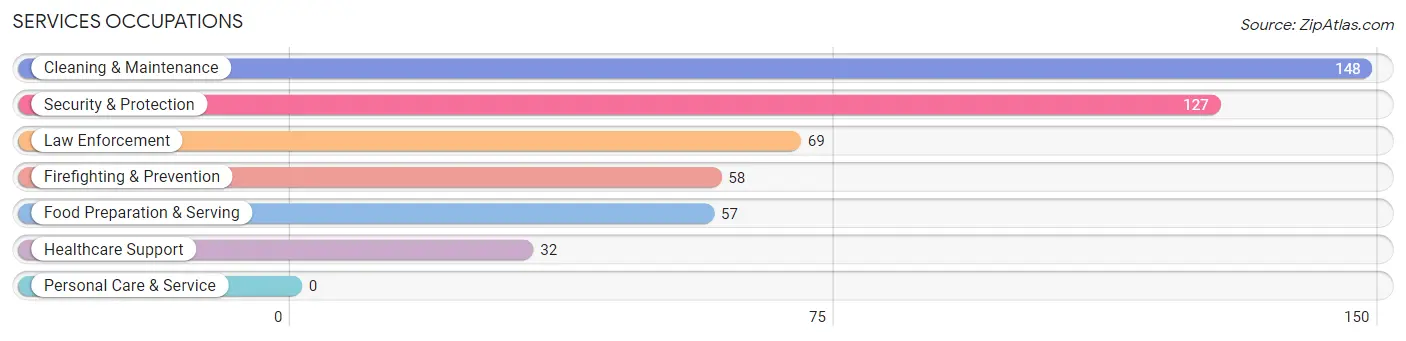
Services Occupations
The most common Services occupations in Sunnyside are Cleaning & Maintenance (148 | 6.9%), Security & Protection (127 | 5.9%), Law Enforcement (69 | 3.2%), Firefighting & Prevention (58 | 2.7%), and Food Preparation & Serving (57 | 2.7%).
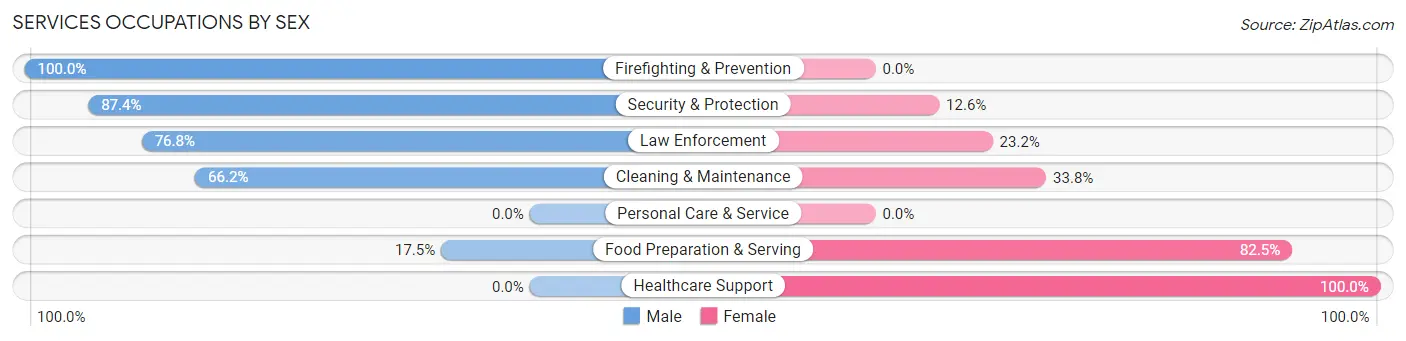
Services Occupations by Sex
Within the Services occupations in Sunnyside, the most male-oriented occupations are Firefighting & Prevention (100.0%), Security & Protection (87.4%), and Law Enforcement (76.8%), while the most female-oriented occupations are Healthcare Support (100.0%), Food Preparation & Serving (82.5%), and Cleaning & Maintenance (33.8%).
| Occupation | Male | Female |
| Healthcare Support | 0 (0.0%) | 32 (100.0%) |
| Security & Protection | 111 (87.4%) | 16 (12.6%) |
| Firefighting & Prevention | 58 (100.0%) | 0 (0.0%) |
| Law Enforcement | 53 (76.8%) | 16 (23.2%) |
| Food Preparation & Serving | 10 (17.5%) | 47 (82.5%) |
| Cleaning & Maintenance | 98 (66.2%) | 50 (33.8%) |
| Personal Care & Service | 0 (0.0%) | 0 (0.0%) |
| Total (Category) | 219 (60.2%) | 145 (39.8%) |
| Total (Overall) | 1,166 (54.5%) | 973 (45.5%) |
Sales and Office Occupations
The most common Sales and Office occupations in Sunnyside are Office & Administration (260 | 12.2%), and Sales & Related (243 | 11.4%).
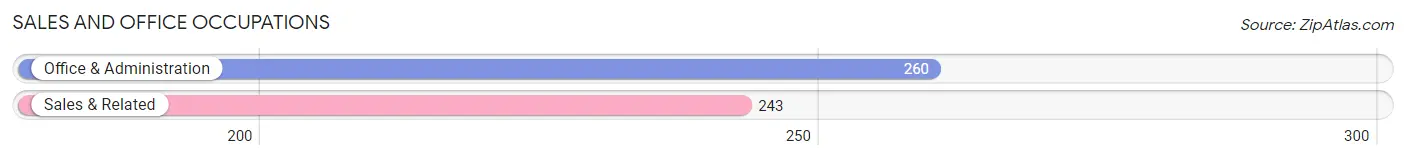
Sales and Office Occupations by Sex

| Occupation | Male | Female |
| Sales & Related | 152 (62.5%) | 91 (37.4%) |
| Office & Administration | 35 (13.5%) | 225 (86.5%) |
| Total (Category) | 187 (37.2%) | 316 (62.8%) |
| Total (Overall) | 1,166 (54.5%) | 973 (45.5%) |
Natural Resources, Construction and Maintenance Occupations
The most common Natural Resources, Construction and Maintenance occupations in Sunnyside are Construction & Extraction (41 | 1.9%), Farming, Fishing & Forestry (27 | 1.3%), and Installation, Maintenance & Repair (5 | 0.2%).
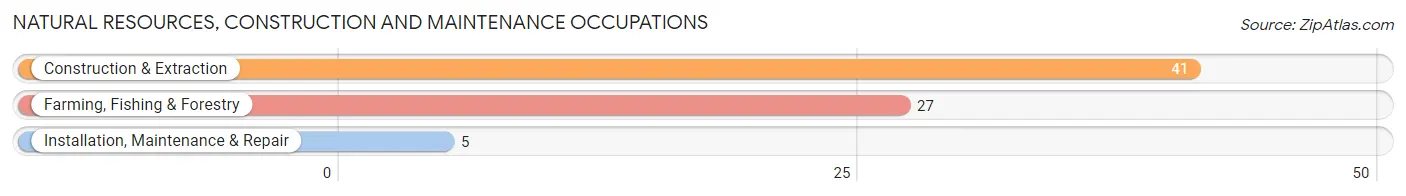
Natural Resources, Construction and Maintenance Occupations by Sex
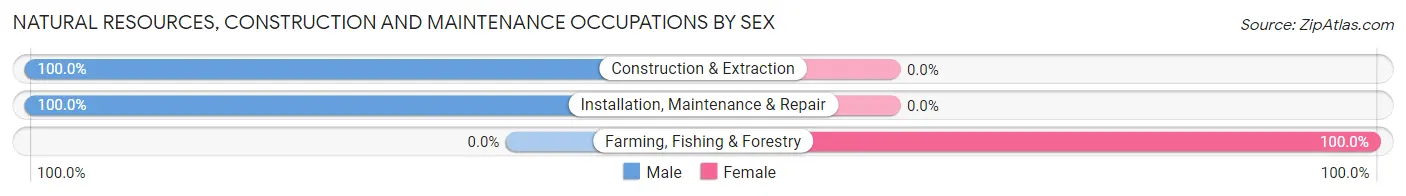
| Occupation | Male | Female |
| Farming, Fishing & Forestry | 0 (0.0%) | 27 (100.0%) |
| Construction & Extraction | 41 (100.0%) | 0 (0.0%) |
| Installation, Maintenance & Repair | 5 (100.0%) | 0 (0.0%) |
| Total (Category) | 46 (63.0%) | 27 (37.0%) |
| Total (Overall) | 1,166 (54.5%) | 973 (45.5%) |
Production, Transportation and Moving Occupations
The most common Production, Transportation and Moving occupations in Sunnyside are Production (141 | 6.6%), Material Moving (138 | 6.5%), and Transportation (98 | 4.6%).
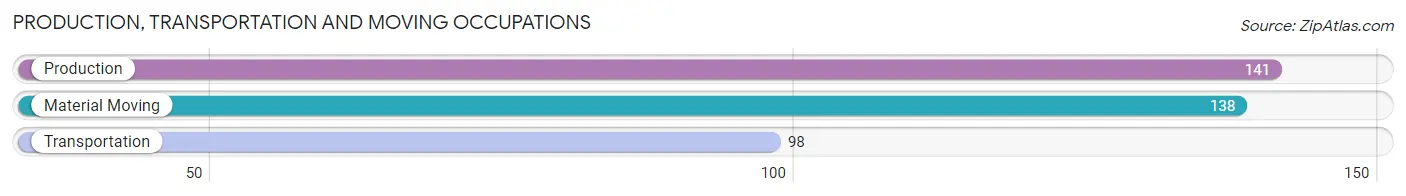
Production, Transportation and Moving Occupations by Sex
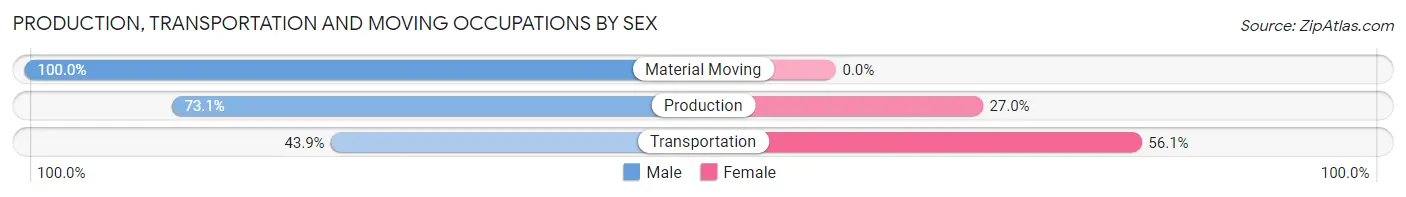
| Occupation | Male | Female |
| Production | 103 (73.1%) | 38 (27.0%) |
| Transportation | 43 (43.9%) | 55 (56.1%) |
| Material Moving | 138 (100.0%) | 0 (0.0%) |
| Total (Category) | 284 (75.3%) | 93 (24.7%) |
| Total (Overall) | 1,166 (54.5%) | 973 (45.5%) |
Employment Industries by Sex in Sunnyside
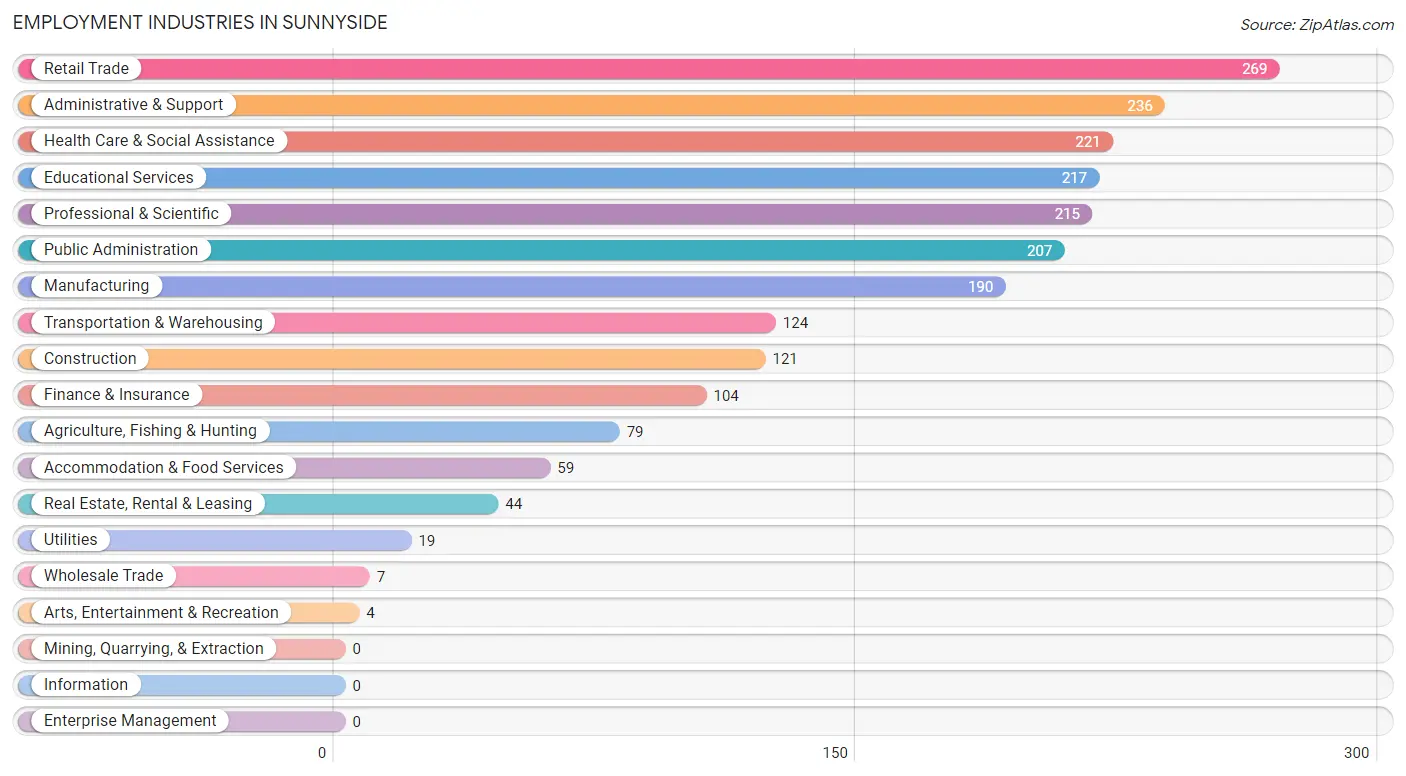
Employment Industries in Sunnyside
The major employment industries in Sunnyside include Retail Trade (269 | 12.6%), Administrative & Support (236 | 11.0%), Health Care & Social Assistance (221 | 10.3%), Educational Services (217 | 10.1%), and Professional & Scientific (215 | 10.1%).
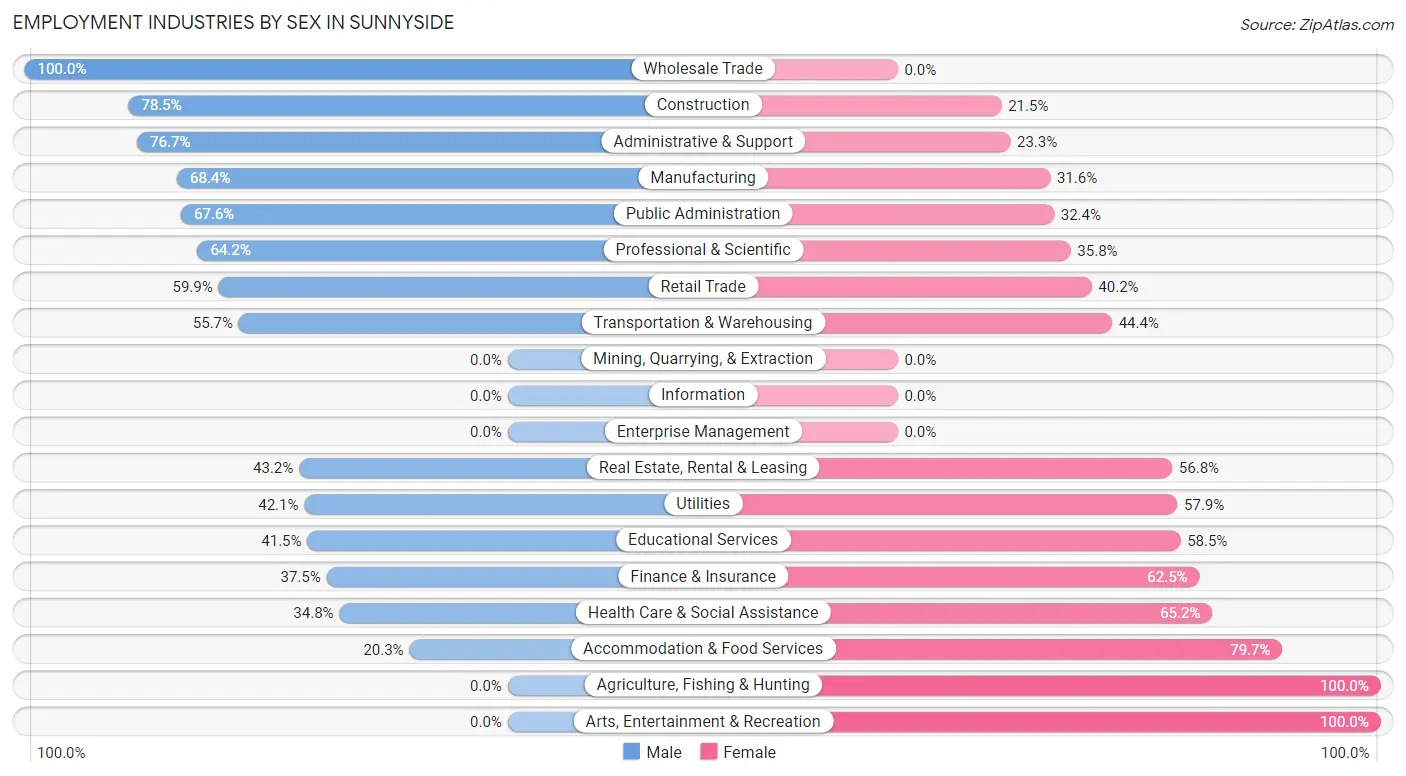
Employment Industries by Sex in Sunnyside
The Sunnyside industries that see more men than women are Wholesale Trade (100.0%), Construction (78.5%), and Administrative & Support (76.7%), whereas the industries that tend to have a higher number of women are Agriculture, Fishing & Hunting (100.0%), Arts, Entertainment & Recreation (100.0%), and Accommodation & Food Services (79.7%).
| Industry | Male | Female |
| Agriculture, Fishing & Hunting | 0 (0.0%) | 79 (100.0%) |
| Mining, Quarrying, & Extraction | 0 (0.0%) | 0 (0.0%) |
| Construction | 95 (78.5%) | 26 (21.5%) |
| Manufacturing | 130 (68.4%) | 60 (31.6%) |
| Wholesale Trade | 7 (100.0%) | 0 (0.0%) |
| Retail Trade | 161 (59.9%) | 108 (40.2%) |
| Transportation & Warehousing | 69 (55.6%) | 55 (44.4%) |
| Utilities | 8 (42.1%) | 11 (57.9%) |
| Information | 0 (0.0%) | 0 (0.0%) |
| Finance & Insurance | 39 (37.5%) | 65 (62.5%) |
| Real Estate, Rental & Leasing | 19 (43.2%) | 25 (56.8%) |
| Professional & Scientific | 138 (64.2%) | 77 (35.8%) |
| Enterprise Management | 0 (0.0%) | 0 (0.0%) |
| Administrative & Support | 181 (76.7%) | 55 (23.3%) |
| Educational Services | 90 (41.5%) | 127 (58.5%) |
| Health Care & Social Assistance | 77 (34.8%) | 144 (65.2%) |
| Arts, Entertainment & Recreation | 0 (0.0%) | 4 (100.0%) |
| Accommodation & Food Services | 12 (20.3%) | 47 (79.7%) |
| Public Administration | 140 (67.6%) | 67 (32.4%) |
| Total | 1,166 (54.5%) | 973 (45.5%) |
Education in Sunnyside
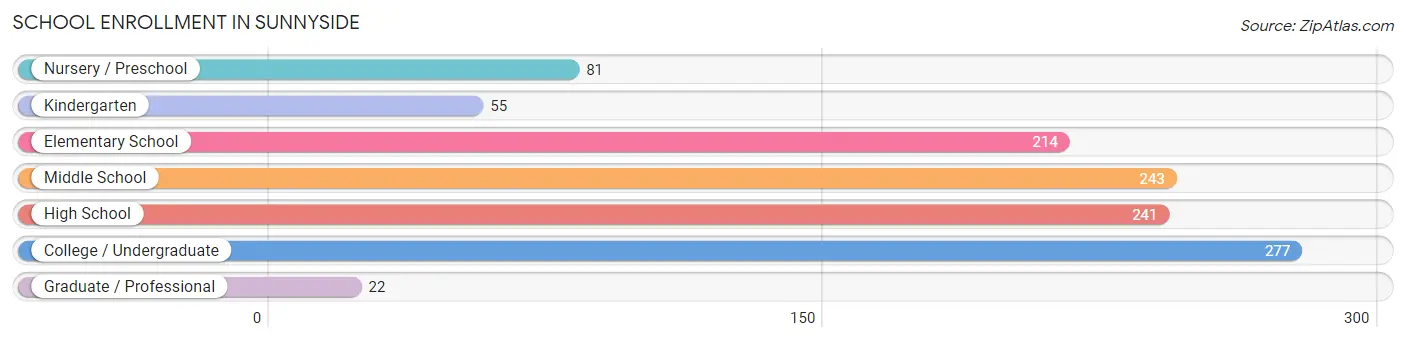
School Enrollment in Sunnyside
The most common levels of schooling among the 1,133 students in Sunnyside are college / undergraduate (277 | 24.4%), middle school (243 | 21.4%), and high school (241 | 21.3%).
| School Level | # Students | % Students |
| Nursery / Preschool | 81 | 7.1% |
| Kindergarten | 55 | 4.9% |
| Elementary School | 214 | 18.9% |
| Middle School | 243 | 21.4% |
| High School | 241 | 21.3% |
| College / Undergraduate | 277 | 24.4% |
| Graduate / Professional | 22 | 1.9% |
| Total | 1,133 | 100.0% |
School Enrollment by Age by Funding Source in Sunnyside
Out of a total of 1,133 students who are enrolled in schools in Sunnyside, 191 (16.9%) attend a private institution, while the remaining 942 (83.1%) are enrolled in public schools. The age group of 3 to 4 year olds has the highest likelihood of being enrolled in private schools, with 37 (68.5% in the age bracket) enrolled. Conversely, the age group of 18 to 19 year olds has the lowest likelihood of being enrolled in a private school, with 16 (100.0% in the age bracket) attending a public institution.
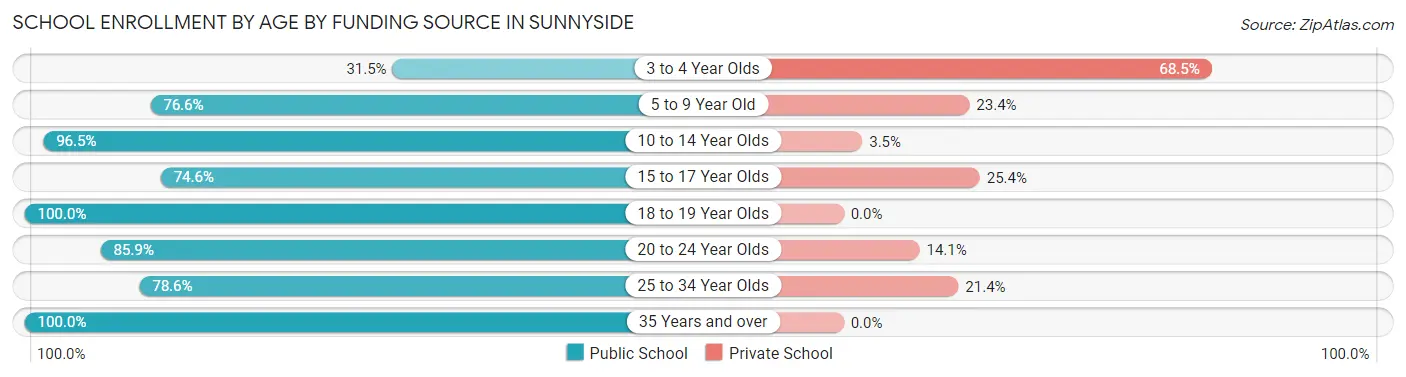
| Age Bracket | Public School | Private School |
| 3 to 4 Year Olds | 17 (31.5%) | 37 (68.5%) |
| 5 to 9 Year Old | 170 (76.6%) | 52 (23.4%) |
| 10 to 14 Year Olds | 306 (96.5%) | 11 (3.5%) |
| 15 to 17 Year Olds | 156 (74.6%) | 53 (25.4%) |
| 18 to 19 Year Olds | 16 (100.0%) | 0 (0.0%) |
| 20 to 24 Year Olds | 85 (85.9%) | 14 (14.1%) |
| 25 to 34 Year Olds | 92 (78.6%) | 25 (21.4%) |
| 35 Years and over | 99 (100.0%) | 0 (0.0%) |
| Total | 942 (83.1%) | 191 (16.9%) |
Educational Attainment by Field of Study in Sunnyside
Bio, nature & agricultural (159 | 13.6%), education (147 | 12.6%), business (118 | 10.1%), arts & humanities (107 | 9.1%), and social sciences (102 | 8.7%) are the most common fields of study among 1,170 individuals in Sunnyside who have obtained a bachelor's degree or higher.
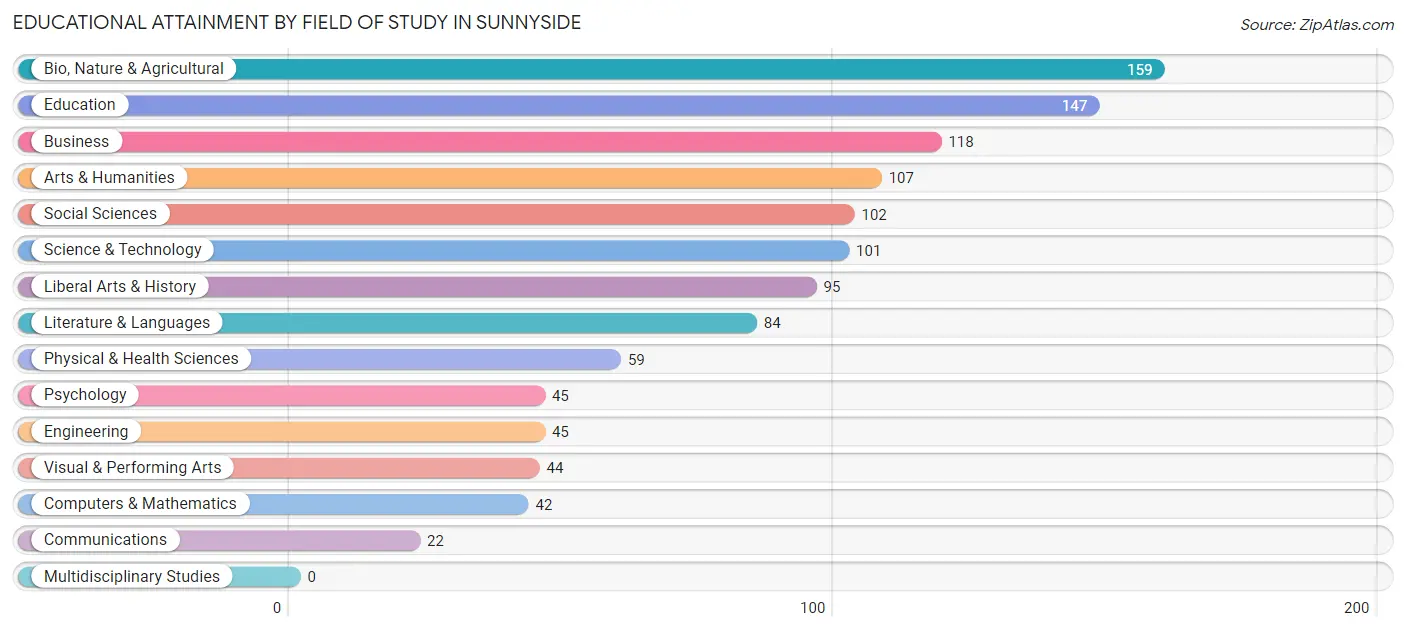
| Field of Study | # Graduates | % Graduates |
| Computers & Mathematics | 42 | 3.6% |
| Bio, Nature & Agricultural | 159 | 13.6% |
| Physical & Health Sciences | 59 | 5.0% |
| Psychology | 45 | 3.8% |
| Social Sciences | 102 | 8.7% |
| Engineering | 45 | 3.8% |
| Multidisciplinary Studies | 0 | 0.0% |
| Science & Technology | 101 | 8.6% |
| Business | 118 | 10.1% |
| Education | 147 | 12.6% |
| Literature & Languages | 84 | 7.2% |
| Liberal Arts & History | 95 | 8.1% |
| Visual & Performing Arts | 44 | 3.8% |
| Communications | 22 | 1.9% |
| Arts & Humanities | 107 | 9.1% |
| Total | 1,170 | 100.0% |
Transportation & Commute in Sunnyside
Vehicle Availability by Sex in Sunnyside
The most prevalent vehicle ownership categories in Sunnyside are males with 2 vehicles (374, accounting for 32.3%) and females with 2 vehicles (309, making up 38.4%).
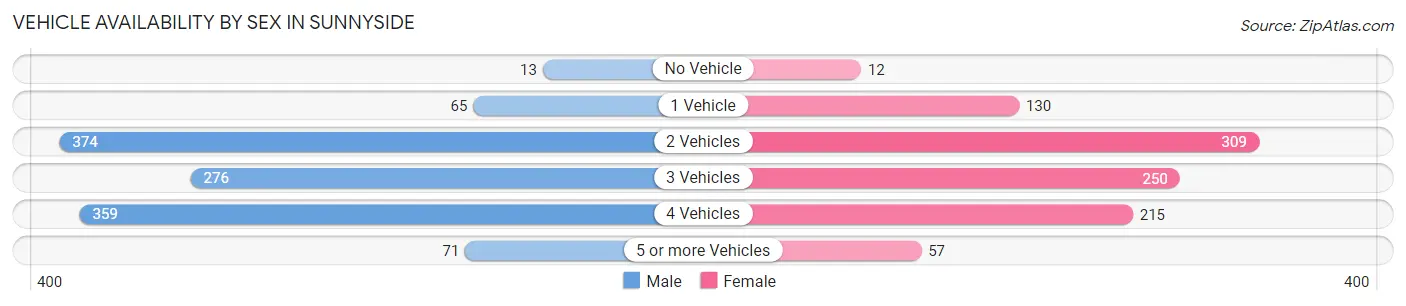
| Vehicles Available | Male | Female |
| No Vehicle | 13 (1.1%) | 12 (1.2%) |
| 1 Vehicle | 65 (5.6%) | 130 (13.4%) |
| 2 Vehicles | 374 (32.3%) | 309 (31.8%) |
| 3 Vehicles | 276 (23.8%) | 250 (25.7%) |
| 4 Vehicles | 359 (31.0%) | 215 (22.1%) |
| 5 or more Vehicles | 71 (6.1%) | 57 (5.9%) |
| Total | 1,158 (100.0%) | 973 (100.0%) |
Commute Time in Sunnyside
The most frequently occuring commute durations in Sunnyside are 15 to 19 minutes (507 commuters, 25.5%), 20 to 24 minutes (457 commuters, 23.0%), and 10 to 14 minutes (283 commuters, 14.2%).
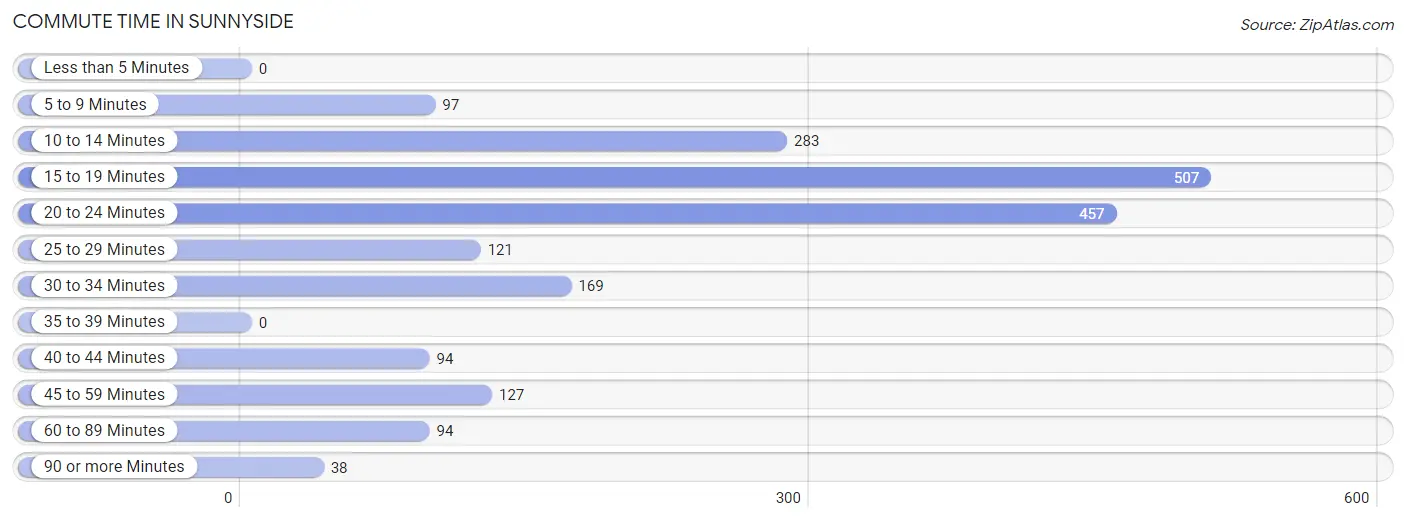
| Commute Time | # Commuters | % Commuters |
| Less than 5 Minutes | 0 | 0.0% |
| 5 to 9 Minutes | 97 | 4.9% |
| 10 to 14 Minutes | 283 | 14.2% |
| 15 to 19 Minutes | 507 | 25.5% |
| 20 to 24 Minutes | 457 | 23.0% |
| 25 to 29 Minutes | 121 | 6.1% |
| 30 to 34 Minutes | 169 | 8.5% |
| 35 to 39 Minutes | 0 | 0.0% |
| 40 to 44 Minutes | 94 | 4.7% |
| 45 to 59 Minutes | 127 | 6.4% |
| 60 to 89 Minutes | 94 | 4.7% |
| 90 or more Minutes | 38 | 1.9% |
Commute Time by Sex in Sunnyside
The most common commute times in Sunnyside are 15 to 19 minutes (290 commuters, 26.6%) for males and 15 to 19 minutes (217 commuters, 24.2%) for females.
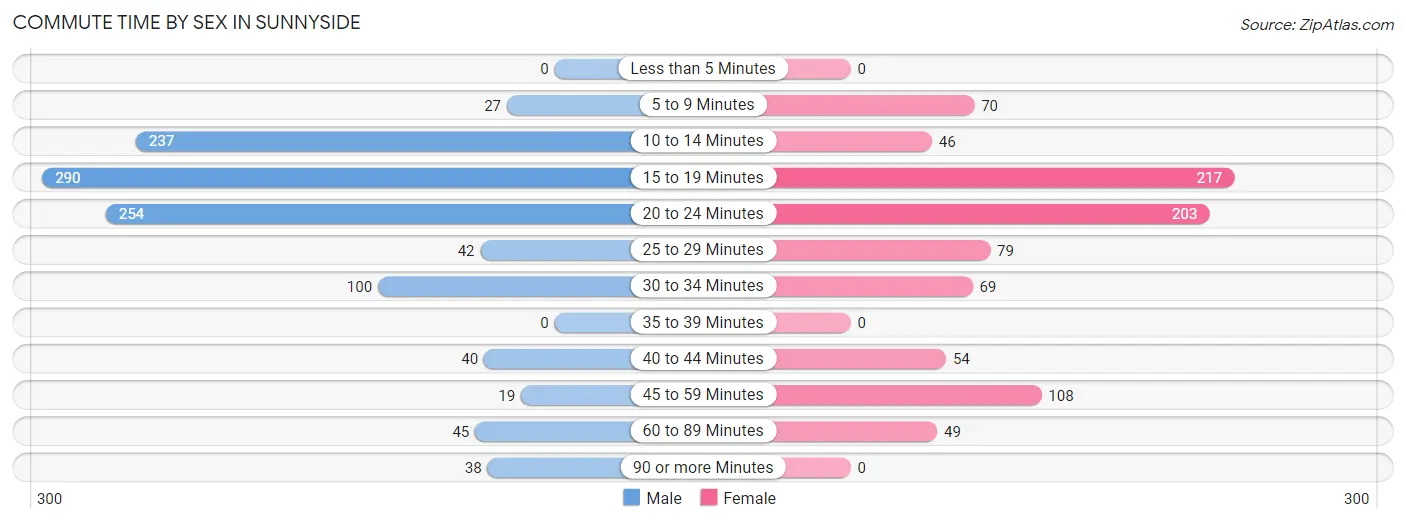
| Commute Time | Male | Female |
| Less than 5 Minutes | 0 (0.0%) | 0 (0.0%) |
| 5 to 9 Minutes | 27 (2.5%) | 70 (7.8%) |
| 10 to 14 Minutes | 237 (21.7%) | 46 (5.1%) |
| 15 to 19 Minutes | 290 (26.6%) | 217 (24.2%) |
| 20 to 24 Minutes | 254 (23.3%) | 203 (22.7%) |
| 25 to 29 Minutes | 42 (3.8%) | 79 (8.8%) |
| 30 to 34 Minutes | 100 (9.2%) | 69 (7.7%) |
| 35 to 39 Minutes | 0 (0.0%) | 0 (0.0%) |
| 40 to 44 Minutes | 40 (3.7%) | 54 (6.0%) |
| 45 to 59 Minutes | 19 (1.7%) | 108 (12.1%) |
| 60 to 89 Minutes | 45 (4.1%) | 49 (5.5%) |
| 90 or more Minutes | 38 (3.5%) | 0 (0.0%) |
Time of Departure to Work by Sex in Sunnyside
The most frequent times of departure to work in Sunnyside are 6:00 AM to 6:29 AM (209, 19.1%) for males and 7:00 AM to 7:29 AM (231, 25.8%) for females.
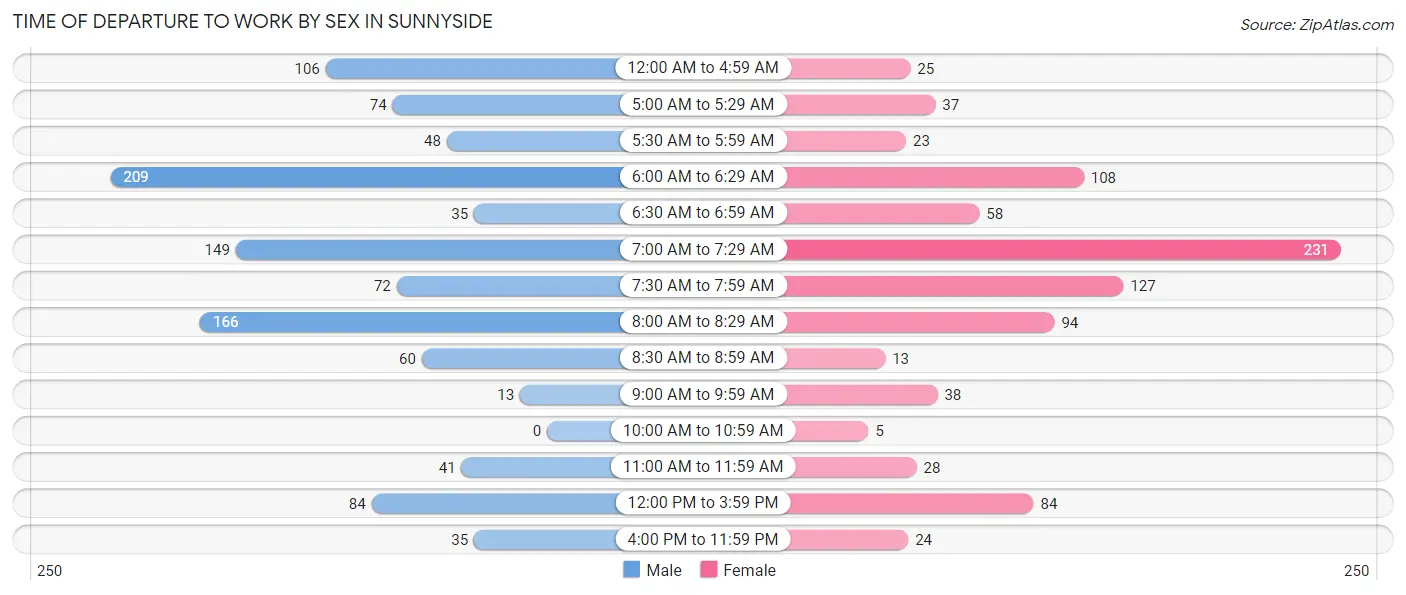
| Time of Departure | Male | Female |
| 12:00 AM to 4:59 AM | 106 (9.7%) | 25 (2.8%) |
| 5:00 AM to 5:29 AM | 74 (6.8%) | 37 (4.1%) |
| 5:30 AM to 5:59 AM | 48 (4.4%) | 23 (2.6%) |
| 6:00 AM to 6:29 AM | 209 (19.1%) | 108 (12.1%) |
| 6:30 AM to 6:59 AM | 35 (3.2%) | 58 (6.5%) |
| 7:00 AM to 7:29 AM | 149 (13.6%) | 231 (25.8%) |
| 7:30 AM to 7:59 AM | 72 (6.6%) | 127 (14.2%) |
| 8:00 AM to 8:29 AM | 166 (15.2%) | 94 (10.5%) |
| 8:30 AM to 8:59 AM | 60 (5.5%) | 13 (1.5%) |
| 9:00 AM to 9:59 AM | 13 (1.2%) | 38 (4.3%) |
| 10:00 AM to 10:59 AM | 0 (0.0%) | 5 (0.6%) |
| 11:00 AM to 11:59 AM | 41 (3.7%) | 28 (3.1%) |
| 12:00 PM to 3:59 PM | 84 (7.7%) | 84 (9.4%) |
| 4:00 PM to 11:59 PM | 35 (3.2%) | 24 (2.7%) |
| Total | 1,092 (100.0%) | 895 (100.0%) |
Housing Occupancy in Sunnyside
Occupancy by Ownership in Sunnyside
Of the total 1,491 dwellings in Sunnyside, owner-occupied units account for 1,197 (80.3%), while renter-occupied units make up 294 (19.7%).
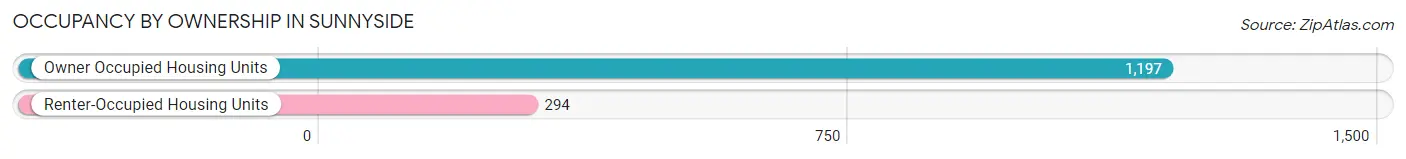
| Occupancy | # Housing Units | % Housing Units |
| Owner Occupied Housing Units | 1,197 | 80.3% |
| Renter-Occupied Housing Units | 294 | 19.7% |
| Total Occupied Housing Units | 1,491 | 100.0% |
Occupancy by Household Size in Sunnyside
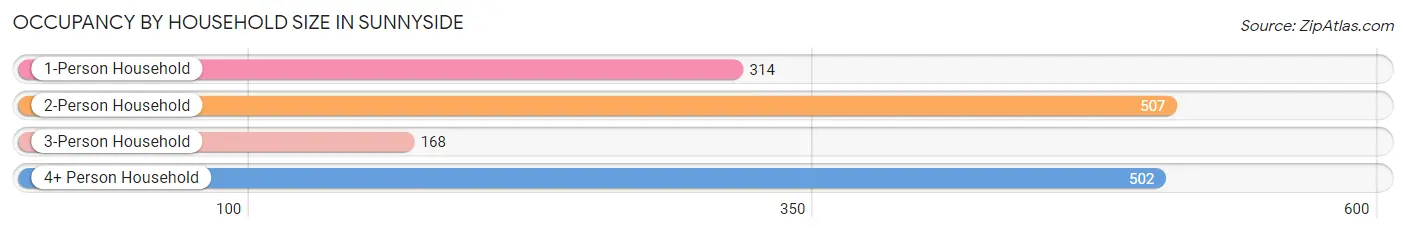
| Household Size | # Housing Units | % Housing Units |
| 1-Person Household | 314 | 21.1% |
| 2-Person Household | 507 | 34.0% |
| 3-Person Household | 168 | 11.3% |
| 4+ Person Household | 502 | 33.7% |
| Total Housing Units | 1,491 | 100.0% |
Occupancy by Ownership by Household Size in Sunnyside
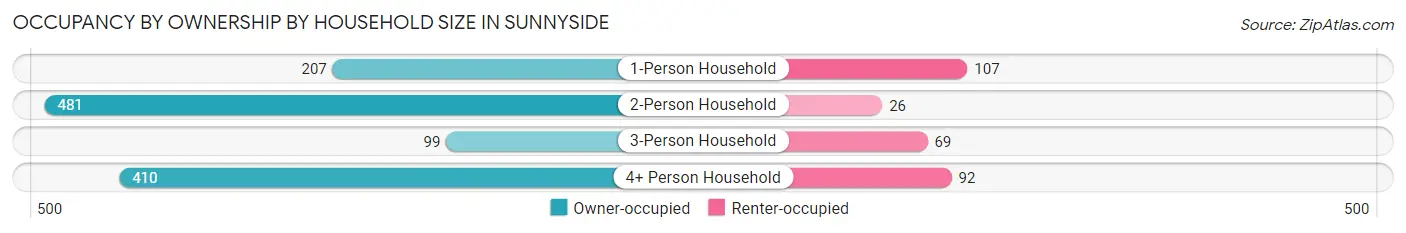
| Household Size | Owner-occupied | Renter-occupied |
| 1-Person Household | 207 (65.9%) | 107 (34.1%) |
| 2-Person Household | 481 (94.9%) | 26 (5.1%) |
| 3-Person Household | 99 (58.9%) | 69 (41.1%) |
| 4+ Person Household | 410 (81.7%) | 92 (18.3%) |
| Total Housing Units | 1,197 (80.3%) | 294 (19.7%) |
Occupancy by Educational Attainment in Sunnyside
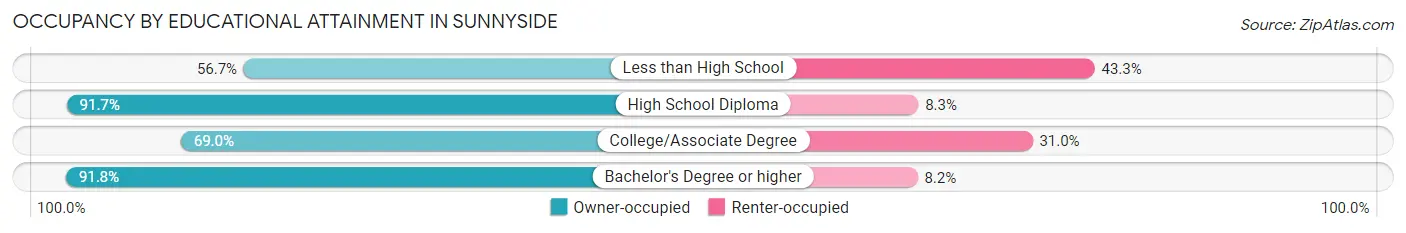
| Household Size | Owner-occupied | Renter-occupied |
| Less than High School | 131 (56.7%) | 100 (43.3%) |
| High School Diploma | 198 (91.7%) | 18 (8.3%) |
| College/Associate Degree | 274 (69.0%) | 123 (31.0%) |
| Bachelor's Degree or higher | 594 (91.8%) | 53 (8.2%) |
Occupancy by Age of Householder in Sunnyside
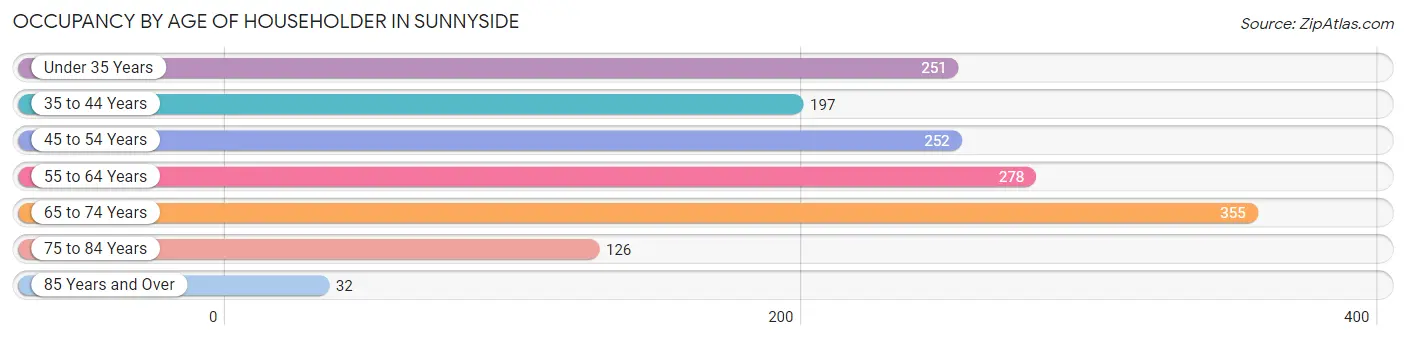
| Age Bracket | # Households | % Households |
| Under 35 Years | 251 | 16.8% |
| 35 to 44 Years | 197 | 13.2% |
| 45 to 54 Years | 252 | 16.9% |
| 55 to 64 Years | 278 | 18.6% |
| 65 to 74 Years | 355 | 23.8% |
| 75 to 84 Years | 126 | 8.5% |
| 85 Years and Over | 32 | 2.1% |
| Total | 1,491 | 100.0% |
Housing Finances in Sunnyside
Median Income by Occupancy in Sunnyside
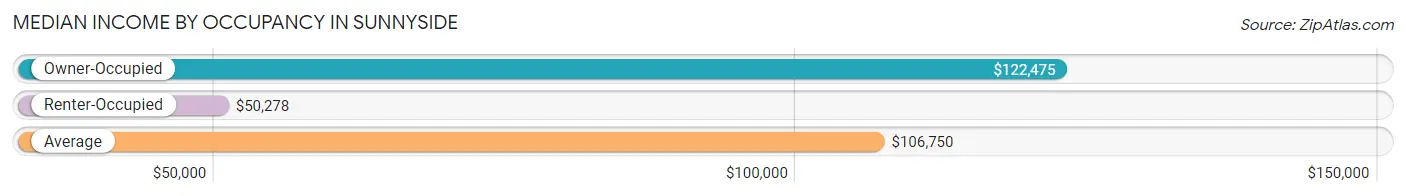
| Occupancy Type | # Households | Median Income |
| Owner-Occupied | 1,197 (80.3%) | $122,475 |
| Renter-Occupied | 294 (19.7%) | $50,278 |
| Average | 1,491 (100.0%) | $106,750 |
Occupancy by Householder Income Bracket in Sunnyside
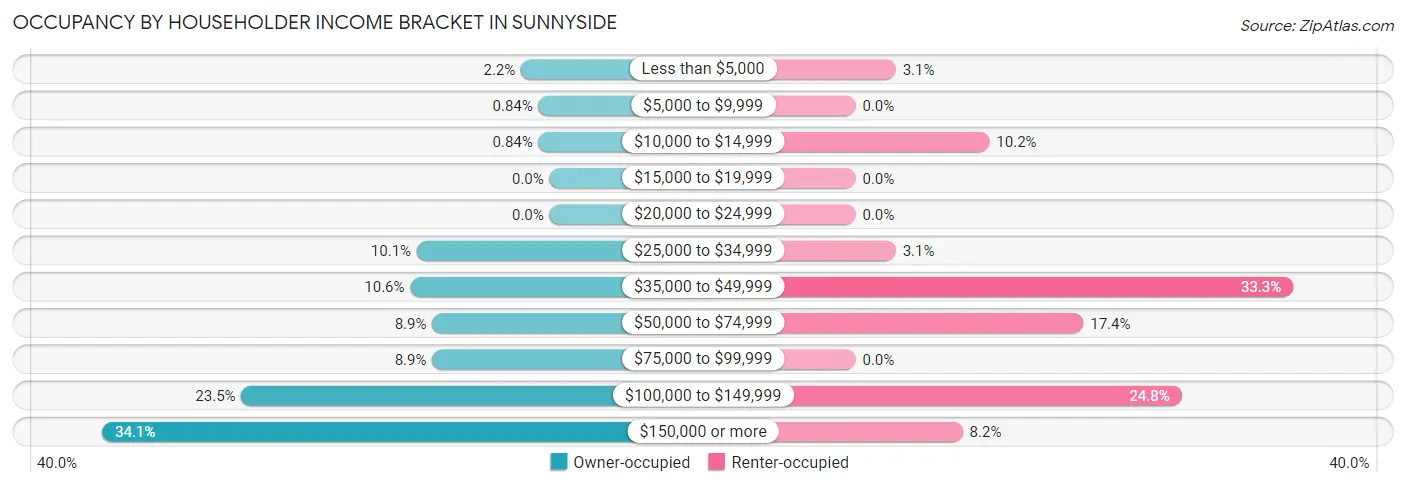
| Income Bracket | Owner-occupied | Renter-occupied |
| Less than $5,000 | 26 (2.2%) | 9 (3.1%) |
| $5,000 to $9,999 | 10 (0.8%) | 0 (0.0%) |
| $10,000 to $14,999 | 10 (0.8%) | 30 (10.2%) |
| $15,000 to $19,999 | 0 (0.0%) | 0 (0.0%) |
| $20,000 to $24,999 | 0 (0.0%) | 0 (0.0%) |
| $25,000 to $34,999 | 121 (10.1%) | 9 (3.1%) |
| $35,000 to $49,999 | 127 (10.6%) | 98 (33.3%) |
| $50,000 to $74,999 | 107 (8.9%) | 51 (17.3%) |
| $75,000 to $99,999 | 107 (8.9%) | 0 (0.0%) |
| $100,000 to $149,999 | 281 (23.5%) | 73 (24.8%) |
| $150,000 or more | 408 (34.1%) | 24 (8.2%) |
| Total | 1,197 (100.0%) | 294 (100.0%) |
Monthly Housing Cost Tiers in Sunnyside
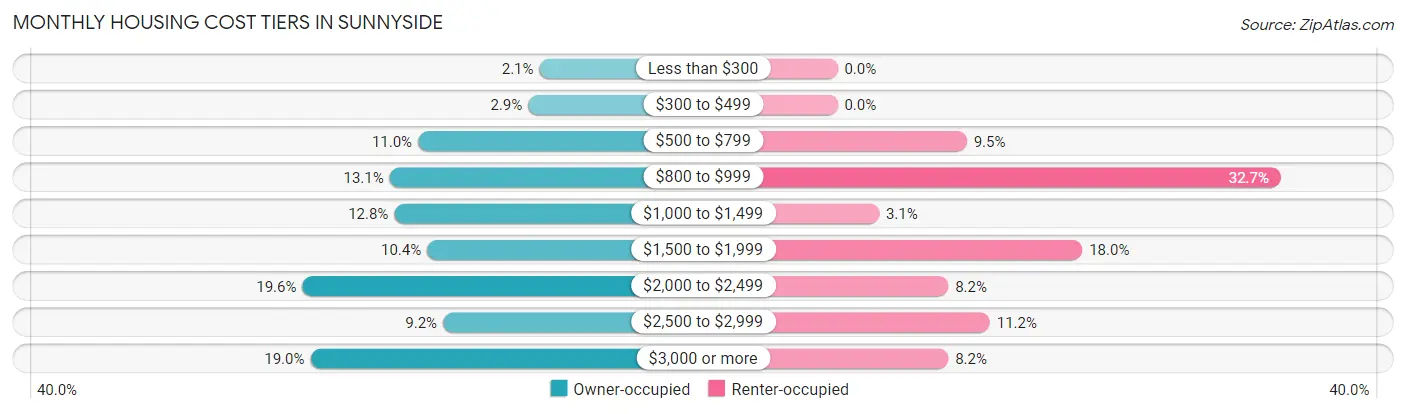
| Monthly Cost | Owner-occupied | Renter-occupied |
| Less than $300 | 25 (2.1%) | 0 (0.0%) |
| $300 to $499 | 35 (2.9%) | 0 (0.0%) |
| $500 to $799 | 132 (11.0%) | 28 (9.5%) |
| $800 to $999 | 157 (13.1%) | 96 (32.7%) |
| $1,000 to $1,499 | 153 (12.8%) | 9 (3.1%) |
| $1,500 to $1,999 | 124 (10.4%) | 53 (18.0%) |
| $2,000 to $2,499 | 234 (19.6%) | 24 (8.2%) |
| $2,500 to $2,999 | 110 (9.2%) | 33 (11.2%) |
| $3,000 or more | 227 (19.0%) | 24 (8.2%) |
| Total | 1,197 (100.0%) | 294 (100.0%) |
Physical Housing Characteristics in Sunnyside
Housing Structures in Sunnyside
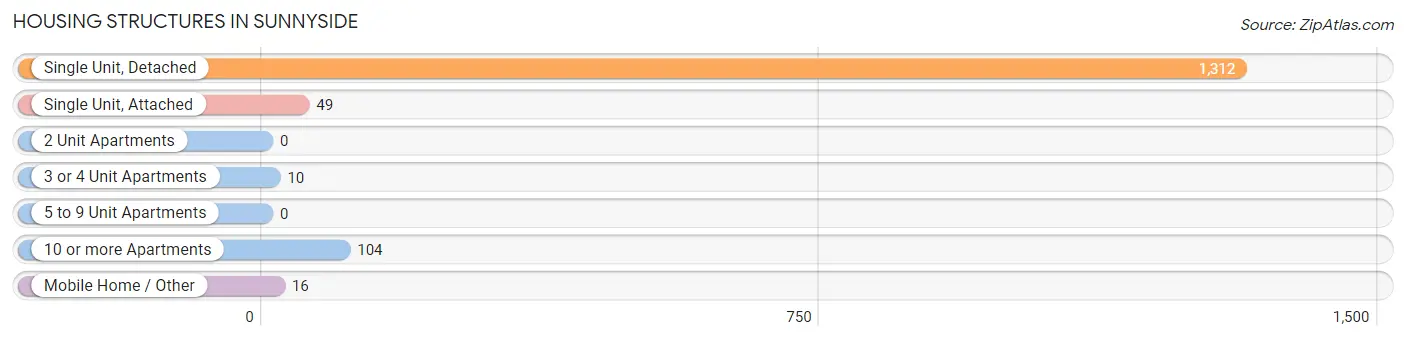
| Structure Type | # Housing Units | % Housing Units |
| Single Unit, Detached | 1,312 | 88.0% |
| Single Unit, Attached | 49 | 3.3% |
| 2 Unit Apartments | 0 | 0.0% |
| 3 or 4 Unit Apartments | 10 | 0.7% |
| 5 to 9 Unit Apartments | 0 | 0.0% |
| 10 or more Apartments | 104 | 7.0% |
| Mobile Home / Other | 16 | 1.1% |
| Total | 1,491 | 100.0% |
Housing Structures by Occupancy in Sunnyside
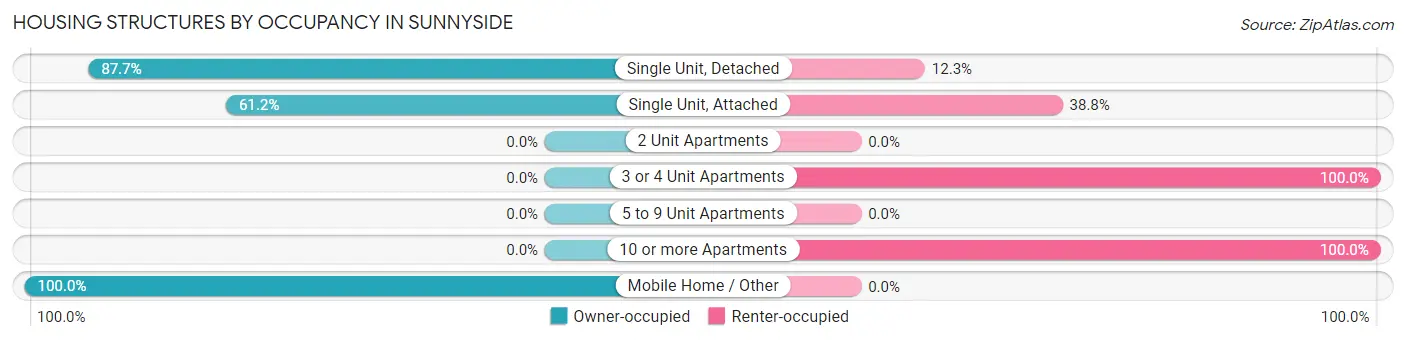
| Structure Type | Owner-occupied | Renter-occupied |
| Single Unit, Detached | 1,151 (87.7%) | 161 (12.3%) |
| Single Unit, Attached | 30 (61.2%) | 19 (38.8%) |
| 2 Unit Apartments | 0 (0.0%) | 0 (0.0%) |
| 3 or 4 Unit Apartments | 0 (0.0%) | 10 (100.0%) |
| 5 to 9 Unit Apartments | 0 (0.0%) | 0 (0.0%) |
| 10 or more Apartments | 0 (0.0%) | 104 (100.0%) |
| Mobile Home / Other | 16 (100.0%) | 0 (0.0%) |
| Total | 1,197 (80.3%) | 294 (19.7%) |
Housing Structures by Number of Rooms in Sunnyside
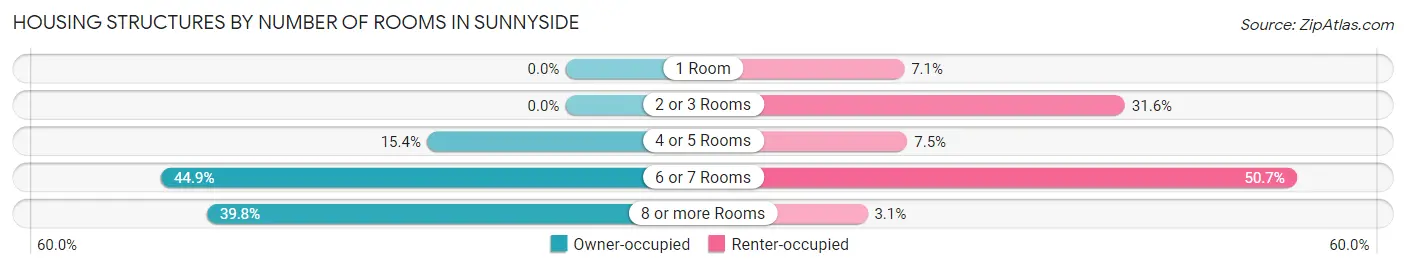
| Number of Rooms | Owner-occupied | Renter-occupied |
| 1 Room | 0 (0.0%) | 21 (7.1%) |
| 2 or 3 Rooms | 0 (0.0%) | 93 (31.6%) |
| 4 or 5 Rooms | 184 (15.4%) | 22 (7.5%) |
| 6 or 7 Rooms | 537 (44.9%) | 149 (50.7%) |
| 8 or more Rooms | 476 (39.8%) | 9 (3.1%) |
| Total | 1,197 (100.0%) | 294 (100.0%) |
Housing Structure by Heating Type in Sunnyside
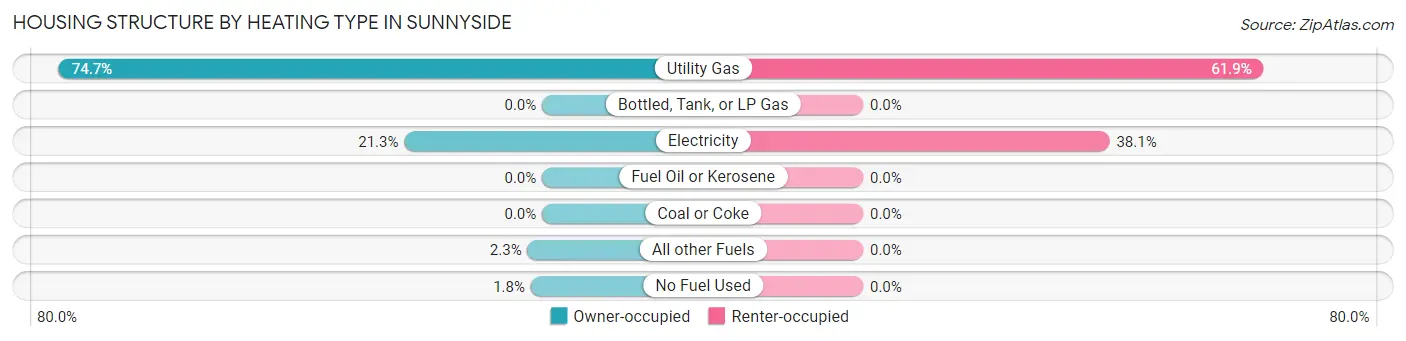
| Heating Type | Owner-occupied | Renter-occupied |
| Utility Gas | 894 (74.7%) | 182 (61.9%) |
| Bottled, Tank, or LP Gas | 0 (0.0%) | 0 (0.0%) |
| Electricity | 255 (21.3%) | 112 (38.1%) |
| Fuel Oil or Kerosene | 0 (0.0%) | 0 (0.0%) |
| Coal or Coke | 0 (0.0%) | 0 (0.0%) |
| All other Fuels | 27 (2.3%) | 0 (0.0%) |
| No Fuel Used | 21 (1.8%) | 0 (0.0%) |
| Total | 1,197 (100.0%) | 294 (100.0%) |
Household Vehicle Usage in Sunnyside
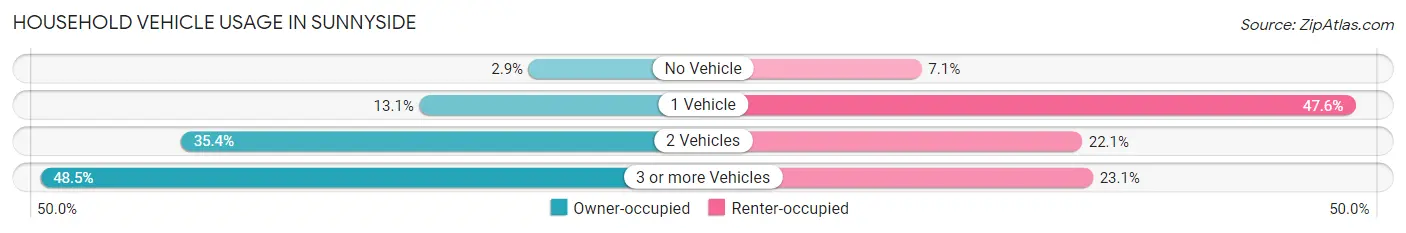
| Vehicles per Household | Owner-occupied | Renter-occupied |
| No Vehicle | 35 (2.9%) | 21 (7.1%) |
| 1 Vehicle | 157 (13.1%) | 140 (47.6%) |
| 2 Vehicles | 424 (35.4%) | 65 (22.1%) |
| 3 or more Vehicles | 581 (48.5%) | 68 (23.1%) |
| Total | 1,197 (100.0%) | 294 (100.0%) |
Real Estate & Mortgages in Sunnyside
Real Estate and Mortgage Overview in Sunnyside
| Characteristic | Without Mortgage | With Mortgage |
| Housing Units | 406 | 791 |
| Median Property Value | $385,600 | $412,500 |
| Median Household Income | $90,500 | $338 |
| Monthly Housing Costs | $835 | $227 |
| Real Estate Taxes | $2,636 | $30 |
Property Value by Mortgage Status in Sunnyside
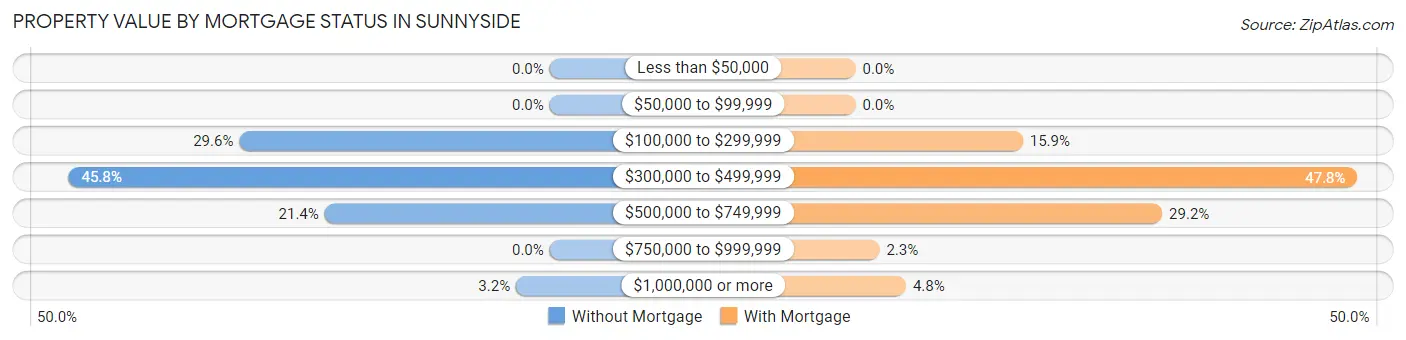
| Property Value | Without Mortgage | With Mortgage |
| Less than $50,000 | 0 (0.0%) | 0 (0.0%) |
| $50,000 to $99,999 | 0 (0.0%) | 0 (0.0%) |
| $100,000 to $299,999 | 120 (29.6%) | 126 (15.9%) |
| $300,000 to $499,999 | 186 (45.8%) | 378 (47.8%) |
| $500,000 to $749,999 | 87 (21.4%) | 231 (29.2%) |
| $750,000 to $999,999 | 0 (0.0%) | 18 (2.3%) |
| $1,000,000 or more | 13 (3.2%) | 38 (4.8%) |
| Total | 406 (100.0%) | 791 (100.0%) |
Household Income by Mortgage Status in Sunnyside
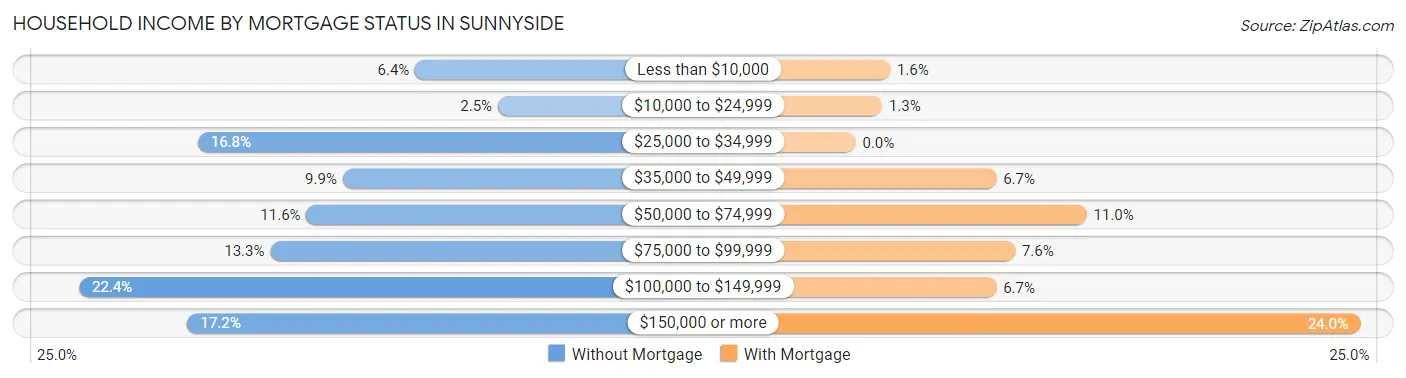
| Household Income | Without Mortgage | With Mortgage |
| Less than $10,000 | 26 (6.4%) | 13 (1.6%) |
| $10,000 to $24,999 | 10 (2.5%) | 10 (1.3%) |
| $25,000 to $34,999 | 68 (16.8%) | 0 (0.0%) |
| $35,000 to $49,999 | 40 (9.9%) | 53 (6.7%) |
| $50,000 to $74,999 | 47 (11.6%) | 87 (11.0%) |
| $75,000 to $99,999 | 54 (13.3%) | 60 (7.6%) |
| $100,000 to $149,999 | 91 (22.4%) | 53 (6.7%) |
| $150,000 or more | 70 (17.2%) | 190 (24.0%) |
| Total | 406 (100.0%) | 791 (100.0%) |
Property Value to Household Income Ratio in Sunnyside
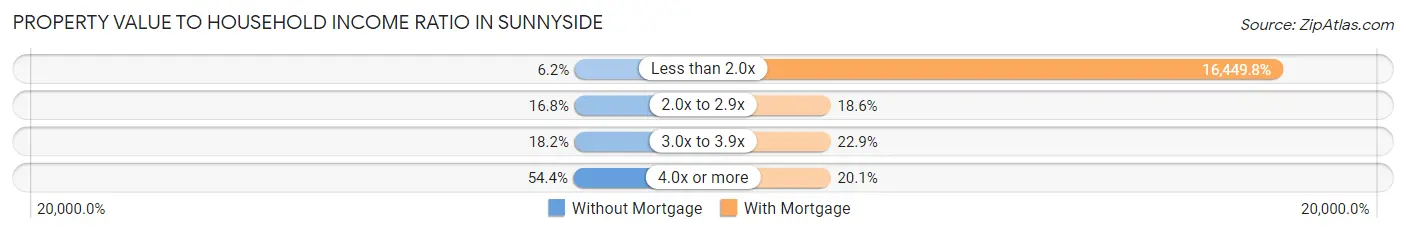
| Value-to-Income Ratio | Without Mortgage | With Mortgage |
| Less than 2.0x | 25 (6.2%) | 130,118 (16,449.8%) |
| 2.0x to 2.9x | 68 (16.8%) | 147 (18.6%) |
| 3.0x to 3.9x | 74 (18.2%) | 181 (22.9%) |
| 4.0x or more | 221 (54.4%) | 159 (20.1%) |
| Total | 406 (100.0%) | 791 (100.0%) |
Real Estate Taxes by Mortgage Status in Sunnyside
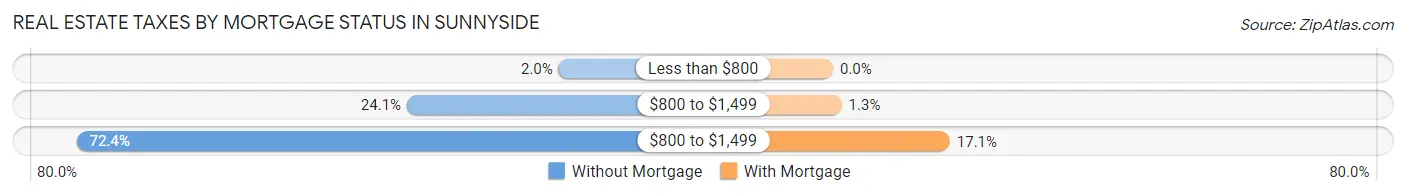
| Property Taxes | Without Mortgage | With Mortgage |
| Less than $800 | 8 (2.0%) | 0 (0.0%) |
| $800 to $1,499 | 98 (24.1%) | 10 (1.3%) |
| $800 to $1,499 | 294 (72.4%) | 135 (17.1%) |
| Total | 406 (100.0%) | 791 (100.0%) |
Health & Disability in Sunnyside
Health Insurance Coverage by Age in Sunnyside
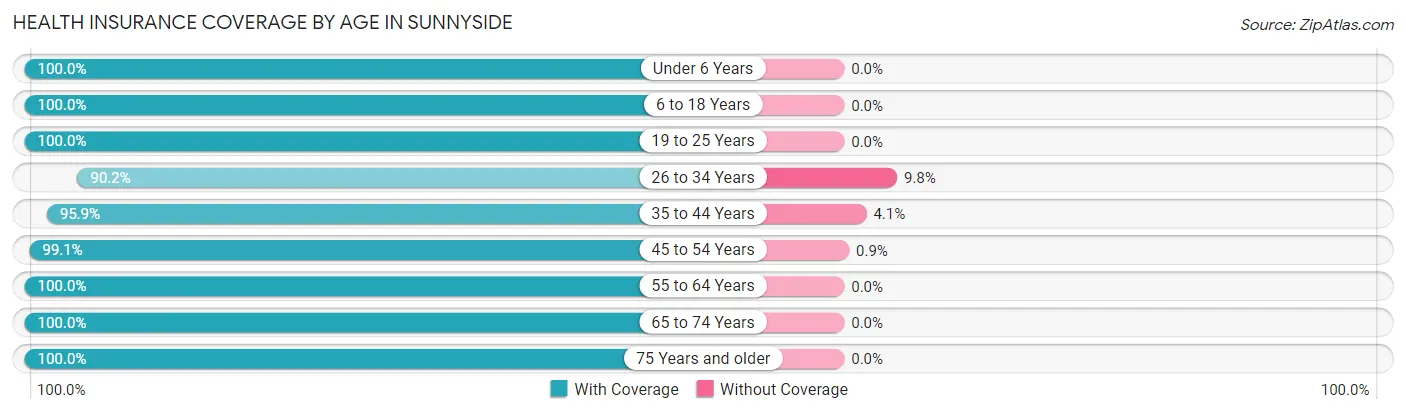
| Age Bracket | With Coverage | Without Coverage |
| Under 6 Years | 366 (100.0%) | 0 (0.0%) |
| 6 to 18 Years | 709 (100.0%) | 0 (0.0%) |
| 19 to 25 Years | 344 (100.0%) | 0 (0.0%) |
| 26 to 34 Years | 568 (90.2%) | 62 (9.8%) |
| 35 to 44 Years | 556 (95.9%) | 24 (4.1%) |
| 45 to 54 Years | 549 (99.1%) | 5 (0.9%) |
| 55 to 64 Years | 534 (100.0%) | 0 (0.0%) |
| 65 to 74 Years | 615 (100.0%) | 0 (0.0%) |
| 75 Years and older | 233 (100.0%) | 0 (0.0%) |
| Total | 4,474 (98.0%) | 91 (2.0%) |
Health Insurance Coverage by Citizenship Status in Sunnyside
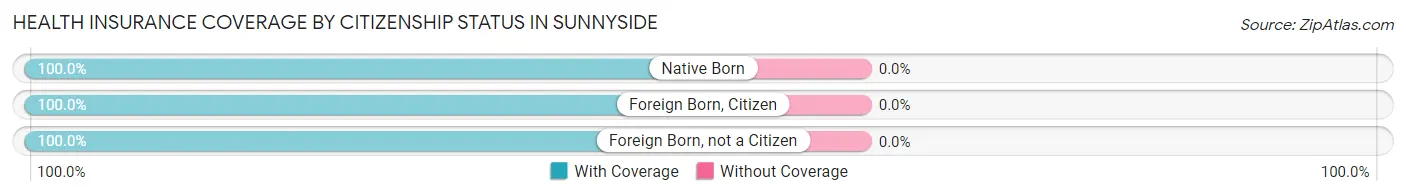
| Citizenship Status | With Coverage | Without Coverage |
| Native Born | 366 (100.0%) | 0 (0.0%) |
| Foreign Born, Citizen | 709 (100.0%) | 0 (0.0%) |
| Foreign Born, not a Citizen | 344 (100.0%) | 0 (0.0%) |
Health Insurance Coverage by Household Income in Sunnyside
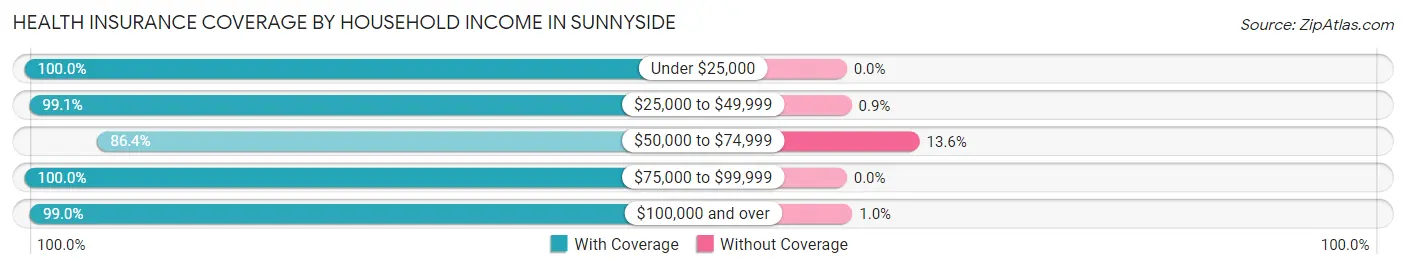
| Household Income | With Coverage | Without Coverage |
| Under $25,000 | 188 (100.0%) | 0 (0.0%) |
| $25,000 to $49,999 | 882 (99.1%) | 8 (0.9%) |
| $50,000 to $74,999 | 342 (86.4%) | 54 (13.6%) |
| $75,000 to $99,999 | 298 (100.0%) | 0 (0.0%) |
| $100,000 and over | 2,759 (99.0%) | 29 (1.0%) |
Public vs Private Health Insurance Coverage by Age in Sunnyside
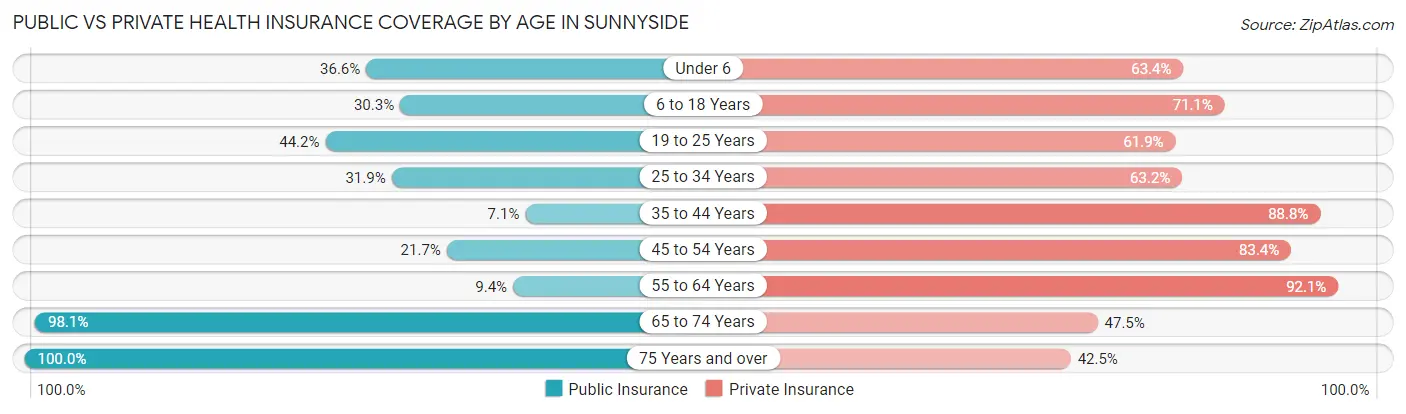
| Age Bracket | Public Insurance | Private Insurance |
| Under 6 | 134 (36.6%) | 232 (63.4%) |
| 6 to 18 Years | 215 (30.3%) | 504 (71.1%) |
| 19 to 25 Years | 152 (44.2%) | 213 (61.9%) |
| 25 to 34 Years | 201 (31.9%) | 398 (63.2%) |
| 35 to 44 Years | 41 (7.1%) | 515 (88.8%) |
| 45 to 54 Years | 120 (21.7%) | 462 (83.4%) |
| 55 to 64 Years | 50 (9.4%) | 492 (92.1%) |
| 65 to 74 Years | 603 (98.1%) | 292 (47.5%) |
| 75 Years and over | 233 (100.0%) | 99 (42.5%) |
| Total | 1,749 (38.3%) | 3,207 (70.3%) |
Disability Status by Sex by Age in Sunnyside
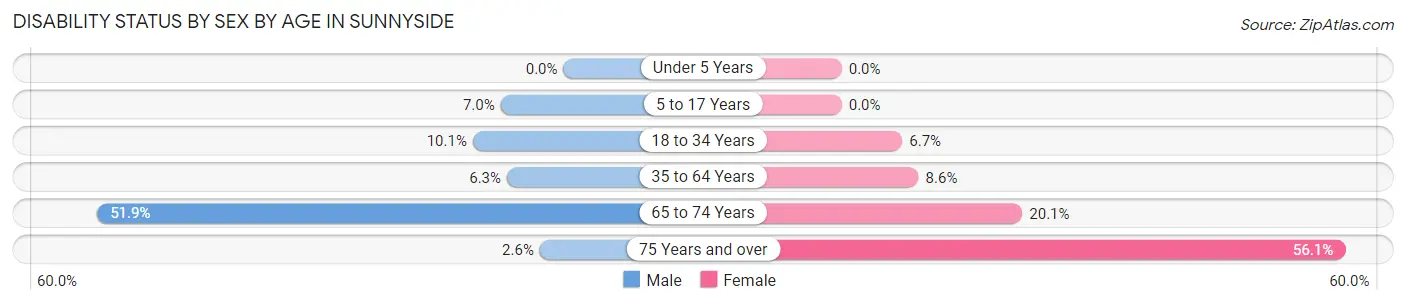
| Age Bracket | Male | Female |
| Under 5 Years | 0 (0.0%) | 0 (0.0%) |
| 5 to 17 Years | 32 (7.0%) | 0 (0.0%) |
| 18 to 34 Years | 46 (10.1%) | 36 (6.7%) |
| 35 to 64 Years | 52 (6.3%) | 72 (8.6%) |
| 65 to 74 Years | 136 (51.9%) | 71 (20.1%) |
| 75 Years and over | 2 (2.6%) | 88 (56.0%) |
Disability Class by Sex by Age in Sunnyside
Disability Class: Hearing Difficulty
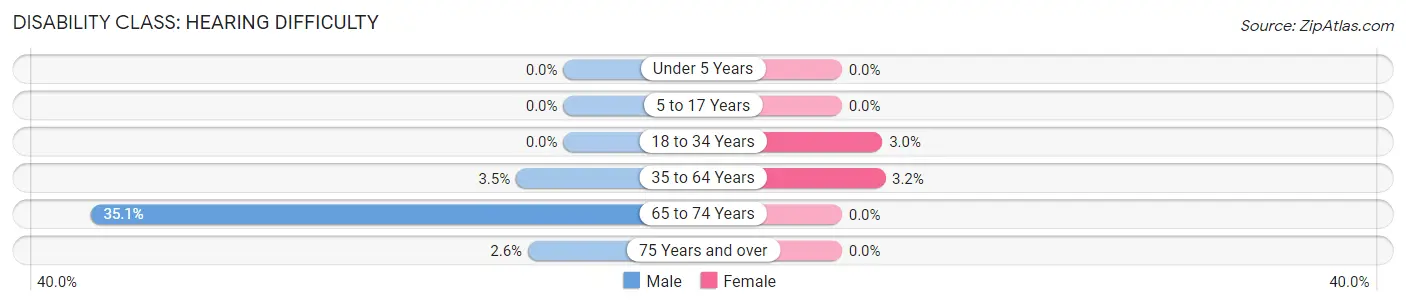
| Age Bracket | Male | Female |
| Under 5 Years | 0 (0.0%) | 0 (0.0%) |
| 5 to 17 Years | 0 (0.0%) | 0 (0.0%) |
| 18 to 34 Years | 0 (0.0%) | 16 (3.0%) |
| 35 to 64 Years | 29 (3.5%) | 27 (3.2%) |
| 65 to 74 Years | 92 (35.1%) | 0 (0.0%) |
| 75 Years and over | 2 (2.6%) | 0 (0.0%) |
Disability Class: Vision Difficulty
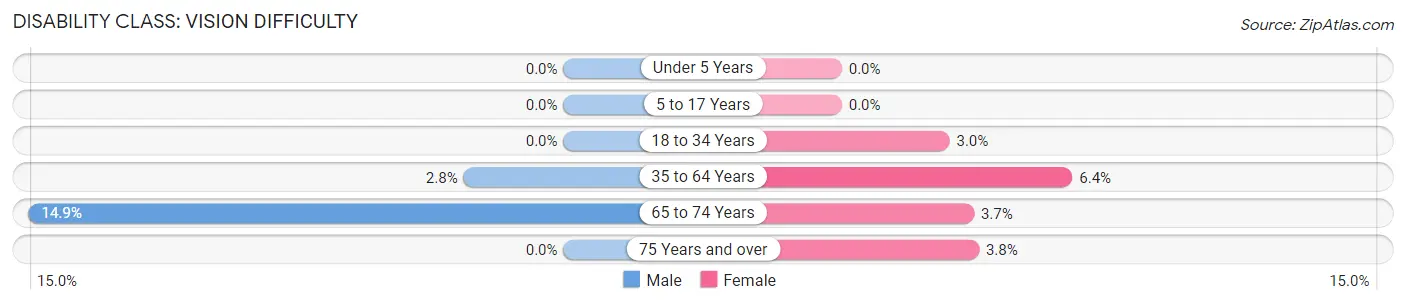
| Age Bracket | Male | Female |
| Under 5 Years | 0 (0.0%) | 0 (0.0%) |
| 5 to 17 Years | 0 (0.0%) | 0 (0.0%) |
| 18 to 34 Years | 0 (0.0%) | 16 (3.0%) |
| 35 to 64 Years | 23 (2.8%) | 54 (6.4%) |
| 65 to 74 Years | 39 (14.9%) | 13 (3.7%) |
| 75 Years and over | 0 (0.0%) | 6 (3.8%) |
Disability Class: Cognitive Difficulty
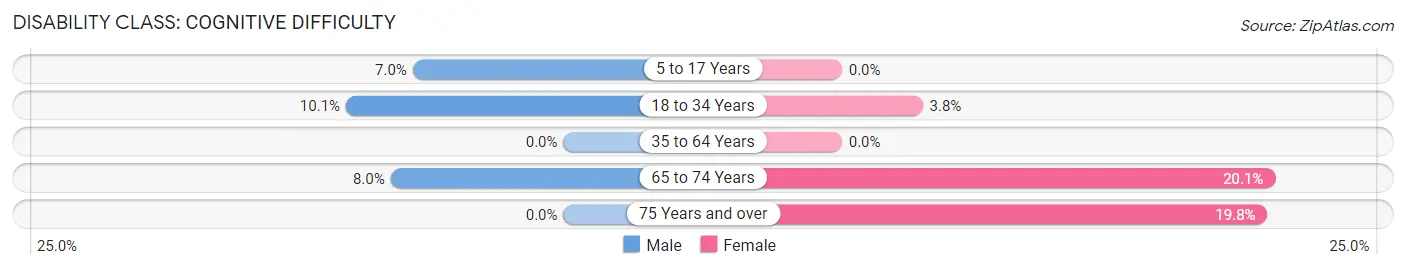
| Age Bracket | Male | Female |
| 5 to 17 Years | 32 (7.0%) | 0 (0.0%) |
| 18 to 34 Years | 46 (10.1%) | 20 (3.7%) |
| 35 to 64 Years | 0 (0.0%) | 0 (0.0%) |
| 65 to 74 Years | 21 (8.0%) | 71 (20.1%) |
| 75 Years and over | 0 (0.0%) | 31 (19.8%) |
Disability Class: Ambulatory Difficulty
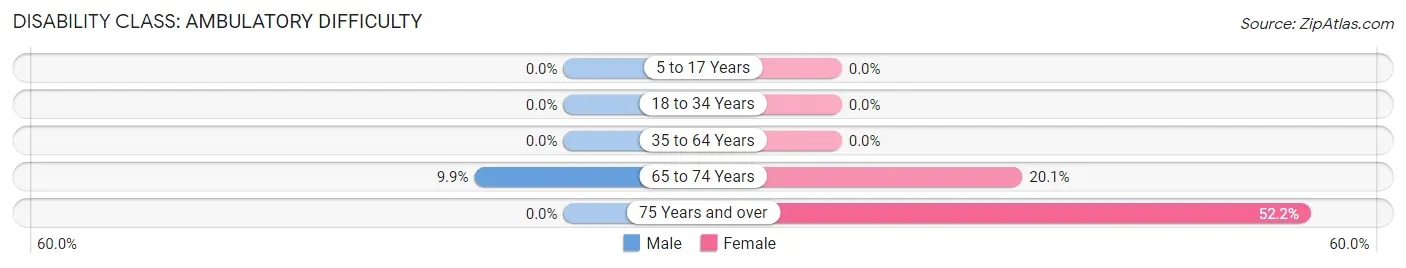
| Age Bracket | Male | Female |
| 5 to 17 Years | 0 (0.0%) | 0 (0.0%) |
| 18 to 34 Years | 0 (0.0%) | 0 (0.0%) |
| 35 to 64 Years | 0 (0.0%) | 0 (0.0%) |
| 65 to 74 Years | 26 (9.9%) | 71 (20.1%) |
| 75 Years and over | 0 (0.0%) | 82 (52.2%) |
Disability Class: Self-Care Difficulty
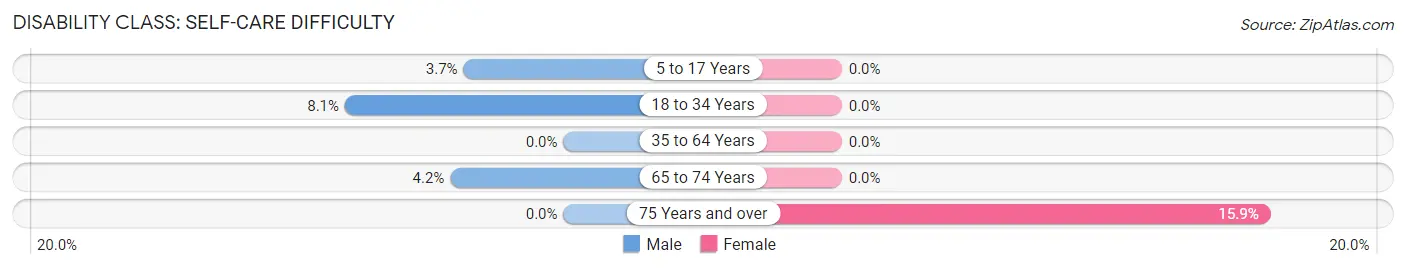
| Age Bracket | Male | Female |
| 5 to 17 Years | 17 (3.7%) | 0 (0.0%) |
| 18 to 34 Years | 37 (8.1%) | 0 (0.0%) |
| 35 to 64 Years | 0 (0.0%) | 0 (0.0%) |
| 65 to 74 Years | 11 (4.2%) | 0 (0.0%) |
| 75 Years and over | 0 (0.0%) | 25 (15.9%) |
Technology Access in Sunnyside
Computing Device Access in Sunnyside
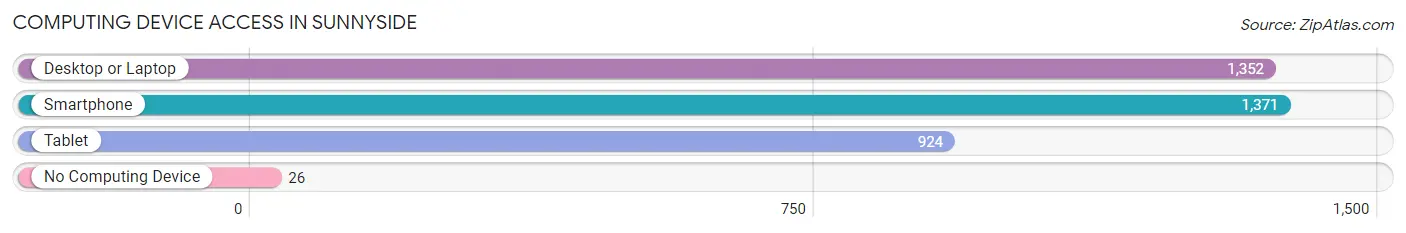
| Device Type | # Households | % Households |
| Desktop or Laptop | 1,352 | 90.7% |
| Smartphone | 1,371 | 91.9% |
| Tablet | 924 | 62.0% |
| No Computing Device | 26 | 1.7% |
| Total | 1,491 | 100.0% |
Internet Access in Sunnyside
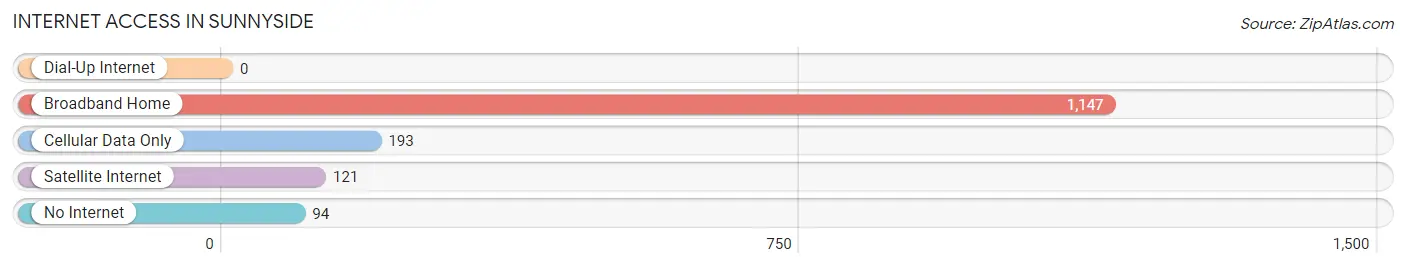
| Internet Type | # Households | % Households |
| Dial-Up Internet | 0 | 0.0% |
| Broadband Home | 1,147 | 76.9% |
| Cellular Data Only | 193 | 12.9% |
| Satellite Internet | 121 | 8.1% |
| No Internet | 94 | 6.3% |
| Total | 1,491 | 100.0% |
Sunnyside Summary
Sunnyside is a small unincorporated community located in Fresno County, California. It is situated in the San Joaquin Valley, approximately 8 miles south of the city of Fresno. Sunnyside is a rural community with a population of approximately 8,000 people.
History
Sunnyside was founded in 1872 by a group of settlers from the Midwest. The settlers were attracted to the area due to its fertile soil and mild climate. The community was originally known as “Sunnyside Station” and was a stop on the Southern Pacific Railroad. The town was officially incorporated in 1891 and was named after the nearby Sunnyside Canal.
In the early 1900s, Sunnyside was a thriving agricultural community. The town was known for its production of grapes, peaches, and other fruits and vegetables. The town also had a thriving dairy industry.
Geography
Sunnyside is located in the San Joaquin Valley, approximately 8 miles south of the city of Fresno. The town is situated at an elevation of approximately 300 feet above sea level. The climate in Sunnyside is mild and dry, with temperatures ranging from the mid-50s in the winter to the mid-90s in the summer.
The town is surrounded by agricultural land, with vineyards, orchards, and farms covering much of the surrounding area. The nearby Kings River provides irrigation for the area’s farms and ranches.
Economy
Sunnyside’s economy is largely based on agriculture. The town is home to several wineries and vineyards, as well as numerous farms and ranches. The town is also home to several small businesses, including restaurants, shops, and other services.
Demographics
As of the 2010 census, Sunnyside had a population of 8,000 people. The racial makeup of the town was 75.3% White, 0.7% African American, 0.7% Native American, 0.7% Asian, 0.2% Pacific Islander, and 21.1% from other races. The median household income in Sunnyside was $37,000, and the median age was 33.
Sunnyside is a small, rural community with a rich history and a strong agricultural economy. The town is home to a diverse population and offers a variety of services and amenities. Sunnyside is a great place to live, work, and play.
Common Questions
What is Per Capita Income in Sunnyside?
Per Capita income in Sunnyside is $39,018.
What is the Median Family Income in Sunnyside?
Median Family Income in Sunnyside is $127,881.
What is the Median Household income in Sunnyside?
Median Household Income in Sunnyside is $106,750.
What is Income or Wage Gap in Sunnyside?
Income or Wage Gap in Sunnyside is 34.7%.
Women in Sunnyside earn 65.3 cents for every dollar earned by a man.
What is Inequality or Gini Index in Sunnyside?
Inequality or Gini Index in Sunnyside is 0.44.
What is the Total Population of Sunnyside?
Total Population of Sunnyside is 4,565.
What is the Total Male Population of Sunnyside?
Total Male Population of Sunnyside is 2,268.
What is the Total Female Population of Sunnyside?
Total Female Population of Sunnyside is 2,297.
What is the Ratio of Males per 100 Females in Sunnyside?
There are 98.74 Males per 100 Females in Sunnyside.
What is the Ratio of Females per 100 Males in Sunnyside?
There are 101.28 Females per 100 Males in Sunnyside.
What is the Median Population Age in Sunnyside?
Median Population Age in Sunnyside is 39.8 Years.
What is the Average Family Size in Sunnyside
Average Family Size in Sunnyside is 3.5 People.
What is the Average Household Size in Sunnyside
Average Household Size in Sunnyside is 3.1 People.
How Large is the Labor Force in Sunnyside?
There are 2,267 People in the Labor Forcein in Sunnyside.
What is the Percentage of People in the Labor Force in Sunnyside?
61.7% of People are in the Labor Force in Sunnyside.
What is the Unemployment Rate in Sunnyside?
Unemployment Rate in Sunnyside is 5.7%.