Cities with the Largest Mexican American Indian Community in Michigan
RELATED REPORTS & OPTIONS
Mexican American Indian
Michigan
Compare Cities
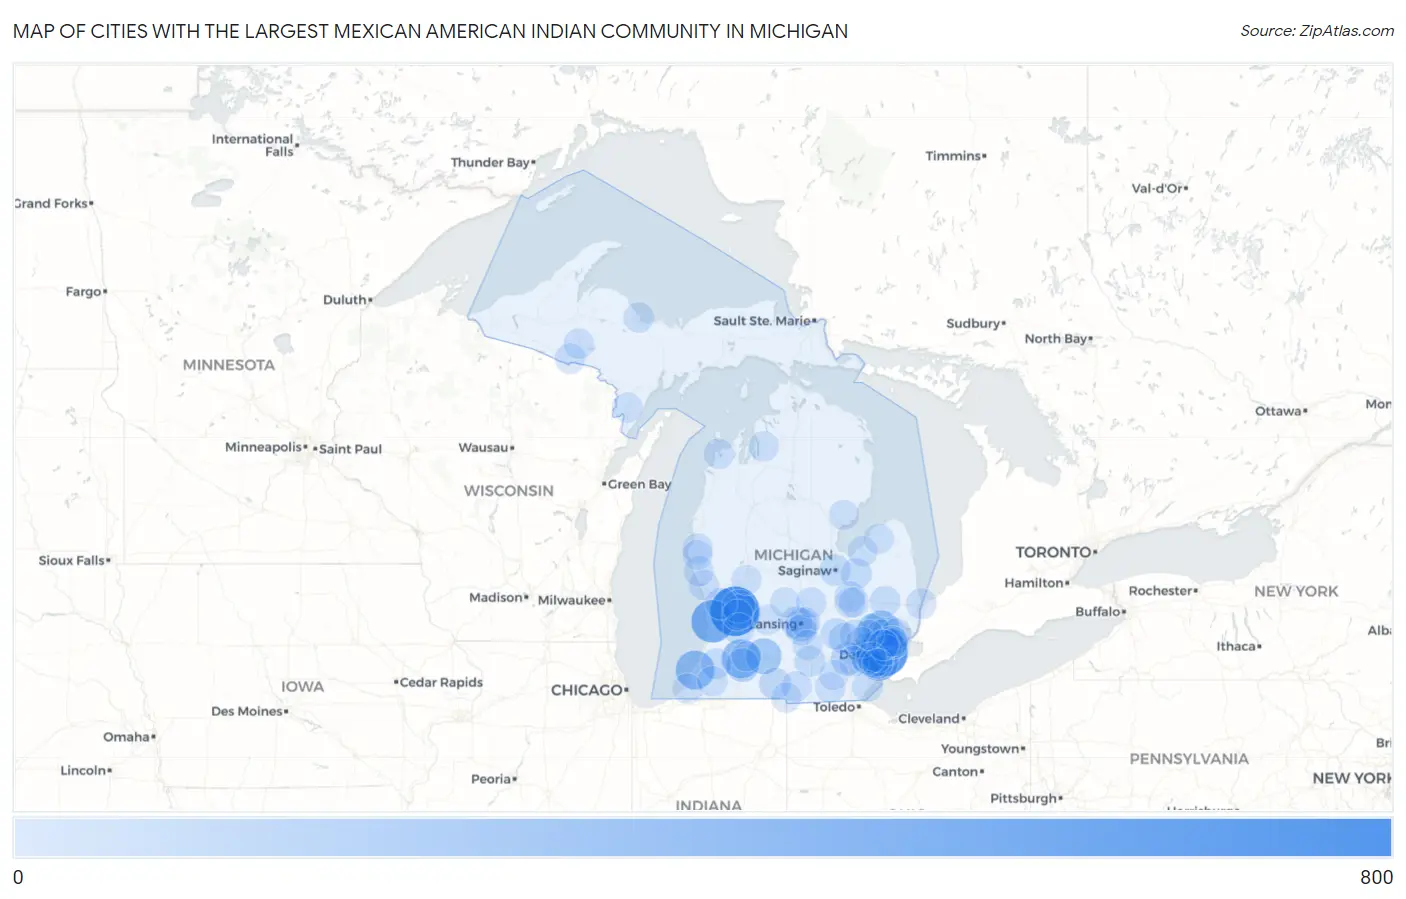
Map of Cities with the Largest Mexican American Indian Community in Michigan
0
800
Cities with the Largest Mexican American Indian Community in Michigan
| City | Mexican American Indian | vs State | vs National | |
| 1. | Wyoming | 609 | 5,967(10.21%)#1 | 517,224(0.12%)#131 |
| 2. | Detroit | 554 | 5,967(9.28%)#2 | 517,224(0.11%)#150 |
| 3. | Holland | 383 | 5,967(6.42%)#3 | 517,224(0.07%)#240 |
| 4. | Lincoln Park | 275 | 5,967(4.61%)#4 | 517,224(0.05%)#347 |
| 5. | Kalamazoo | 267 | 5,967(4.47%)#5 | 517,224(0.05%)#366 |
| 6. | Benton Heights | 265 | 5,967(4.44%)#6 | 517,224(0.05%)#370 |
| 7. | Rochester Hills | 191 | 5,967(3.20%)#7 | 517,224(0.04%)#499 |
| 8. | Westland | 177 | 5,967(2.97%)#8 | 517,224(0.03%)#528 |
| 9. | Battle Creek | 170 | 5,967(2.85%)#9 | 517,224(0.03%)#543 |
| 10. | Kentwood | 144 | 5,967(2.41%)#10 | 517,224(0.03%)#647 |
| 11. | Livonia | 111 | 5,967(1.86%)#11 | 517,224(0.02%)#777 |
| 12. | Portage | 106 | 5,967(1.78%)#12 | 517,224(0.02%)#807 |
| 13. | Ann Arbor | 96 | 5,967(1.61%)#13 | 517,224(0.02%)#864 |
| 14. | Grand Rapids | 88 | 5,967(1.47%)#14 | 517,224(0.02%)#914 |
| 15. | Lansing | 83 | 5,967(1.39%)#15 | 517,224(0.02%)#959 |
| 16. | Allen Park | 59 | 5,967(0.99%)#16 | 517,224(0.01%)#1,175 |
| 17. | Wayne | 56 | 5,967(0.94%)#17 | 517,224(0.01%)#1,220 |
| 18. | Brighton | 53 | 5,967(0.89%)#18 | 517,224(0.01%)#1,262 |
| 19. | Coldwater | 52 | 5,967(0.87%)#19 | 517,224(0.01%)#1,274 |
| 20. | Allendale | 49 | 5,967(0.82%)#20 | 517,224(0.01%)#1,311 |
| 21. | Waverly | 49 | 5,967(0.82%)#21 | 517,224(0.01%)#1,314 |
| 22. | Dearborn | 45 | 5,967(0.75%)#22 | 517,224(0.01%)#1,367 |
| 23. | Pontiac | 45 | 5,967(0.75%)#23 | 517,224(0.01%)#1,372 |
| 24. | Utica | 41 | 5,967(0.69%)#24 | 517,224(0.01%)#1,448 |
| 25. | Saginaw | 37 | 5,967(0.62%)#25 | 517,224(0.01%)#1,521 |
| 26. | Wayland | 36 | 5,967(0.60%)#26 | 517,224(0.01%)#1,558 |
| 27. | Howell | 32 | 5,967(0.54%)#27 | 517,224(0.01%)#1,642 |
| 28. | Jackson | 30 | 5,967(0.50%)#28 | 517,224(0.01%)#1,688 |
| 29. | Auburn Hills | 30 | 5,967(0.50%)#29 | 517,224(0.01%)#1,690 |
| 30. | Warren | 27 | 5,967(0.45%)#30 | 517,224(0.01%)#1,757 |
| 31. | Vassar | 27 | 5,967(0.45%)#31 | 517,224(0.01%)#1,779 |
| 32. | Troy | 26 | 5,967(0.44%)#32 | 517,224(0.01%)#1,786 |
| 33. | Holt | 25 | 5,967(0.42%)#33 | 517,224(0.00%)#1,826 |
| 34. | Milford | 23 | 5,967(0.39%)#34 | 517,224(0.00%)#1,900 |
| 35. | Cutlerville | 20 | 5,967(0.34%)#35 | 517,224(0.00%)#1,987 |
| 36. | Imlay City | 20 | 5,967(0.34%)#36 | 517,224(0.00%)#1,999 |
| 37. | Lawrence | 20 | 5,967(0.34%)#37 | 517,224(0.00%)#2,008 |
| 38. | Monroe | 19 | 5,967(0.32%)#38 | 517,224(0.00%)#2,025 |
| 39. | Mount Clemens | 18 | 5,967(0.30%)#39 | 517,224(0.00%)#2,075 |
| 40. | Novi | 16 | 5,967(0.27%)#40 | 517,224(0.00%)#2,149 |
| 41. | Ferndale | 15 | 5,967(0.25%)#41 | 517,224(0.00%)#2,201 |
| 42. | East Lansing | 14 | 5,967(0.23%)#42 | 517,224(0.00%)#2,239 |
| 43. | Hart | 14 | 5,967(0.23%)#43 | 517,224(0.00%)#2,271 |
| 44. | St Clair Shores | 13 | 5,967(0.22%)#44 | 517,224(0.00%)#2,289 |
| 45. | Beecher | 12 | 5,967(0.20%)#45 | 517,224(0.00%)#2,369 |
| 46. | New Troy | 12 | 5,967(0.20%)#46 | 517,224(0.00%)#2,400 |
| 47. | Gaastra | 12 | 5,967(0.20%)#47 | 517,224(0.00%)#2,403 |
| 48. | Port Huron | 11 | 5,967(0.18%)#48 | 517,224(0.00%)#2,415 |
| 49. | Hamtramck | 11 | 5,967(0.18%)#49 | 517,224(0.00%)#2,418 |
| 50. | Hillsdale | 10 | 5,967(0.17%)#50 | 517,224(0.00%)#2,498 |
| 51. | Flint | 9 | 5,967(0.15%)#51 | 517,224(0.00%)#2,538 |
| 52. | Muskegon | 9 | 5,967(0.15%)#52 | 517,224(0.00%)#2,548 |
| 53. | Eastpointe | 9 | 5,967(0.15%)#53 | 517,224(0.00%)#2,551 |
| 54. | Adrian | 9 | 5,967(0.15%)#54 | 517,224(0.00%)#2,559 |
| 55. | Ypsilanti | 9 | 5,967(0.15%)#55 | 517,224(0.00%)#2,560 |
| 56. | Glen Arbor | 9 | 5,967(0.15%)#56 | 517,224(0.00%)#2,611 |
| 57. | Amasa | 9 | 5,967(0.15%)#57 | 517,224(0.00%)#2,612 |
| 58. | Roseville | 8 | 5,967(0.13%)#58 | 517,224(0.00%)#2,619 |
| 59. | Dowagiac | 8 | 5,967(0.13%)#59 | 517,224(0.00%)#2,656 |
| 60. | Ovid | 8 | 5,967(0.13%)#60 | 517,224(0.00%)#2,671 |
| 61. | Marquette | 7 | 5,967(0.12%)#61 | 517,224(0.00%)#2,703 |
| 62. | Whitehall | 7 | 5,967(0.12%)#62 | 517,224(0.00%)#2,734 |
| 63. | Unionville | 7 | 5,967(0.12%)#63 | 517,224(0.00%)#2,766 |
| 64. | Hazel Park | 6 | 5,967(0.10%)#64 | 517,224(0.00%)#2,799 |
| 65. | Taylor | 5 | 5,967(0.08%)#65 | 517,224(0.00%)#2,858 |
| 66. | Burton | 5 | 5,967(0.08%)#66 | 517,224(0.00%)#2,862 |
| 67. | Inkster | 5 | 5,967(0.08%)#67 | 517,224(0.00%)#2,865 |
| 68. | Shelby | 4 | 5,967(0.07%)#68 | 517,224(0.00%)#2,953 |
| 69. | Leslie | 4 | 5,967(0.07%)#69 | 517,224(0.00%)#2,957 |
| 70. | Lake Odessa | 4 | 5,967(0.07%)#70 | 517,224(0.00%)#2,958 |
| 71. | Comstock Northwest | 3 | 5,967(0.05%)#71 | 517,224(0.00%)#3,006 |
| 72. | Orchard Lake Village | 3 | 5,967(0.05%)#72 | 517,224(0.00%)#3,014 |
| 73. | Pewamo | 3 | 5,967(0.05%)#73 | 517,224(0.00%)#3,044 |
| 74. | Twining | 3 | 5,967(0.05%)#74 | 517,224(0.00%)#3,060 |
| 75. | Clinton | 2 | 5,967(0.03%)#75 | 517,224(0.00%)#3,089 |
| 76. | Elkton | 2 | 5,967(0.03%)#76 | 517,224(0.00%)#3,120 |
| 77. | Montgomery | 2 | 5,967(0.03%)#77 | 517,224(0.00%)#3,141 |
| 78. | Southgate | 1 | 5,967(0.02%)#78 | 517,224(0.00%)#3,156 |
| 79. | Bellaire | 1 | 5,967(0.02%)#79 | 517,224(0.00%)#3,195 |
| 80. | Sand Lake | 1 | 5,967(0.02%)#80 | 517,224(0.00%)#3,205 |
| 81. | Daggett | 1 | 5,967(0.02%)#81 | 517,224(0.00%)#3,218 |
Common Questions
What are the Top 10 Cities with the Largest Mexican American Indian Community in Michigan?
Top 10 Cities with the Largest Mexican American Indian Community in Michigan are:
#1
609
#2
554
#3
383
#4
275
#5
267
#6
265
#7
191
#8
177
#9
170
#10
144
What city has the Largest Mexican American Indian Community in Michigan?
Wyoming has the Largest Mexican American Indian Community in Michigan with 609.
What is the Total Mexican American Indian Population in the State of Michigan?
Total Mexican American Indian Population in Michigan is 5,967.
What is the Total Mexican American Indian Population in the United States?
Total Mexican American Indian Population in the United States is 517,224.