Cities with the Largest Mexican American Indian Community in Missouri
RELATED REPORTS & OPTIONS
Mexican American Indian
Missouri
Compare Cities
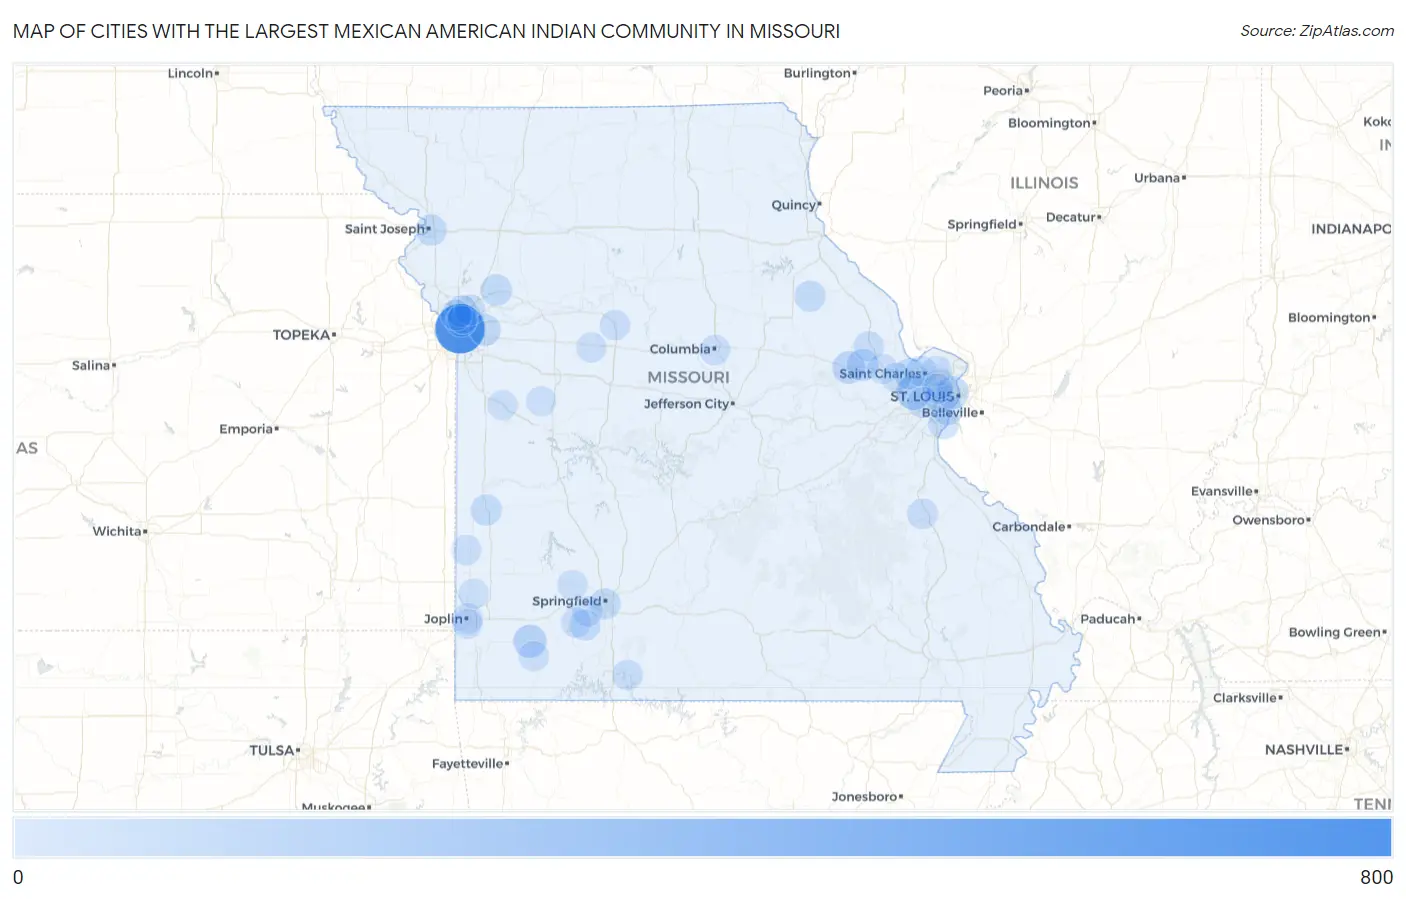
Map of Cities with the Largest Mexican American Indian Community in Missouri
0
800

Cities with the Largest Mexican American Indian Community in Missouri
| City | Mexican American Indian | vs State | vs National | |
| 1. | Kansas City | 772 | 2,285(33.79%)#1 | 517,224(0.15%)#82 |
| 2. | Chesterfield | 171 | 2,285(7.48%)#2 | 517,224(0.03%)#537 |
| 3. | Monett | 114 | 2,285(4.99%)#3 | 517,224(0.02%)#766 |
| 4. | St Louis | 92 | 2,285(4.03%)#4 | 517,224(0.02%)#886 |
| 5. | Warrenton | 92 | 2,285(4.03%)#5 | 517,224(0.02%)#891 |
| 6. | Wright City | 69 | 2,285(3.02%)#6 | 517,224(0.01%)#1,072 |
| 7. | Independence | 57 | 2,285(2.49%)#7 | 517,224(0.01%)#1,196 |
| 8. | Excelsior Springs | 52 | 2,285(2.28%)#8 | 517,224(0.01%)#1,275 |
| 9. | Gladstone | 50 | 2,285(2.19%)#9 | 517,224(0.01%)#1,292 |
| 10. | St Peters | 49 | 2,285(2.14%)#10 | 517,224(0.01%)#1,308 |
| 11. | St Joseph | 40 | 2,285(1.75%)#11 | 517,224(0.01%)#1,452 |
| 12. | Nevada | 40 | 2,285(1.75%)#12 | 517,224(0.01%)#1,463 |
| 13. | Springfield | 36 | 2,285(1.58%)#13 | 517,224(0.01%)#1,542 |
| 14. | Oakville | 36 | 2,285(1.58%)#14 | 517,224(0.01%)#1,546 |
| 15. | Clever | 36 | 2,285(1.58%)#15 | 517,224(0.01%)#1,562 |
| 16. | Vandalia | 35 | 2,285(1.53%)#16 | 517,224(0.01%)#1,589 |
| 17. | Pleasant Valley | 26 | 2,285(1.14%)#17 | 517,224(0.01%)#1,809 |
| 18. | Lemay | 23 | 2,285(1.01%)#18 | 517,224(0.00%)#1,890 |
| 19. | North Kansas City | 23 | 2,285(1.01%)#19 | 517,224(0.00%)#1,905 |
| 20. | Northmoor | 21 | 2,285(0.92%)#20 | 517,224(0.00%)#1,976 |
| 21. | St Charles | 19 | 2,285(0.83%)#21 | 517,224(0.00%)#2,015 |
| 22. | Manchester | 19 | 2,285(0.83%)#22 | 517,224(0.00%)#2,027 |
| 23. | Park Hills | 19 | 2,285(0.83%)#23 | 517,224(0.00%)#2,034 |
| 24. | Brentwood | 19 | 2,285(0.83%)#24 | 517,224(0.00%)#2,037 |
| 25. | Forsyth | 18 | 2,285(0.79%)#25 | 517,224(0.00%)#2,097 |
| 26. | Joplin | 16 | 2,285(0.70%)#26 | 517,224(0.00%)#2,152 |
| 27. | Troy | 14 | 2,285(0.61%)#27 | 517,224(0.00%)#2,253 |
| 28. | Republic | 13 | 2,285(0.57%)#28 | 517,224(0.00%)#2,301 |
| 29. | Marshall | 13 | 2,285(0.57%)#29 | 517,224(0.00%)#2,307 |
| 30. | Columbia | 11 | 2,285(0.48%)#30 | 517,224(0.00%)#2,405 |
| 31. | St John | 8 | 2,285(0.35%)#31 | 517,224(0.00%)#2,654 |
| 32. | Purdy | 7 | 2,285(0.31%)#32 | 517,224(0.00%)#2,749 |
| 33. | Liberal | 7 | 2,285(0.31%)#33 | 517,224(0.00%)#2,757 |
| 34. | Hazelwood | 6 | 2,285(0.26%)#34 | 517,224(0.00%)#2,784 |
| 35. | Garden City | 4 | 2,285(0.18%)#35 | 517,224(0.00%)#2,964 |
| 36. | Ash Grove | 4 | 2,285(0.18%)#36 | 517,224(0.00%)#2,966 |
| 37. | Chilhowee | 3 | 2,285(0.13%)#37 | 517,224(0.00%)#3,059 |
| 38. | Wentzville | 2 | 2,285(0.09%)#38 | 517,224(0.00%)#3,065 |
| 39. | Olivette | 2 | 2,285(0.09%)#39 | 517,224(0.00%)#3,080 |
| 40. | Sweet Springs | 2 | 2,285(0.09%)#40 | 517,224(0.00%)#3,109 |
| 41. | Billings | 2 | 2,285(0.09%)#41 | 517,224(0.00%)#3,116 |
| 42. | Avondale | 2 | 2,285(0.09%)#42 | 517,224(0.00%)#3,139 |
| 43. | Neck City | 2 | 2,285(0.09%)#43 | 517,224(0.00%)#3,145 |
| 44. | Dardenne Prairie | 1 | 2,285(0.04%)#44 | 517,224(0.00%)#3,163 |
| 45. | Dennis Acres | 1 | 2,285(0.04%)#45 | 517,224(0.00%)#3,222 |
Common Questions
What are the Top 10 Cities with the Largest Mexican American Indian Community in Missouri?
Top 10 Cities with the Largest Mexican American Indian Community in Missouri are:
#1
772
#2
171
#3
114
#4
92
#5
92
#6
69
#7
57
#8
52
#9
50
#10
49
What city has the Largest Mexican American Indian Community in Missouri?
Kansas City has the Largest Mexican American Indian Community in Missouri with 772.
What is the Total Mexican American Indian Population in the State of Missouri?
Total Mexican American Indian Population in Missouri is 2,285.
What is the Total Mexican American Indian Population in the United States?
Total Mexican American Indian Population in the United States is 517,224.