Cities with the Largest Mexican American Indian Community in New York
RELATED REPORTS & OPTIONS
Mexican American Indian
New York
Compare Cities
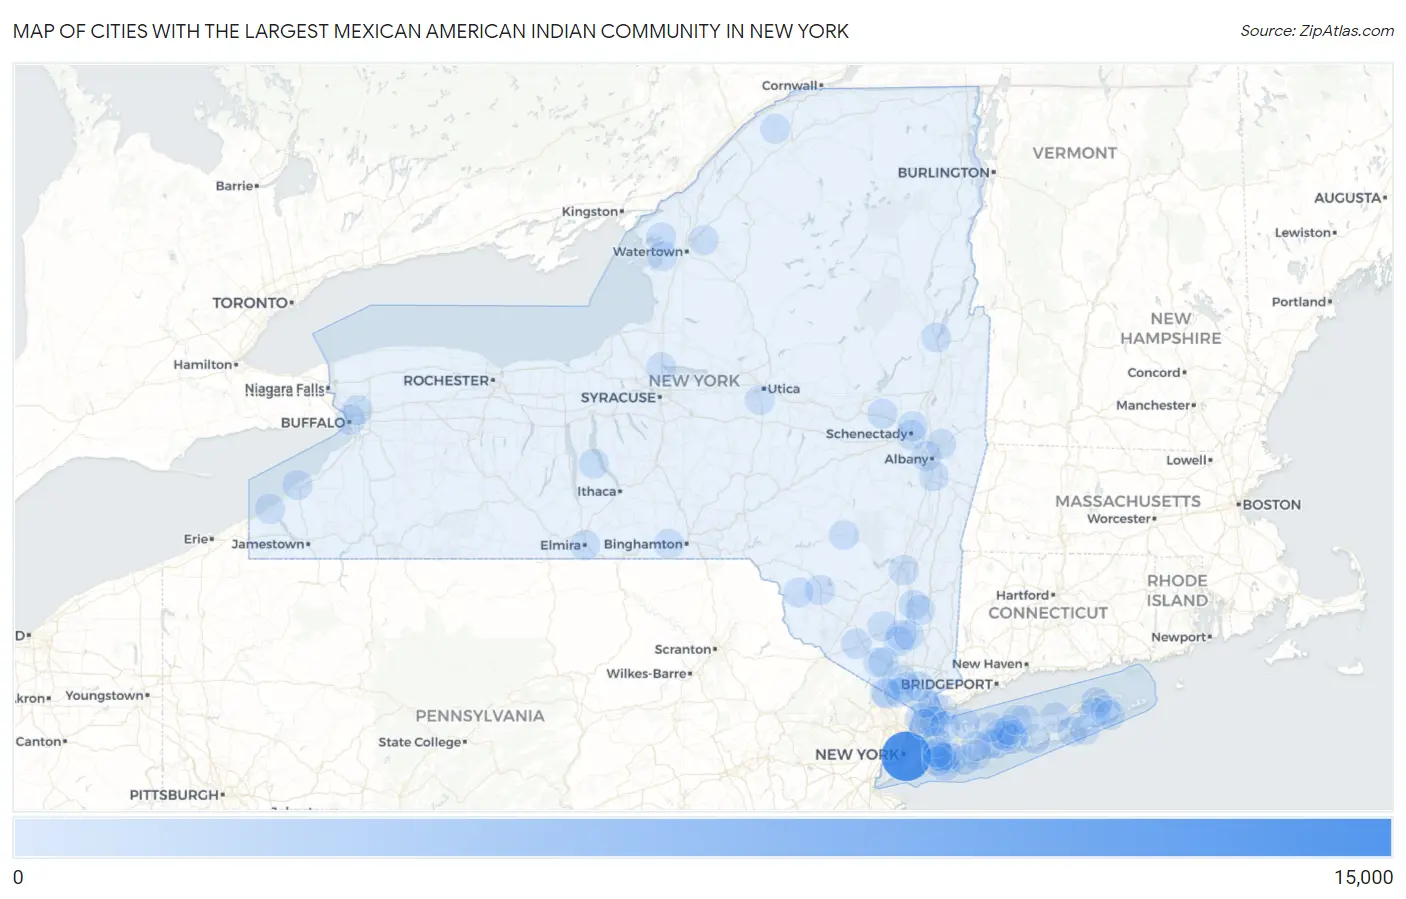
Map of Cities with the Largest Mexican American Indian Community in New York
0
15,000
Cities with the Largest Mexican American Indian Community in New York
| City | Mexican American Indian | vs State | vs National | |
| 1. | New York | 13,850 | 20,083(68.96%)#1 | 517,224(2.68%)#3 |
| 2. | Shelter Island | 505 | 20,083(2.51%)#2 | 517,224(0.10%)#169 |
| 3. | Yonkers | 447 | 20,083(2.23%)#3 | 517,224(0.09%)#196 |
| 4. | Middletown | 269 | 20,083(1.34%)#4 | 517,224(0.05%)#360 |
| 5. | New Rochelle | 260 | 20,083(1.29%)#5 | 517,224(0.05%)#376 |
| 6. | Central Islip | 213 | 20,083(1.06%)#6 | 517,224(0.04%)#450 |
| 7. | Farmingville | 207 | 20,083(1.03%)#7 | 517,224(0.04%)#470 |
| 8. | Elmira | 187 | 20,083(0.93%)#8 | 517,224(0.04%)#510 |
| 9. | Newburgh | 167 | 20,083(0.83%)#9 | 517,224(0.03%)#560 |
| 10. | White Plains | 166 | 20,083(0.83%)#10 | 517,224(0.03%)#563 |
| 11. | Suffern | 149 | 20,083(0.74%)#11 | 517,224(0.03%)#624 |
| 12. | Amsterdam | 147 | 20,083(0.73%)#12 | 517,224(0.03%)#633 |
| 13. | Monroe | 147 | 20,083(0.73%)#13 | 517,224(0.03%)#634 |
| 14. | Riverhead | 145 | 20,083(0.72%)#14 | 517,224(0.03%)#644 |
| 15. | Poughkeepsie | 142 | 20,083(0.71%)#15 | 517,224(0.03%)#653 |
| 16. | Liberty | 142 | 20,083(0.71%)#16 | 517,224(0.03%)#655 |
| 17. | Nesconset | 126 | 20,083(0.63%)#17 | 517,224(0.02%)#717 |
| 18. | Holtsville | 122 | 20,083(0.61%)#18 | 517,224(0.02%)#734 |
| 19. | Kingston | 113 | 20,083(0.56%)#19 | 517,224(0.02%)#769 |
| 20. | Schenectady | 111 | 20,083(0.55%)#20 | 517,224(0.02%)#778 |
| 21. | Port Chester | 103 | 20,083(0.51%)#21 | 517,224(0.02%)#829 |
| 22. | Roosevelt | 99 | 20,083(0.49%)#22 | 517,224(0.02%)#849 |
| 23. | Brentwood | 89 | 20,083(0.44%)#23 | 517,224(0.02%)#910 |
| 24. | Northwest Harbor | 73 | 20,083(0.36%)#24 | 517,224(0.01%)#1,040 |
| 25. | Elmont | 70 | 20,083(0.35%)#25 | 517,224(0.01%)#1,058 |
| 26. | Oceanside | 62 | 20,083(0.31%)#26 | 517,224(0.01%)#1,136 |
| 27. | Westfield | 62 | 20,083(0.31%)#27 | 517,224(0.01%)#1,144 |
| 28. | Albany | 61 | 20,083(0.30%)#28 | 517,224(0.01%)#1,149 |
| 29. | Titusville | 57 | 20,083(0.28%)#29 | 517,224(0.01%)#1,211 |
| 30. | Vails Gate | 55 | 20,083(0.27%)#30 | 517,224(0.01%)#1,235 |
| 31. | Endicott | 54 | 20,083(0.27%)#31 | 517,224(0.01%)#1,246 |
| 32. | Noyack | 52 | 20,083(0.26%)#32 | 517,224(0.01%)#1,280 |
| 33. | East Glenville | 50 | 20,083(0.25%)#33 | 517,224(0.01%)#1,295 |
| 34. | Walden | 50 | 20,083(0.25%)#34 | 517,224(0.01%)#1,298 |
| 35. | Buffalo | 45 | 20,083(0.22%)#35 | 517,224(0.01%)#1,366 |
| 36. | Brewerton | 43 | 20,083(0.21%)#36 | 517,224(0.01%)#1,417 |
| 37. | Mamaroneck | 37 | 20,083(0.18%)#37 | 517,224(0.01%)#1,528 |
| 38. | Hampton Bays | 37 | 20,083(0.18%)#38 | 517,224(0.01%)#1,530 |
| 39. | Elmsford | 37 | 20,083(0.18%)#39 | 517,224(0.01%)#1,538 |
| 40. | New City | 34 | 20,083(0.17%)#40 | 517,224(0.01%)#1,599 |
| 41. | Beacon | 34 | 20,083(0.17%)#41 | 517,224(0.01%)#1,607 |
| 42. | Lakeview | 32 | 20,083(0.16%)#42 | 517,224(0.01%)#1,646 |
| 43. | Troy | 31 | 20,083(0.15%)#43 | 517,224(0.01%)#1,659 |
| 44. | Lake Ronkonkoma | 31 | 20,083(0.15%)#44 | 517,224(0.01%)#1,663 |
| 45. | Kings Park | 30 | 20,083(0.15%)#45 | 517,224(0.01%)#1,694 |
| 46. | West Babylon | 23 | 20,083(0.11%)#46 | 517,224(0.00%)#1,882 |
| 47. | Rocky Point | 23 | 20,083(0.11%)#47 | 517,224(0.00%)#1,891 |
| 48. | Jeffersonville | 23 | 20,083(0.11%)#48 | 517,224(0.00%)#1,912 |
| 49. | Walton Park | 22 | 20,083(0.11%)#49 | 517,224(0.00%)#1,936 |
| 50. | Castleton On Hudson | 20 | 20,083(0.10%)#50 | 517,224(0.00%)#2,005 |
| 51. | Chadwicks | 20 | 20,083(0.10%)#51 | 517,224(0.00%)#2,009 |
| 52. | Thomaston | 19 | 20,083(0.09%)#52 | 517,224(0.00%)#2,045 |
| 53. | Lake George | 19 | 20,083(0.09%)#53 | 517,224(0.00%)#2,051 |
| 54. | Mount Vernon | 18 | 20,083(0.09%)#54 | 517,224(0.00%)#2,060 |
| 55. | Dunkirk | 18 | 20,083(0.09%)#55 | 517,224(0.00%)#2,077 |
| 56. | Carmel | 18 | 20,083(0.09%)#56 | 517,224(0.00%)#2,088 |
| 57. | Hempstead | 16 | 20,083(0.08%)#57 | 517,224(0.00%)#2,151 |
| 58. | Massapequa | 16 | 20,083(0.08%)#58 | 517,224(0.00%)#2,160 |
| 59. | Glen Cove | 15 | 20,083(0.07%)#59 | 517,224(0.00%)#2,196 |
| 60. | East Hampton North | 15 | 20,083(0.07%)#60 | 517,224(0.00%)#2,218 |
| 61. | Thiells | 14 | 20,083(0.07%)#61 | 517,224(0.00%)#2,261 |
| 62. | Ossining | 13 | 20,083(0.06%)#62 | 517,224(0.00%)#2,297 |
| 63. | Franklin Square | 12 | 20,083(0.06%)#63 | 517,224(0.00%)#2,349 |
| 64. | Hillburn | 10 | 20,083(0.05%)#64 | 517,224(0.00%)#2,529 |
| 65. | Fleischmanns | 10 | 20,083(0.05%)#65 | 517,224(0.00%)#2,534 |
| 66. | Centereach | 9 | 20,083(0.04%)#66 | 517,224(0.00%)#2,553 |
| 67. | Southampton | 9 | 20,083(0.04%)#67 | 517,224(0.00%)#2,582 |
| 68. | Valley Stream | 8 | 20,083(0.04%)#68 | 517,224(0.00%)#2,622 |
| 69. | Eggertsville | 8 | 20,083(0.04%)#69 | 517,224(0.00%)#2,637 |
| 70. | Mastic | 8 | 20,083(0.04%)#70 | 517,224(0.00%)#2,638 |
| 71. | Wheatley Heights | 8 | 20,083(0.04%)#71 | 517,224(0.00%)#2,658 |
| 72. | Spring Valley | 7 | 20,083(0.03%)#72 | 517,224(0.00%)#2,693 |
| 73. | Mount Sinai | 7 | 20,083(0.03%)#73 | 517,224(0.00%)#2,710 |
| 74. | Sackets Harbor | 7 | 20,083(0.03%)#74 | 517,224(0.00%)#2,747 |
| 75. | Chaumont | 6 | 20,083(0.03%)#75 | 517,224(0.00%)#2,846 |
| 76. | Fort Drum | 4 | 20,083(0.02%)#76 | 517,224(0.00%)#2,933 |
| 77. | Lloyd Harbor | 3 | 20,083(0.01%)#77 | 517,224(0.00%)#3,011 |
| 78. | Madrid | 3 | 20,083(0.01%)#78 | 517,224(0.00%)#3,038 |
| 79. | Interlaken | 2 | 20,083(0.01%)#79 | 517,224(0.00%)#3,133 |
| 80. | Floral Park | 1 | 20,083(0.00%)#80 | 517,224(0.00%)#3,161 |
Common Questions
What are the Top 10 Cities with the Largest Mexican American Indian Community in New York?
Top 10 Cities with the Largest Mexican American Indian Community in New York are:
#1
13,850
#2
505
#3
447
#4
269
#5
260
#6
213
#7
207
#8
187
#9
167
#10
166
What city has the Largest Mexican American Indian Community in New York?
New York has the Largest Mexican American Indian Community in New York with 13,850.
What is the Total Mexican American Indian Population in the State of New York?
Total Mexican American Indian Population in New York is 20,083.
What is the Total Mexican American Indian Population in the United States?
Total Mexican American Indian Population in the United States is 517,224.