Cities with the Largest Guamanian / Chamorro Community in New York
RELATED REPORTS & OPTIONS
Guamanian / Chamorro
New York
Compare Cities
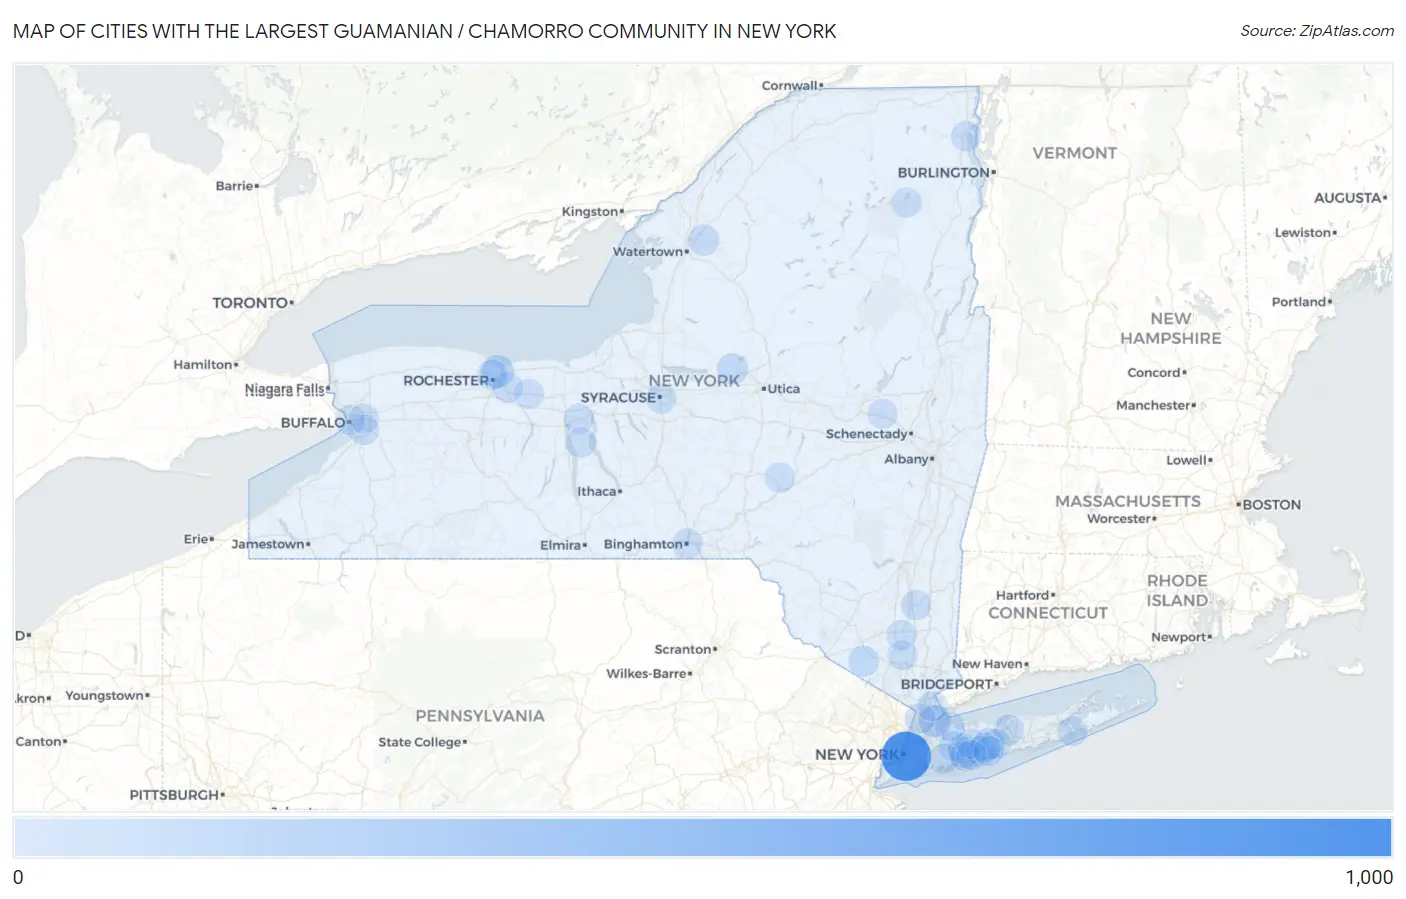
Map of Cities with the Largest Guamanian / Chamorro Community in New York
0
1,000
Cities with the Largest Guamanian / Chamorro Community in New York
| City | Guamanian / Chamorro | vs State | vs National | |
| 1. | New York | 967 | 2,128(45.44%)#1 | 154,057(0.63%)#13 |
| 2. | Irondequoit | 110 | 2,128(5.17%)#2 | 154,057(0.07%)#289 |
| 3. | Mamaroneck | 93 | 2,128(4.37%)#3 | 154,057(0.06%)#353 |
| 4. | Brentwood | 71 | 2,128(3.34%)#4 | 154,057(0.05%)#446 |
| 5. | Rome | 50 | 2,128(2.35%)#5 | 154,057(0.03%)#591 |
| 6. | Florida | 47 | 2,128(2.21%)#6 | 154,057(0.03%)#618 |
| 7. | Fort Drum | 44 | 2,128(2.07%)#7 | 154,057(0.03%)#640 |
| 8. | Plainedge | 44 | 2,128(2.07%)#8 | 154,057(0.03%)#641 |
| 9. | Centereach | 30 | 2,128(1.41%)#9 | 154,057(0.02%)#806 |
| 10. | East Rochester | 28 | 2,128(1.32%)#10 | 154,057(0.02%)#852 |
| 11. | Rochester | 26 | 2,128(1.22%)#11 | 154,057(0.02%)#877 |
| 12. | Binghamton | 24 | 2,128(1.13%)#12 | 154,057(0.02%)#915 |
| 13. | Yonkers | 23 | 2,128(1.08%)#13 | 154,057(0.01%)#930 |
| 14. | Plattsburgh | 22 | 2,128(1.03%)#14 | 154,057(0.01%)#966 |
| 15. | Arlington | 18 | 2,128(0.85%)#15 | 154,057(0.01%)#1,070 |
| 16. | New Cassel | 17 | 2,128(0.80%)#16 | 154,057(0.01%)#1,090 |
| 17. | White Plains | 16 | 2,128(0.75%)#17 | 154,057(0.01%)#1,106 |
| 18. | Waterloo | 15 | 2,128(0.70%)#18 | 154,057(0.01%)#1,156 |
| 19. | Bethpage | 14 | 2,128(0.66%)#19 | 154,057(0.01%)#1,177 |
| 20. | West Seneca | 13 | 2,128(0.61%)#20 | 154,057(0.01%)#1,195 |
| 21. | Lakeview | 13 | 2,128(0.61%)#21 | 154,057(0.01%)#1,217 |
| 22. | Melville | 12 | 2,128(0.56%)#22 | 154,057(0.01%)#1,250 |
| 23. | North Babylon | 12 | 2,128(0.56%)#23 | 154,057(0.01%)#1,252 |
| 24. | North Massapequa | 12 | 2,128(0.56%)#24 | 154,057(0.01%)#1,253 |
| 25. | Newburgh | 11 | 2,128(0.52%)#25 | 154,057(0.01%)#1,288 |
| 26. | Lattingtown | 11 | 2,128(0.52%)#26 | 154,057(0.01%)#1,314 |
| 27. | Laurens | 10 | 2,128(0.47%)#27 | 154,057(0.01%)#1,368 |
| 28. | Central Islip | 9 | 2,128(0.42%)#28 | 154,057(0.01%)#1,381 |
| 29. | Baywood | 9 | 2,128(0.42%)#29 | 154,057(0.01%)#1,398 |
| 30. | Romulus | 9 | 2,128(0.42%)#30 | 154,057(0.01%)#1,416 |
| 31. | Lake Placid | 8 | 2,128(0.38%)#31 | 154,057(0.01%)#1,460 |
| 32. | North Amityville | 7 | 2,128(0.33%)#32 | 154,057(0.00%)#1,484 |
| 33. | West Point | 7 | 2,128(0.33%)#33 | 154,057(0.00%)#1,499 |
| 34. | Bay Shore | 6 | 2,128(0.28%)#34 | 154,057(0.00%)#1,539 |
| 35. | Amsterdam | 6 | 2,128(0.28%)#35 | 154,057(0.00%)#1,542 |
| 36. | Macedon | 6 | 2,128(0.28%)#36 | 154,057(0.00%)#1,561 |
| 37. | Syracuse | 5 | 2,128(0.23%)#37 | 154,057(0.00%)#1,568 |
| 38. | Buffalo | 4 | 2,128(0.19%)#38 | 154,057(0.00%)#1,622 |
| 39. | Cheektowaga | 4 | 2,128(0.19%)#39 | 154,057(0.00%)#1,625 |
| 40. | Hampton Bays | 4 | 2,128(0.19%)#40 | 154,057(0.00%)#1,642 |
1
2Common Questions
What are the Top 10 Cities with the Largest Guamanian / Chamorro Community in New York?
Top 10 Cities with the Largest Guamanian / Chamorro Community in New York are:
#1
967
#2
110
#3
93
#4
71
#5
50
#6
47
#7
44
#8
44
#9
30
#10
28
What city has the Largest Guamanian / Chamorro Community in New York?
New York has the Largest Guamanian / Chamorro Community in New York with 967.
What is the Total Guamanian / Chamorro Population in the State of New York?
Total Guamanian / Chamorro Population in New York is 2,128.
What is the Total Guamanian / Chamorro Population in the United States?
Total Guamanian / Chamorro Population in the United States is 154,057.