Cities with the Largest Central American Indian Community in the United States
RELATED REPORTS & OPTIONS
Central American Indian
United States
Compare Cities
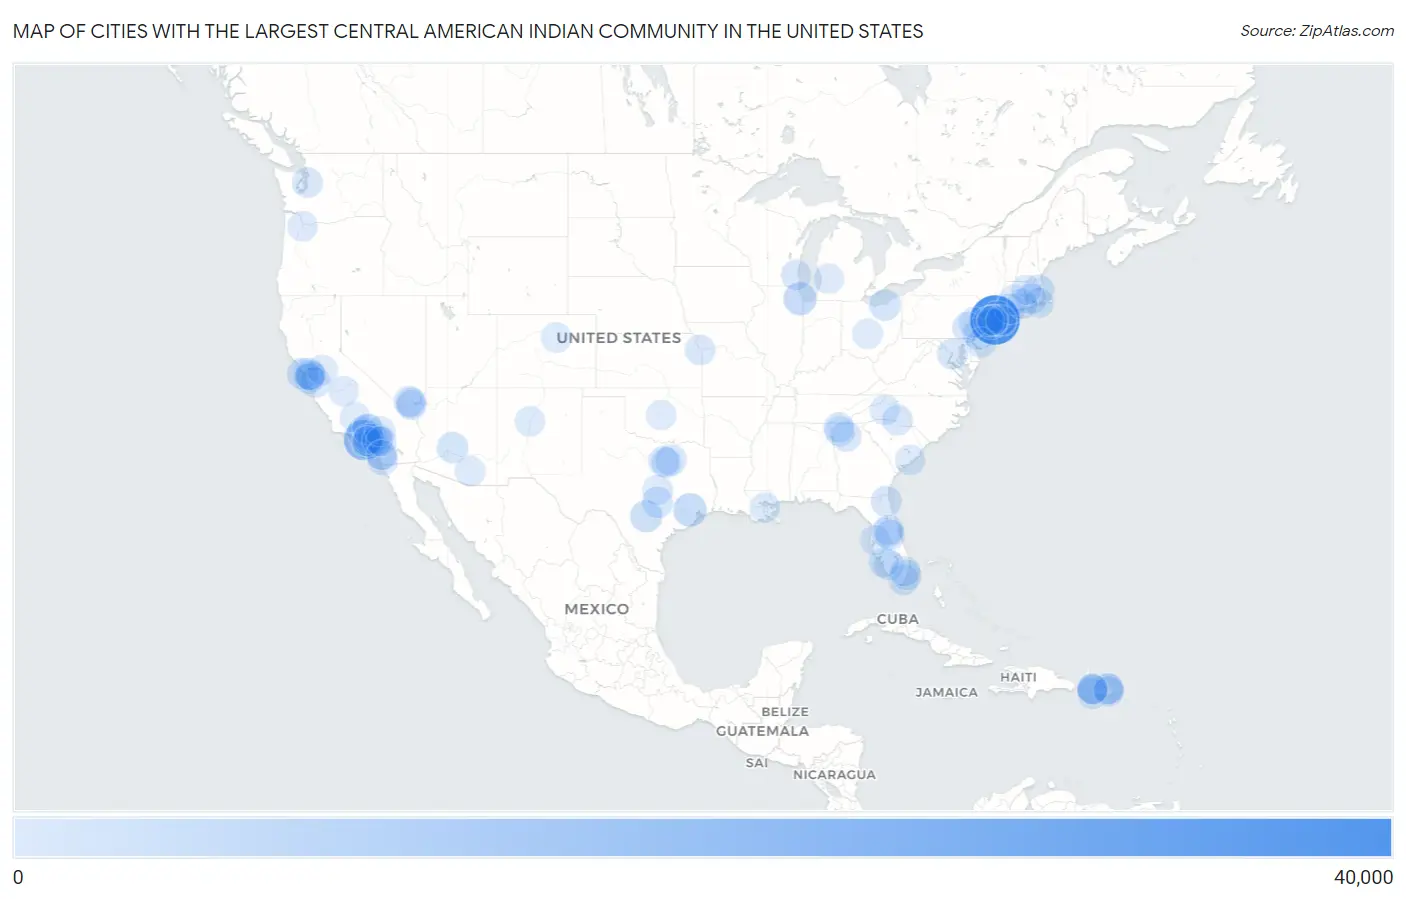
Map of Cities with the Largest Central American Indian Community in the United States
0
40,000
Cities with the Largest Central American Indian Community in the United States
| City | Central American Indian | vs State | vs National | |
| 1. | New York | 31,169 | 47,223(66.00%)#1 | 374,148(8.33%)#1 |
| 2. | Los Angeles | 15,400 | 78,655(19.58%)#1 | 374,148(4.12%)#2 |
| 3. | Houston | 5,012 | 35,710(14.04%)#1 | 374,148(1.34%)#3 |
| 4. | Chicago | 4,704 | 11,725(40.12%)#1 | 374,148(1.26%)#4 |
| 5. | San Antonio | 3,459 | 35,710(9.69%)#2 | 374,148(0.92%)#5 |
| 6. | Philadelphia | 2,528 | 11,574(21.84%)#1 | 374,148(0.68%)#6 |
| 7. | Cleveland | 2,239 | 6,345(35.29%)#1 | 374,148(0.60%)#7 |
| 8. | Oakland | 2,195 | 78,655(2.79%)#2 | 374,148(0.59%)#8 |
| 9. | Phoenix | 2,169 | 7,217(30.05%)#1 | 374,148(0.58%)#9 |
| 10. | Austin | 2,110 | 35,710(5.91%)#3 | 374,148(0.56%)#10 |
| 11. | San Francisco | 1,918 | 78,655(2.44%)#3 | 374,148(0.51%)#11 |
| 12. | San Juan | 1,830 | 44,444(4.12%)#1 | 374,148(0.49%)#12 |
| 13. | Anasco | 1,435 | 44,444(3.23%)#2 | 374,148(0.38%)#13 |
| 14. | Washington | 1,358 | 1,358(100.00%)#1 | 374,148(0.36%)#14 |
| 15. | Dallas | 1,306 | 35,710(3.66%)#4 | 374,148(0.35%)#15 |
| 16. | Jacksonville | 1,276 | 33,346(3.83%)#1 | 374,148(0.34%)#16 |
| 17. | Boston | 1,255 | 8,352(15.03%)#1 | 374,148(0.34%)#17 |
| 18. | Homestead | 1,208 | 33,346(3.62%)#2 | 374,148(0.32%)#18 |
| 19. | Long Beach | 1,174 | 78,655(1.49%)#4 | 374,148(0.31%)#19 |
| 20. | Immokalee | 1,159 | 33,346(3.48%)#3 | 374,148(0.31%)#20 |
| 21. | Anaheim | 1,155 | 78,655(1.47%)#5 | 374,148(0.31%)#21 |
| 22. | San Diego | 1,153 | 78,655(1.47%)#6 | 374,148(0.31%)#22 |
| 23. | Reading | 1,150 | 11,574(9.94%)#2 | 374,148(0.31%)#23 |
| 24. | Providence | 1,147 | 2,811(40.80%)#1 | 374,148(0.31%)#24 |
| 25. | San Jose | 1,073 | 78,655(1.36%)#7 | 374,148(0.29%)#25 |
| 26. | Cabo Rojo | 1,073 | 44,444(2.41%)#3 | 374,148(0.29%)#26 |
| 27. | Charlotte | 1,063 | 8,461(12.56%)#1 | 374,148(0.28%)#27 |
| 28. | Allentown | 999 | 11,574(8.63%)#3 | 374,148(0.27%)#28 |
| 29. | Yonkers | 978 | 47,223(2.07%)#2 | 374,148(0.26%)#29 |
| 30. | Fort Worth | 961 | 35,710(2.69%)#5 | 374,148(0.26%)#30 |
| 31. | Canton | 955 | 14,624(6.53%)#1 | 374,148(0.26%)#31 |
| 32. | Jersey City | 918 | 16,510(5.56%)#1 | 374,148(0.25%)#32 |
| 33. | Seattle | 909 | 6,112(14.87%)#1 | 374,148(0.24%)#33 |
| 34. | Milwaukee | 909 | 2,521(36.06%)#1 | 374,148(0.24%)#34 |
| 35. | Horizon West | 909 | 33,346(2.73%)#4 | 374,148(0.24%)#35 |
| 36. | Palmdale | 903 | 78,655(1.15%)#8 | 374,148(0.24%)#36 |
| 37. | Santa Clarita | 879 | 78,655(1.12%)#9 | 374,148(0.23%)#37 |
| 38. | Aguada | 878 | 44,444(1.98%)#4 | 374,148(0.23%)#38 |
| 39. | Las Vegas | 872 | 4,010(21.75%)#1 | 374,148(0.23%)#39 |
| 40. | Miami | 869 | 33,346(2.61%)#5 | 374,148(0.23%)#40 |
| 41. | Redwood City | 795 | 78,655(1.01%)#10 | 374,148(0.21%)#41 |
| 42. | Kansas City | 784 | 2,498(31.39%)#1 | 374,148(0.21%)#42 |
| 43. | Luyando | 775 | 44,444(1.74%)#5 | 374,148(0.21%)#43 |
| 44. | Perth Amboy | 763 | 16,510(4.62%)#2 | 374,148(0.20%)#44 |
| 45. | Pomona | 726 | 78,655(0.92%)#11 | 374,148(0.19%)#45 |
| 46. | Pembroke Pines | 725 | 33,346(2.17%)#6 | 374,148(0.19%)#46 |
| 47. | Portland | 722 | 3,726(19.38%)#1 | 374,148(0.19%)#47 |
| 48. | Fontana | 707 | 78,655(0.90%)#12 | 374,148(0.19%)#48 |
| 49. | Pine Hills | 706 | 33,346(2.12%)#7 | 374,148(0.19%)#49 |
| 50. | Hayward | 704 | 78,655(0.90%)#13 | 374,148(0.19%)#50 |
| 51. | Roosevelt | 704 | 47,223(1.49%)#3 | 374,148(0.19%)#51 |
| 52. | Stockton | 701 | 78,655(0.89%)#14 | 374,148(0.19%)#52 |
| 53. | South Gate | 682 | 78,655(0.87%)#15 | 374,148(0.18%)#53 |
| 54. | Bakersfield | 677 | 78,655(0.86%)#16 | 374,148(0.18%)#54 |
| 55. | Columbus | 676 | 6,345(10.65%)#2 | 374,148(0.18%)#55 |
| 56. | Tucson | 676 | 7,217(9.37%)#2 | 374,148(0.18%)#56 |
| 57. | Lancaster | 668 | 78,655(0.85%)#17 | 374,148(0.18%)#57 |
| 58. | Arlington | 659 | 35,710(1.85%)#6 | 374,148(0.18%)#58 |
| 59. | Hartford | 654 | 6,645(9.84%)#1 | 374,148(0.17%)#59 |
| 60. | New Bedford | 648 | 8,352(7.76%)#2 | 374,148(0.17%)#60 |
| 61. | New Haven | 640 | 6,645(9.63%)#2 | 374,148(0.17%)#61 |
| 62. | Denver | 639 | 5,074(12.59%)#1 | 374,148(0.17%)#62 |
| 63. | Sunrise Manor | 637 | 4,010(15.89%)#2 | 374,148(0.17%)#63 |
| 64. | Las Marías | 625 | 44,444(1.41%)#6 | 374,148(0.17%)#64 |
| 65. | Escondido | 624 | 78,655(0.79%)#18 | 374,148(0.17%)#65 |
| 66. | Charleston | 624 | 2,899(21.52%)#1 | 374,148(0.17%)#66 |
| 67. | Elizabeth | 615 | 16,510(3.73%)#3 | 374,148(0.16%)#67 |
| 68. | Bayamón | 606 | 44,444(1.36%)#7 | 374,148(0.16%)#68 |
| 69. | Norristown Borough | 602 | 11,574(5.20%)#4 | 374,148(0.16%)#69 |
| 70. | El Monte | 597 | 78,655(0.76%)#19 | 374,148(0.16%)#70 |
| 71. | Downey | 582 | 78,655(0.74%)#20 | 374,148(0.16%)#71 |
| 72. | Vineland | 582 | 16,510(3.53%)#4 | 374,148(0.16%)#72 |
| 73. | Metairie | 569 | 2,808(20.26%)#1 | 374,148(0.15%)#73 |
| 74. | Wyoming | 566 | 3,231(17.52%)#1 | 374,148(0.15%)#74 |
| 75. | Uniondale | 566 | 47,223(1.20%)#4 | 374,148(0.15%)#75 |
| 76. | Newark | 559 | 16,510(3.39%)#5 | 374,148(0.15%)#76 |
| 77. | Tampa | 557 | 33,346(1.67%)#8 | 374,148(0.15%)#77 |
| 78. | Henderson | 545 | 4,010(13.59%)#3 | 374,148(0.15%)#78 |
| 79. | Riverside | 534 | 78,655(0.68%)#21 | 374,148(0.14%)#79 |
| 80. | Calhoun | 532 | 14,624(3.64%)#2 | 374,148(0.14%)#80 |
| 81. | Oklahoma City | 527 | 2,493(21.14%)#1 | 374,148(0.14%)#81 |
| 82. | Buenaventura Lakes | 524 | 33,346(1.57%)#9 | 374,148(0.14%)#82 |
| 83. | San Sebastian | 524 | 44,444(1.18%)#8 | 374,148(0.14%)#83 |
| 84. | Norwich | 523 | 6,645(7.87%)#3 | 374,148(0.14%)#84 |
| 85. | Killeen | 522 | 35,710(1.46%)#7 | 374,148(0.14%)#85 |
| 86. | Apple Valley | 522 | 78,655(0.66%)#22 | 374,148(0.14%)#86 |
| 87. | Dalton | 522 | 14,624(3.57%)#3 | 374,148(0.14%)#87 |
| 88. | Fort Myers | 516 | 33,346(1.55%)#10 | 374,148(0.14%)#88 |
| 89. | Worcester | 509 | 8,352(6.09%)#3 | 374,148(0.14%)#89 |
| 90. | San Marcos | 503 | 78,655(0.64%)#23 | 374,148(0.13%)#90 |
| 91. | Moreno Valley | 502 | 78,655(0.64%)#24 | 374,148(0.13%)#91 |
| 92. | Fresno | 501 | 78,655(0.64%)#25 | 374,148(0.13%)#92 |
| 93. | San Leandro | 497 | 78,655(0.63%)#26 | 374,148(0.13%)#93 |
| 94. | Rincon | 497 | 44,444(1.12%)#9 | 374,148(0.13%)#94 |
| 95. | Albuquerque | 496 | 2,097(23.65%)#1 | 374,148(0.13%)#95 |
| 96. | Carolina | 494 | 44,444(1.11%)#10 | 374,148(0.13%)#96 |
| 97. | Plainfield | 493 | 16,510(2.99%)#6 | 374,148(0.13%)#97 |
| 98. | Caguas | 491 | 44,444(1.10%)#11 | 374,148(0.13%)#98 |
| 99. | Morganton | 486 | 8,461(5.74%)#2 | 374,148(0.13%)#99 |
| 100. | La Playa | 486 | 44,444(1.09%)#12 | 374,148(0.13%)#100 |
Common Questions
What are the Top 10 Cities with the Largest Central American Indian Community in the United States?
Top 10 Cities with the Largest Central American Indian Community in the United States are:
What city has the Largest Central American Indian Community in the United States?
New York has the Largest Central American Indian Community in the United States with 31,169.
What is the Total Central American Indian Population in the United States?
Total Central American Indian Population in the United States is 374,148.