Cities with the Largest Central American Indian Community in Massachusetts

RELATED REPORTS & OPTIONS

Central American Indian
Population
Families and Households
Female Fertility
Female Fertility (Unmarried)
Race (Community Size)
Race (Percentage)
Ancestry (Community Size)
AfghanAfricanAlaska NativeAlaskan AthabascanAlbanianAleutAlsatianAmericanApacheArabArapahoArgentineanArmenianAssyrian / Chaldean / SyriacAustralianAustrianBahamianBangladeshiBarbadianBasqueBelgianBelizeanBermudanBhutaneseBlackfeetBolivianBrazilianBritishBritish West IndianBulgarianBurmeseCajunCambodianCanadianCape VerdeanCarpatho RusynCelticCentral AmericanCentral American IndianCherokeeCheyenneChickasawChileanChineseChippewaChoctawColombianColvilleComancheCosta RicanCreeCreekCroatianCrowCubanCypriotCzechCzechoslovakianDanishDelawareDominicanDutchDutch West IndianEastern EuropeanEcuadorianEgyptianEnglishEstonianEthiopianEuropeanFijianFilipinoFinnishFrenchFrench American IndianFrench CanadianGermanGerman RussianGhanaianGreekGuamanian / ChamorroGuatemalanGuyaneseHaitianHmongHonduranHopiHoumaHungarianIcelanderIndian (Asian)IndonesianInupiatIranianIraqiIrishIroquoisIsraeliItalianJamaicanJapaneseJordanianKenyanKiowaKoreanLaotianLatvianLebaneseLiberianLithuanianLumbeeLuxembourgerMacedonianMalaysianMalteseMarshalleseMenomineeMexicanMexican American IndianMongolianMoroccanNative HawaiianNavajoNepaleseNew ZealanderNicaraguanNigerianNorthern EuropeanNorwegianOkinawanOsageOttawaPaiutePakistaniPalestinianPanamanianParaguayanPennsylvania GermanPeruvianPimaPolishPortuguesePotawatomiPuebloPuerto RicanPuget Sound SalishRomanianRussianSalvadoranSamoanScandinavianScotch-IrishScottishSeminoleSenegaleseSerbianShoshoneSierra LeoneanSiouxSlavicSlovakSloveneSomaliSouth AfricanSouth AmericanSouth American IndianSoviet UnionSpaniardSpanishSpanish AmericanSpanish American IndianSri LankanSubsaharan AfricanSudaneseSwedishSwissSyrianTaiwaneseThaiTlingit-HaidaTohono O'OdhamTonganTrinidadian and TobagonianTsimshianTurkishU.S. Virgin IslanderUgandanUkrainianUruguayanUteVenezuelanVietnameseWelshWest IndianYakamaYaquiYugoslavianYumanYup'ikZimbabwean
Ancestry (Percentage)
AfghanAfricanAlaska NativeAlaskan AthabascanAlbanianAleutAlsatianAmericanApacheArabArapahoArgentineanArmenianAssyrian / Chaldean / SyriacAustralianAustrianBahamianBangladeshiBarbadianBasqueBelgianBelizeanBermudanBhutaneseBlackfeetBolivianBrazilianBritishBritish West IndianBulgarianBurmeseCajunCambodianCanadianCape VerdeanCarpatho RusynCelticCentral AmericanCentral American IndianCherokeeCheyenneChickasawChileanChineseChippewaChoctawColombianColvilleComancheCosta RicanCreeCreekCroatianCrowCubanCypriotCzechCzechoslovakianDanishDelawareDominicanDutchDutch West IndianEastern EuropeanEcuadorianEgyptianEnglishEstonianEthiopianEuropeanFijianFilipinoFinnishFrenchFrench American IndianFrench CanadianGermanGerman RussianGhanaianGreekGuamanian / ChamorroGuatemalanGuyaneseHaitianHmongHonduranHopiHoumaHungarianIcelanderIndian (Asian)IndonesianInupiatIranianIraqiIrishIroquoisIsraeliItalianJamaicanJapaneseJordanianKenyanKiowaKoreanLaotianLatvianLebaneseLiberianLithuanianLumbeeLuxembourgerMacedonianMalaysianMalteseMarshalleseMenomineeMexicanMexican American IndianMongolianMoroccanNative HawaiianNavajoNepaleseNew ZealanderNicaraguanNigerianNorthern EuropeanNorwegianOkinawanOsageOttawaPaiutePakistaniPalestinianPanamanianParaguayanPennsylvania GermanPeruvianPimaPolishPortuguesePotawatomiPuebloPuerto RicanPuget Sound SalishRomanianRussianSalvadoranSamoanScandinavianScotch-IrishScottishSeminoleSenegaleseSerbianShoshoneSierra LeoneanSiouxSlavicSlovakSloveneSomaliSouth AfricanSouth AmericanSouth American IndianSoviet UnionSpaniardSpanishSpanish AmericanSpanish American IndianSri LankanSubsaharan AfricanSudaneseSwedishSwissSyrianTaiwaneseThaiTlingit-HaidaTohono O'OdhamTonganTrinidadian and TobagonianTsimshianTurkishU.S. Virgin IslanderUgandanUkrainianUruguayanUteVenezuelanVietnameseWelshWest IndianYakamaYaquiYugoslavianYumanYup'ikZimbabwean
Immigrant Origin (Total)
AfghanistanAfricaAlbaniaArgentinaArmeniaAsiaAustraliaAustriaAzoresBahamasBangladeshBarbadosBelarusBelgiumBelizeBoliviaBosnia and HerzegovinaBrazilBulgariaBurma / MyanmarCabo VerdeCambodiaCameroonCanadaCaribbeanCentral AmericaChileChinaColombiaCongoCosta RicaCroatiaCubaCzechoslovakiaDenmarkDominicaDominican RepublicEastern AfricaEastern AsiaEastern EuropeEcuadorEgyptEl SalvadorEnglandEritreaEthiopiaEuropeFijiFranceGermanyGhanaGreeceGrenadaGuatemalaGuyanaHaitiHondurasHong KongHungaryIndiaIndonesiaIranIraqIrelandIsraelItalyJamaicaJapanJordanKazakhstanKenyaKoreaKuwaitLaosLatin AmericaLatviaLebanonLiberiaLithuaniaMalaysiaMexicoMicronesiaMiddle AfricaMoldovaMoroccoNepalNetherlandsNicaraguaNigeriaNorth MacedoniaNorthern AfricaNorthern EuropeNorwayOceaniaPakistanPanamaPeruPhilippinesPolandPortugalRomaniaRussiaSaudi ArabiaScotlandSenegalSerbiaSierra LeoneSingaporeSomaliaSouth AfricaSouth AmericaSouth Central AsiaSouth Eastern AsiaSouthern EuropeSpainSri LankaSt. Vincent and the GrenadinesSudanSwedenSwitzerlandSyriaTaiwanThailandTrinidad and TobagoTurkeyUgandaUkraineUruguayUzbekistanVenezuelaVietnamWest IndiesWestern AfricaWestern AsiaWestern EuropeYemenZaireZimbabwe
Immigrant Origin (Percentage)
AfghanistanAfricaAlbaniaArgentinaArmeniaAsiaAustraliaAustriaAzoresBahamasBangladeshBarbadosBelarusBelgiumBelizeBoliviaBosnia and HerzegovinaBrazilBulgariaBurma / MyanmarCabo VerdeCambodiaCameroonCanadaCaribbeanCentral AmericaChileChinaColombiaCongoCosta RicaCroatiaCubaCzechoslovakiaDenmarkDominicaDominican RepublicEastern AfricaEastern AsiaEastern EuropeEcuadorEgyptEl SalvadorEnglandEritreaEthiopiaEuropeFijiFranceGermanyGhanaGreeceGrenadaGuatemalaGuyanaHaitiHondurasHong KongHungaryIndiaIndonesiaIranIraqIrelandIsraelItalyJamaicaJapanJordanKazakhstanKenyaKoreaKuwaitLaosLatin AmericaLatviaLebanonLiberiaLithuaniaMalaysiaMexicoMicronesiaMiddle AfricaMoldovaMoroccoNepalNetherlandsNicaraguaNigeriaNorth MacedoniaNorthern AfricaNorthern EuropeNorwayOceaniaPakistanPanamaPeruPhilippinesPolandPortugalRomaniaRussiaSaudi ArabiaScotlandSenegalSerbiaSierra LeoneSingaporeSomaliaSouth AfricaSouth AmericaSouth Central AsiaSouth Eastern AsiaSouthern EuropeSpainSri LankaSt. Vincent and the GrenadinesSudanSwedenSwitzerlandSyriaTaiwanThailandTrinidad and TobagoTurkeyUgandaUkraineUruguayUzbekistanVenezuelaVietnamWest IndiesWestern AfricaWestern AsiaWestern EuropeYemenZaireZimbabwe
Income
Income (Families)
Income (Households)
Poverty
Poverty (Families)
Unemployment
Employment Occupations
Employment Industries
Employer Class
Commute Time
Commute Means
School Enrollment
Education by Degree Field
Occupancy
Finances
Physical Characteristics
Massachusetts
Compare Cities
Comparison Subject

Map of Cities with the Largest Central American Indian Community in Massachusetts

0
1,500
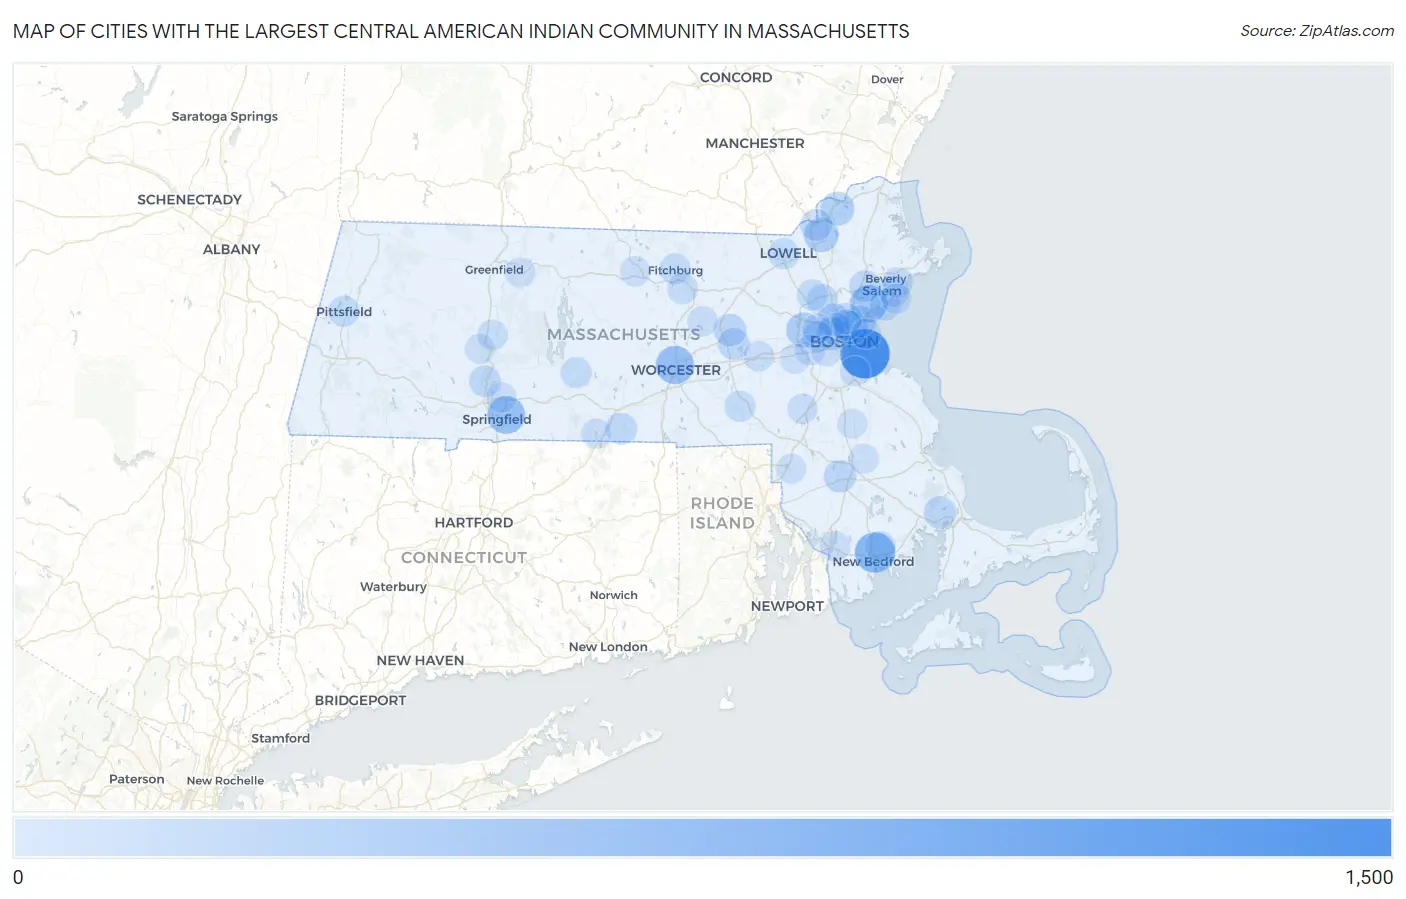
Cities with the Largest Central American Indian Community in Massachusetts Map

Cities with the Largest Central American Indian Community in Massachusetts

City Central American Indian vs State vs National
1. Boston 1,255 8,352 (15.03%)#1 374,148 (0.34%)#17
2. New Bedford 648 8,352 (7.76%)#2 374,148 (0.17%)#60
3. Worcester 509 8,352 (6.09%)#3 374,148 (0.14%)#89
4. Springfield 482 8,352 (5.77%)#4 374,148 (0.13%)#102
5. Lynn 461 8,352 (5.52%)#5 374,148 (0.12%)#112
6. Waltham 303 8,352 (3.63%)#6 374,148 (0.08%)#216
7. Lawrence 276 8,352 (3.30%)#7 374,148 (0.07%)#247
8. Haverhill 231 8,352 (2.77%)#8 374,148 (0.06%)#311
9. Chelsea 217 8,352 (2.60%)#9 374,148 (0.06%)#336
10. Cambridge 170 8,352 (2.04%)#10 374,148 (0.05%)#428
11. Medford 160 8,352 (1.92%)#11 374,148 (0.04%)#462
12. White Island Shores 151 8,352 (1.81%)#12 374,148 (0.04%)#486
13. Taunton 149 8,352 (1.78%)#13 374,148 (0.04%)#490
14. Hudson 143 8,352 (1.71%)#14 374,148 (0.04%)#508
15. Somerville 130 8,352 (1.56%)#15 374,148 (0.03%)#555
16. Methuen Town 118 8,352 (1.41%)#16 374,148 (0.03%)#611
17. Peabody 110 8,352 (1.32%)#17 374,148 (0.03%)#650
18. Southbridge Town 103 8,352 (1.23%)#18 374,148 (0.03%)#695
19. Marlborough 99 8,352 (1.19%)#19 374,148 (0.03%)#713
20. Revere 98 8,352 (1.17%)#20 374,148 (0.03%)#719
21. Holyoke 97 8,352 (1.16%)#21 374,148 (0.03%)#729
22. Malden 92 8,352 (1.10%)#22 374,148 (0.02%)#753
23. Everett 85 8,352 (1.02%)#23 374,148 (0.02%)#797
24. Woburn 78 8,352 (0.93%)#24 374,148 (0.02%)#848
25. Ware 75 8,352 (0.90%)#25 374,148 (0.02%)#873
26. Amherst 73 8,352 (0.87%)#26 374,148 (0.02%)#886
27. Burlington 71 8,352 (0.85%)#27 374,148 (0.02%)#893
28. Swampscott 67 8,352 (0.80%)#28 374,148 (0.02%)#933
29. Lowell 63 8,352 (0.75%)#29 374,148 (0.02%)#975
30. Fitchburg 63 8,352 (0.75%)#30 374,148 (0.02%)#977
31. Watertown Town 63 8,352 (0.75%)#31 374,148 (0.02%)#978
32. Salem 61 8,352 (0.73%)#32 374,148 (0.02%)#1,002
33. Pittsfield 61 8,352 (0.73%)#33 374,148 (0.02%)#1,003
34. Milford 57 8,352 (0.68%)#34 374,148 (0.02%)#1,058
35. Leominster 44 8,352 (0.53%)#35 374,148 (0.01%)#1,251
36. Beverly 42 8,352 (0.50%)#36 374,148 (0.01%)#1,287
37. Acushnet Center 35 8,352 (0.42%)#37 374,148 (0.01%)#1,441
38. Framingham 33 8,352 (0.40%)#38 374,148 (0.01%)#1,466
39. Gardner 33 8,352 (0.40%)#39 374,148 (0.01%)#1,475
40. Hatfield 29 8,352 (0.35%)#40 374,148 (0.01%)#1,599
41. Newton 26 8,352 (0.31%)#41 374,148 (0.01%)#1,671
42. Chicopee 25 8,352 (0.30%)#42 374,148 (0.01%)#1,700
43. Fall River 24 8,352 (0.29%)#43 374,148 (0.01%)#1,734
44. Winthrop Town 21 8,352 (0.25%)#44 374,148 (0.01%)#1,864
45. Quincy 18 8,352 (0.22%)#45 374,148 (0.00%)#1,963
46. Clinton 18 8,352 (0.22%)#46 374,148 (0.00%)#1,993
47. Holland 17 8,352 (0.20%)#47 374,148 (0.00%)#2,051
48. Marblehead 15 8,352 (0.18%)#48 374,148 (0.00%)#2,124
49. Walpole 15 8,352 (0.18%)#49 374,148 (0.00%)#2,145
50. Bridgewater Town 13 8,352 (0.16%)#50 374,148 (0.00%)#2,237
51. Brookline 12 8,352 (0.14%)#51 374,148 (0.00%)#2,289
52. Greenfield 11 8,352 (0.13%)#52 374,148 (0.00%)#2,375
53. Belmont 9 8,352 (0.11%)#53 374,148 (0.00%)#2,495
54. Wellesley 7 8,352 (0.08%)#54 374,148 (0.00%)#2,613
55. Brockton 6 8,352 (0.07%)#55 374,148 (0.00%)#2,672
56. Northampton 5 8,352 (0.06%)#56 374,148 (0.00%)#2,748
57. Millers Falls 5 8,352 (0.06%)#57 374,148 (0.00%)#2,799
58. Attleboro 3 8,352 (0.04%)#58 374,148 (0.00%)#2,878

Common Questions

What are the Top 10 Cities with the Largest Central American Indian Community in Massachusetts?
Top 10 Cities with the Largest Central American Indian Community in Massachusetts are:
What city has the Largest Central American Indian Community in Massachusetts?
Boston has the Largest Central American Indian Community in Massachusetts with 1,255.
What is the Total Central American Indian Population in the State of Massachusetts?
Total Central American Indian Population in Massachusetts is 8,352.
What is the Total Central American Indian Population in the United States?
Total Central American Indian Population in the United States is 374,148.