Zip Codes with the Highest Percentage of Population with a Degree in Engineering in Issaquah, WA
RELATED REPORTS & OPTIONS
Engineering
Issaquah
Compare Zip Codes
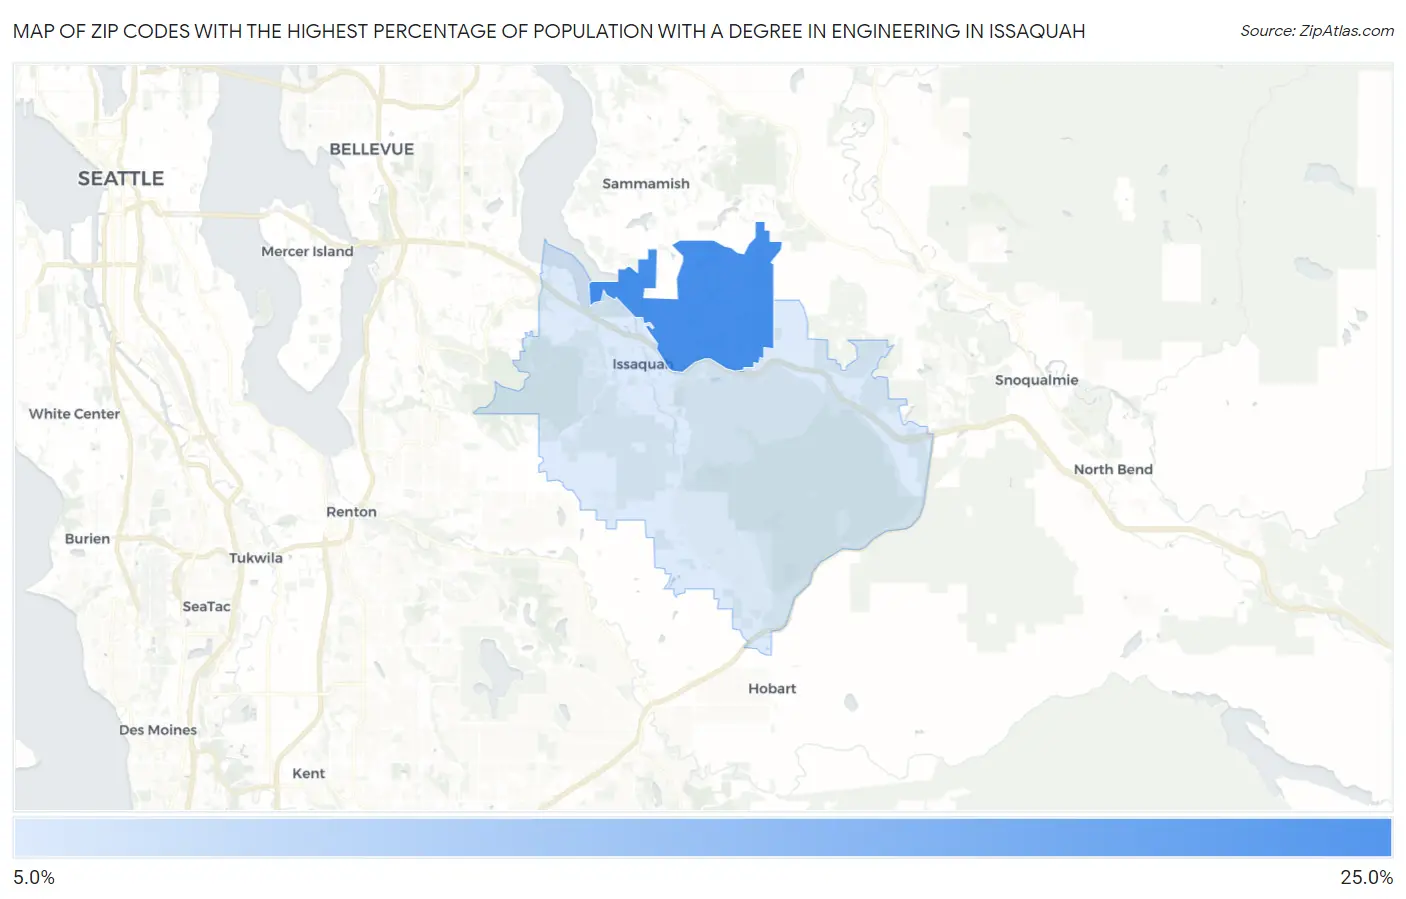
Map of Zip Codes with the Highest Percentage of Population with a Degree in Engineering in Issaquah
14.5%
21.6%
Zip Codes with the Highest Percentage of Population with a Degree in Engineering in Issaquah, WA
| Zip Code | % Graduates | vs State | vs National | |
| 1. | 98029 | 21.6% | 9.8%(+11.7)#19 | 7.6%(+13.9)#752 |
| 2. | 98027 | 14.5% | 9.8%(+4.64)#49 | 7.6%(+6.83)#1,875 |
1
Common Questions
What are the Top Zip Codes with the Highest Percentage of Population with a Degree in Engineering in Issaquah, WA?
Top Zip Codes with the Highest Percentage of Population with a Degree in Engineering in Issaquah, WA are:
What zip code has the Highest Percentage of Population with a Degree in Engineering in Issaquah, WA?
98029 has the Highest Percentage of Population with a Degree in Engineering in Issaquah, WA with 21.6%.
What is the Percentage of Population with a Degree in Engineering in Issaquah, WA?
Percentage of Population with a Degree in Engineering in Issaquah is 18.5%.
What is the Percentage of Population with a Degree in Engineering in Washington?
Percentage of Population with a Degree in Engineering in Washington is 9.8%.
What is the Percentage of Population with a Degree in Engineering in the United States?
Percentage of Population with a Degree in Engineering in the United States is 7.6%.