Bremerton, WA Map & Demographics
Bremerton Map
Bremerton Overview
$39,139
PER CAPITA INCOME
$84,330
AVG FAMILY INCOME
$68,556
AVG HOUSEHOLD INCOME
16.5%
WAGE / INCOME GAP [ % ]
83.5¢/ $1
WAGE / INCOME GAP [ $ ]
$11,620
FAMILY INCOME DEFICIT
0.44
INEQUALITY / GINI INDEX
43,983
TOTAL POPULATION
23,661
MALE POPULATION
20,322
FEMALE POPULATION
116.43
MALES / 100 FEMALES
85.89
FEMALES / 100 MALES
33.5
MEDIAN AGE
2.9
AVG FAMILY SIZE
2.3
AVG HOUSEHOLD SIZE
24,969
LABOR FORCE [ PEOPLE ]
67.2%
PERCENT IN LABOR FORCE
5.5%
UNEMPLOYMENT RATE
Income in Bremerton
Income Overview in Bremerton
Per Capita Income in Bremerton is $39,139, while median incomes of families and households are $84,330 and $68,556 respectively.
| Characteristic | Number | Measure |
| Per Capita Income | 43,983 | $39,139 |
| Median Family Income | 8,961 | $84,330 |
| Mean Family Income | 8,961 | $101,719 |
| Median Household Income | 17,740 | $68,556 |
| Mean Household Income | 17,740 | $88,089 |
| Income Deficit | 8,961 | $11,620 |
| Wage / Income Gap (%) | 43,983 | 16.49% |
| Wage / Income Gap ($) | 43,983 | 83.51¢ per $1 |
| Gini / Inequality Index | 43,983 | 0.44 |
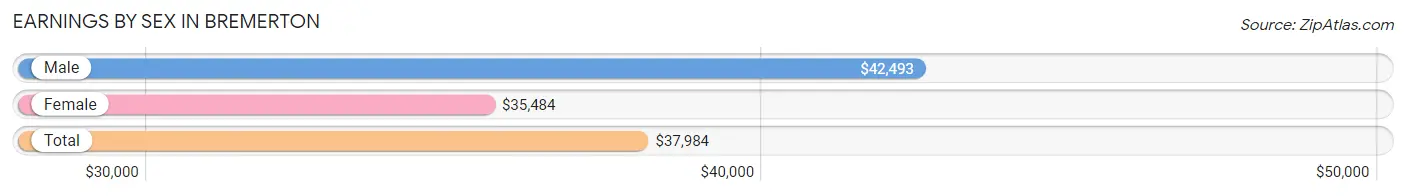
Earnings by Sex in Bremerton
Average Earnings in Bremerton are $37,984, $42,493 for men and $35,484 for women, a difference of 16.5%.
| Sex | Number | Average Earnings |
| Male | 15,472 (60.2%) | $42,493 |
| Female | 10,245 (39.8%) | $35,484 |
| Total | 25,717 (100.0%) | $37,984 |
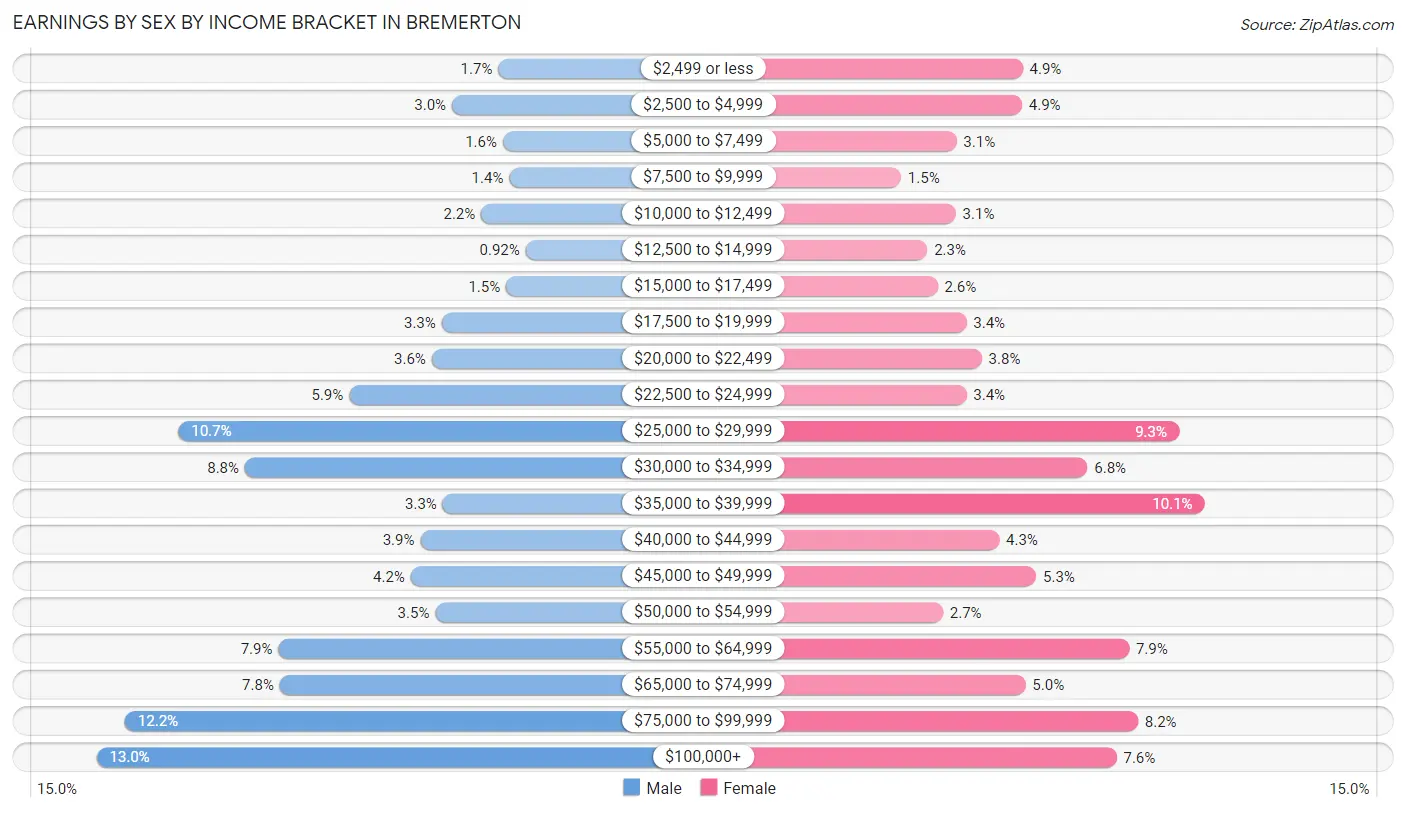
Earnings by Sex by Income Bracket in Bremerton
The most common earnings brackets in Bremerton are $100,000+ for men (2,009 | 13.0%) and $35,000 to $39,999 for women (1,030 | 10.1%).
| Income | Male | Female |
| $2,499 or less | 262 (1.7%) | 506 (4.9%) |
| $2,500 to $4,999 | 462 (3.0%) | 504 (4.9%) |
| $5,000 to $7,499 | 242 (1.6%) | 316 (3.1%) |
| $7,500 to $9,999 | 213 (1.4%) | 156 (1.5%) |
| $10,000 to $12,499 | 335 (2.2%) | 314 (3.1%) |
| $12,500 to $14,999 | 142 (0.9%) | 232 (2.3%) |
| $15,000 to $17,499 | 228 (1.5%) | 261 (2.5%) |
| $17,500 to $19,999 | 507 (3.3%) | 344 (3.4%) |
| $20,000 to $22,499 | 551 (3.6%) | 388 (3.8%) |
| $22,500 to $24,999 | 910 (5.9%) | 344 (3.4%) |
| $25,000 to $29,999 | 1,652 (10.7%) | 956 (9.3%) |
| $30,000 to $34,999 | 1,363 (8.8%) | 693 (6.8%) |
| $35,000 to $39,999 | 503 (3.3%) | 1,030 (10.1%) |
| $40,000 to $44,999 | 600 (3.9%) | 438 (4.3%) |
| $45,000 to $49,999 | 642 (4.2%) | 545 (5.3%) |
| $50,000 to $54,999 | 536 (3.5%) | 277 (2.7%) |
| $55,000 to $64,999 | 1,218 (7.9%) | 812 (7.9%) |
| $65,000 to $74,999 | 1,212 (7.8%) | 514 (5.0%) |
| $75,000 to $99,999 | 1,885 (12.2%) | 838 (8.2%) |
| $100,000+ | 2,009 (13.0%) | 777 (7.6%) |
| Total | 15,472 (100.0%) | 10,245 (100.0%) |
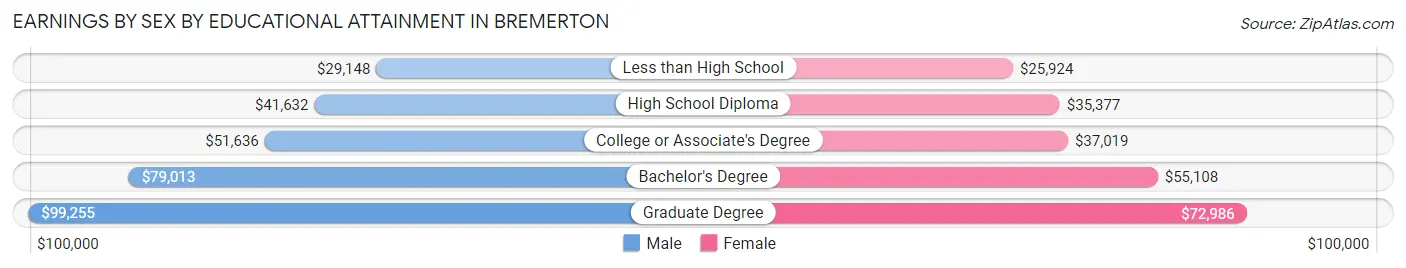
Earnings by Sex by Educational Attainment in Bremerton
Average earnings in Bremerton are $56,396 for men and $39,536 for women, a difference of 29.9%. Men with an educational attainment of graduate degree enjoy the highest average annual earnings of $99,255, while those with less than high school education earn the least with $29,148. Women with an educational attainment of graduate degree earn the most with the average annual earnings of $72,986, while those with less than high school education have the smallest earnings of $25,924.
| Educational Attainment | Male Income | Female Income |
| Less than High School | $29,148 | $25,924 |
| High School Diploma | $41,632 | $35,377 |
| College or Associate's Degree | $51,636 | $37,019 |
| Bachelor's Degree | $79,013 | $55,108 |
| Graduate Degree | $99,255 | $72,986 |
| Total | $56,396 | $39,536 |
Family Income in Bremerton
Family Income Brackets in Bremerton
According to the Bremerton family income data, there are 1,810 families falling into the $100,000 to $149,999 income range, which is the most common income bracket and makes up 20.2% of all families. Conversely, the $10,000 to $14,999 income bracket is the least frequent group with only 188 families (2.1%) belonging to this category.
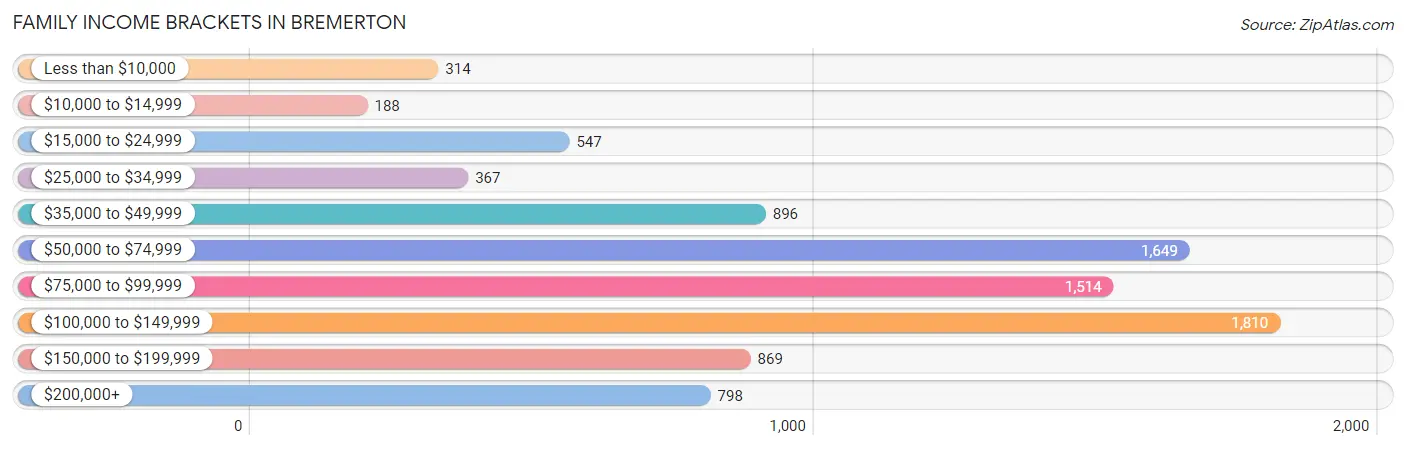
| Income Bracket | # Families | % Families |
| Less than $10,000 | 314 | 3.5% |
| $10,000 to $14,999 | 188 | 2.1% |
| $15,000 to $24,999 | 547 | 6.1% |
| $25,000 to $34,999 | 367 | 4.1% |
| $35,000 to $49,999 | 896 | 10.0% |
| $50,000 to $74,999 | 1,649 | 18.4% |
| $75,000 to $99,999 | 1,514 | 16.9% |
| $100,000 to $149,999 | 1,810 | 20.2% |
| $150,000 to $199,999 | 869 | 9.7% |
| $200,000+ | 798 | 8.9% |
Family Income by Famaliy Size in Bremerton
7+ person families (101 | 1.1%) account for the highest median family income in Bremerton with $132,083 per family, while 2-person families (4,630 | 51.7%) have the highest median income of $43,984 per family member.
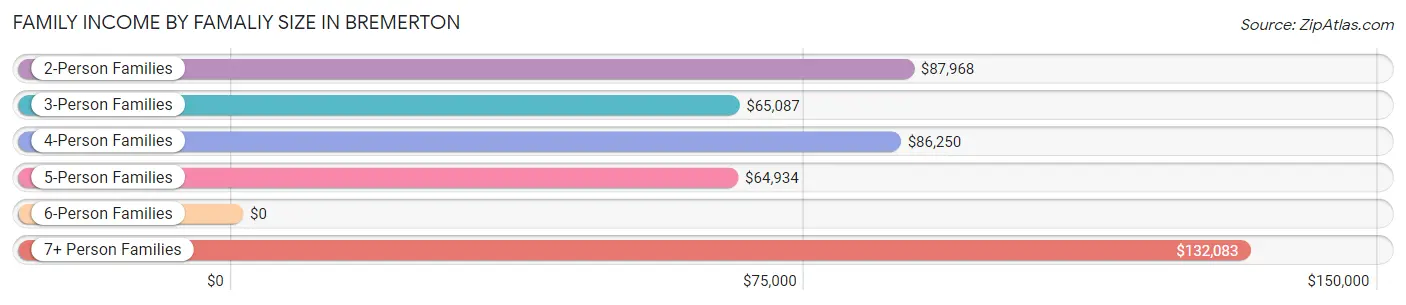
| Income Bracket | # Families | Median Income |
| 2-Person Families | 4,630 (51.7%) | $87,968 |
| 3-Person Families | 2,287 (25.5%) | $65,087 |
| 4-Person Families | 1,141 (12.7%) | $86,250 |
| 5-Person Families | 618 (6.9%) | $64,934 |
| 6-Person Families | 184 (2.1%) | $0 |
| 7+ Person Families | 101 (1.1%) | $132,083 |
| Total | 8,961 (100.0%) | $84,330 |
Family Income by Number of Earners in Bremerton
The median family income in Bremerton is $84,330, with families comprising 3+ earners (569) having the highest median family income of $144,550, while families with 1 earner (3,284) have the lowest median family income of $63,153, accounting for 6.4% and 36.6% of families, respectively.
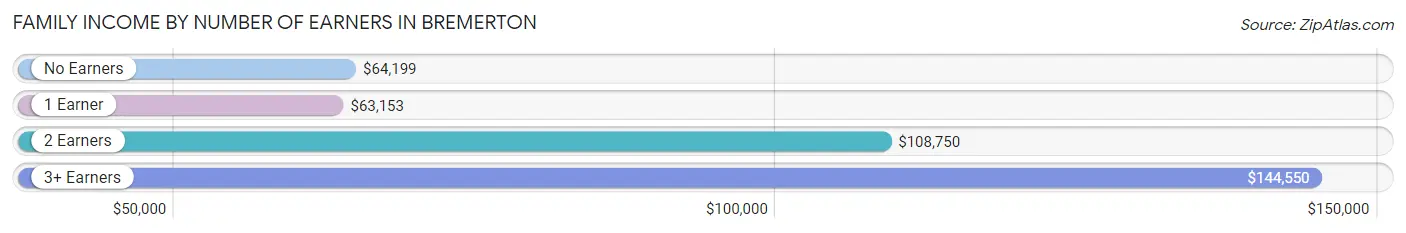
| Number of Earners | # Families | Median Income |
| No Earners | 1,189 (13.3%) | $64,199 |
| 1 Earner | 3,284 (36.6%) | $63,153 |
| 2 Earners | 3,919 (43.7%) | $108,750 |
| 3+ Earners | 569 (6.4%) | $144,550 |
| Total | 8,961 (100.0%) | $84,330 |
Household Income in Bremerton
Household Income Brackets in Bremerton
With 3,708 households falling in the category, the $50,000 to $74,999 income range is the most frequent in Bremerton, accounting for 20.9% of all households. In contrast, only 852 households (4.8%) fall into the $10,000 to $14,999 income bracket, making it the least populous group.
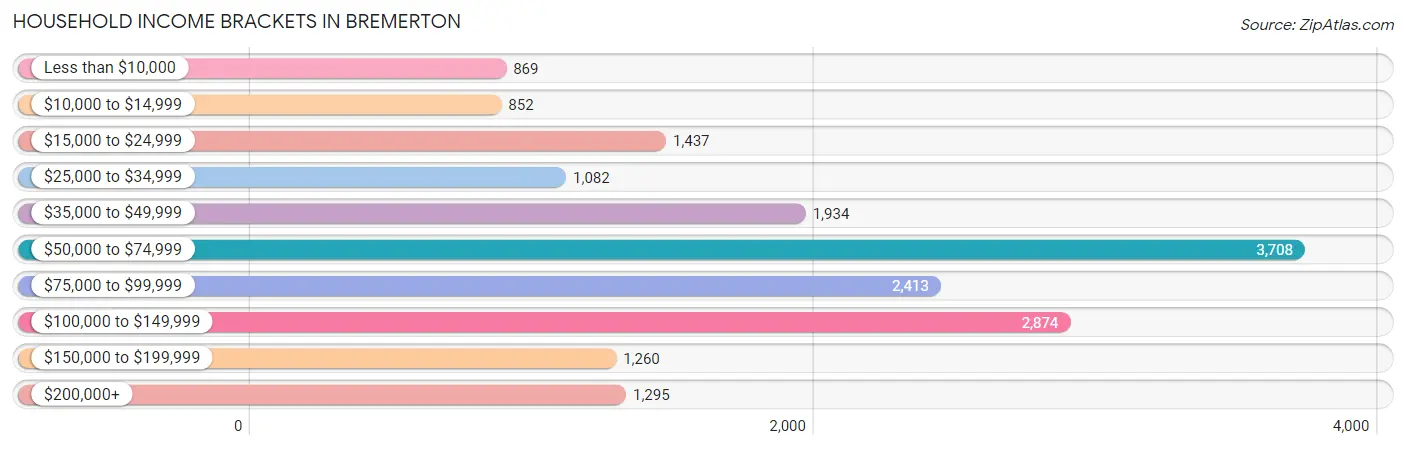
| Income Bracket | # Households | % Households |
| Less than $10,000 | 869 | 4.9% |
| $10,000 to $14,999 | 852 | 4.8% |
| $15,000 to $24,999 | 1,437 | 8.1% |
| $25,000 to $34,999 | 1,082 | 6.1% |
| $35,000 to $49,999 | 1,934 | 10.9% |
| $50,000 to $74,999 | 3,708 | 20.9% |
| $75,000 to $99,999 | 2,413 | 13.6% |
| $100,000 to $149,999 | 2,874 | 16.2% |
| $150,000 to $199,999 | 1,260 | 7.1% |
| $200,000+ | 1,295 | 7.3% |
Household Income by Householder Age in Bremerton
The median household income in Bremerton is $68,556, with the highest median household income of $78,919 found in the 25 to 44 years age bracket for the primary householder. A total of 7,553 households (42.6%) fall into this category. Meanwhile, the 65+ years age bracket for the primary householder has the lowest median household income of $46,451, with 3,982 households (22.5%) in this group.
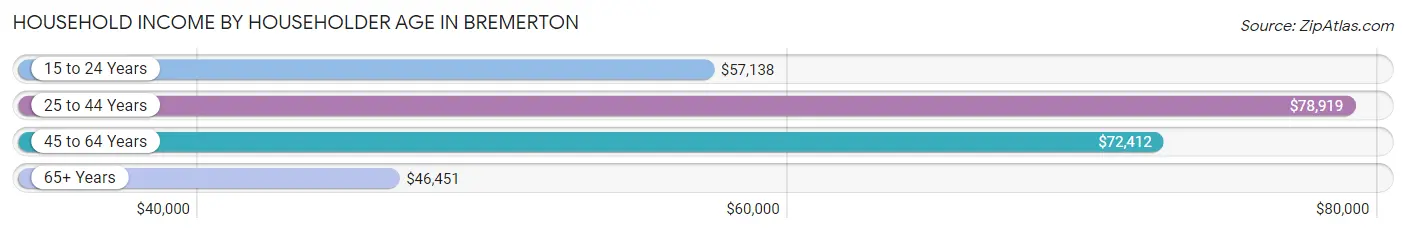
| Income Bracket | # Households | Median Income |
| 15 to 24 Years | 1,269 (7.1%) | $57,138 |
| 25 to 44 Years | 7,553 (42.6%) | $78,919 |
| 45 to 64 Years | 4,936 (27.8%) | $72,412 |
| 65+ Years | 3,982 (22.5%) | $46,451 |
| Total | 17,740 (100.0%) | $68,556 |
Poverty in Bremerton
Income Below Poverty by Sex and Age in Bremerton
With 12.5% poverty level for males and 16.3% for females among the residents of Bremerton, 15 year old males and 15 year old females are the most vulnerable to poverty, with 116 males (38.8%) and 65 females (47.4%) in their respective age groups living below the poverty level.
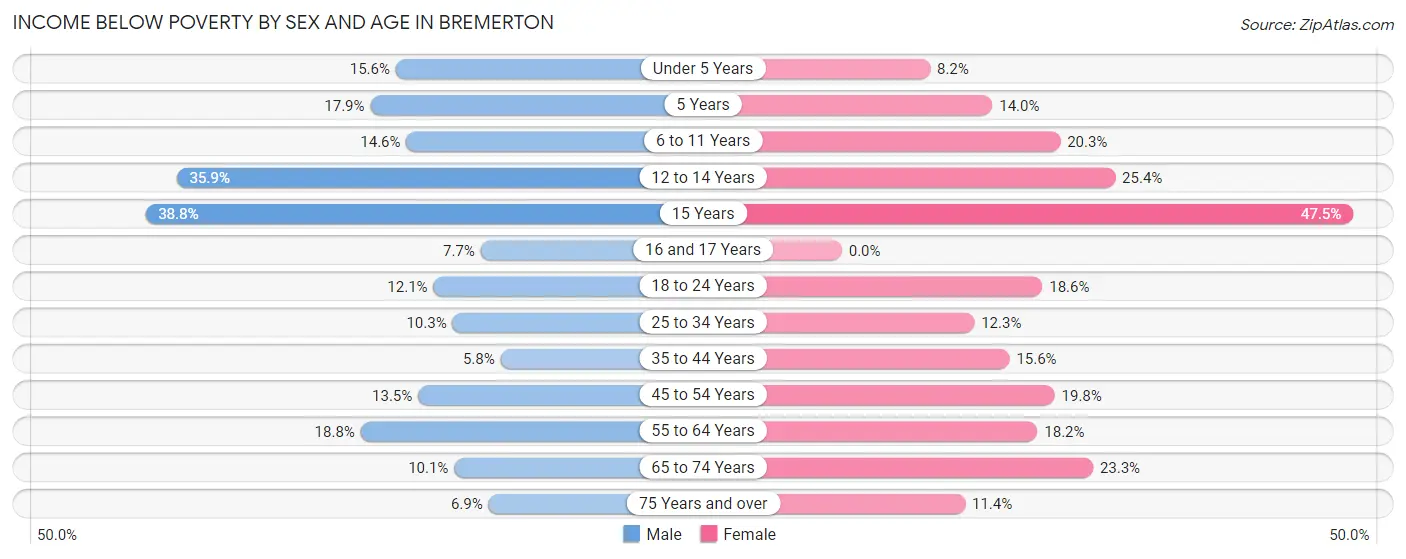
| Age Bracket | Male | Female |
| Under 5 Years | 204 (15.5%) | 99 (8.2%) |
| 5 Years | 36 (17.9%) | 19 (14.0%) |
| 6 to 11 Years | 178 (14.6%) | 236 (20.3%) |
| 12 to 14 Years | 177 (35.9%) | 102 (25.4%) |
| 15 Years | 116 (38.8%) | 65 (47.4%) |
| 16 and 17 Years | 23 (7.7%) | 0 (0.0%) |
| 18 to 24 Years | 249 (12.1%) | 362 (18.6%) |
| 25 to 34 Years | 529 (10.3%) | 499 (12.3%) |
| 35 to 44 Years | 192 (5.8%) | 410 (15.6%) |
| 45 to 54 Years | 293 (13.5%) | 333 (19.8%) |
| 55 to 64 Years | 422 (18.8%) | 451 (18.1%) |
| 65 to 74 Years | 124 (10.1%) | 389 (23.3%) |
| 75 Years and over | 67 (6.9%) | 183 (11.4%) |
| Total | 2,610 (12.5%) | 3,148 (16.3%) |
Income Above Poverty by Sex and Age in Bremerton
According to the poverty statistics in Bremerton, males aged 35 to 44 years and females aged 16 and 17 years are the age groups that are most secure financially, with 94.2% of males and 100.0% of females in these age groups living above the poverty line.
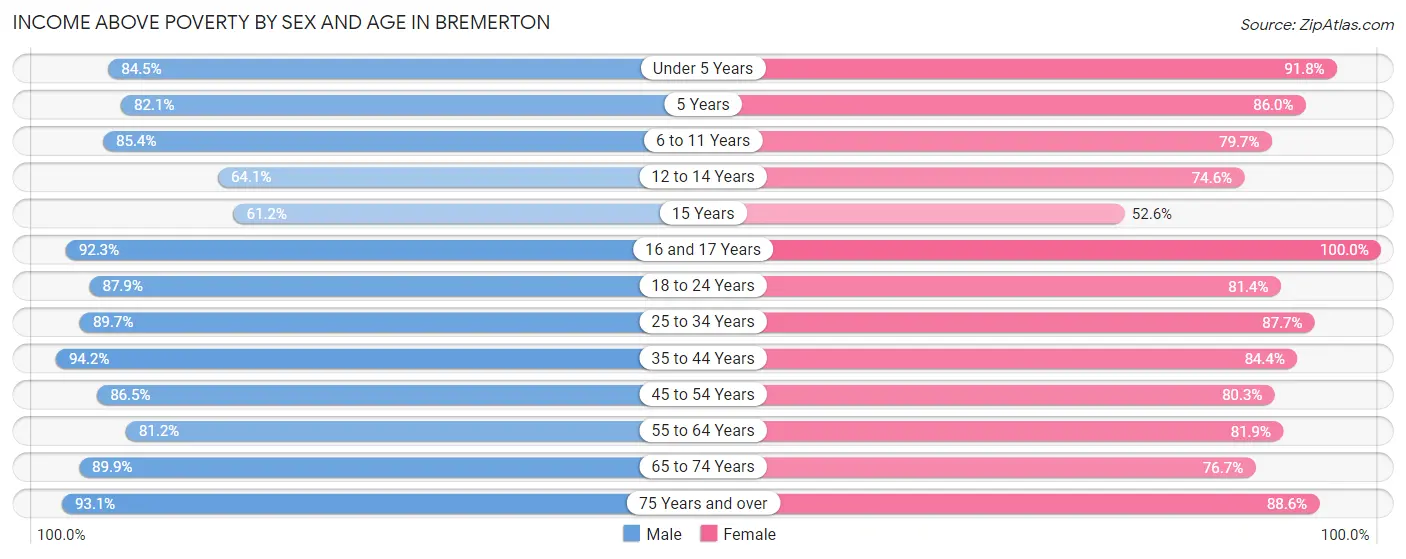
| Age Bracket | Male | Female |
| Under 5 Years | 1,108 (84.5%) | 1,110 (91.8%) |
| 5 Years | 165 (82.1%) | 117 (86.0%) |
| 6 to 11 Years | 1,044 (85.4%) | 928 (79.7%) |
| 12 to 14 Years | 316 (64.1%) | 300 (74.6%) |
| 15 Years | 183 (61.2%) | 72 (52.5%) |
| 16 and 17 Years | 277 (92.3%) | 206 (100.0%) |
| 18 to 24 Years | 1,816 (87.9%) | 1,583 (81.4%) |
| 25 to 34 Years | 4,611 (89.7%) | 3,561 (87.7%) |
| 35 to 44 Years | 3,099 (94.2%) | 2,225 (84.4%) |
| 45 to 54 Years | 1,880 (86.5%) | 1,353 (80.2%) |
| 55 to 64 Years | 1,822 (81.2%) | 2,034 (81.9%) |
| 65 to 74 Years | 1,100 (89.9%) | 1,280 (76.7%) |
| 75 Years and over | 898 (93.1%) | 1,416 (88.6%) |
| Total | 18,319 (87.5%) | 16,185 (83.7%) |
Income Below Poverty Among Married-Couple Families in Bremerton
The poverty statistics for married-couple families in Bremerton show that 3.8% or 233 of the total 6,123 families live below the poverty line. Families with 3 or 4 children have the highest poverty rate of 8.9%, comprising of 40 families. On the other hand, families with 5 or more children have the lowest poverty rate of 0.0%, which includes 0 families.
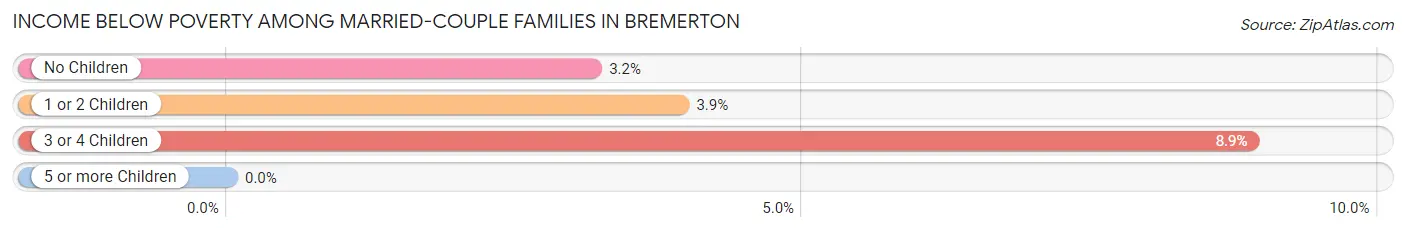
| Children | Above Poverty | Below Poverty |
| No Children | 3,668 (96.8%) | 120 (3.2%) |
| 1 or 2 Children | 1,786 (96.1%) | 73 (3.9%) |
| 3 or 4 Children | 410 (91.1%) | 40 (8.9%) |
| 5 or more Children | 26 (100.0%) | 0 (0.0%) |
| Total | 5,890 (96.2%) | 233 (3.8%) |
Income Below Poverty Among Single-Parent Households in Bremerton
According to the poverty data in Bremerton, 13.6% or 136 single-father households and 25.6% or 470 single-mother households are living below the poverty line. Among single-father households, those with 3 or 4 children have the highest poverty rate, with 33 households (31.1%) experiencing poverty. Likewise, among single-mother households, those with 3 or 4 children have the highest poverty rate, with 125 households (57.9%) falling below the poverty line.
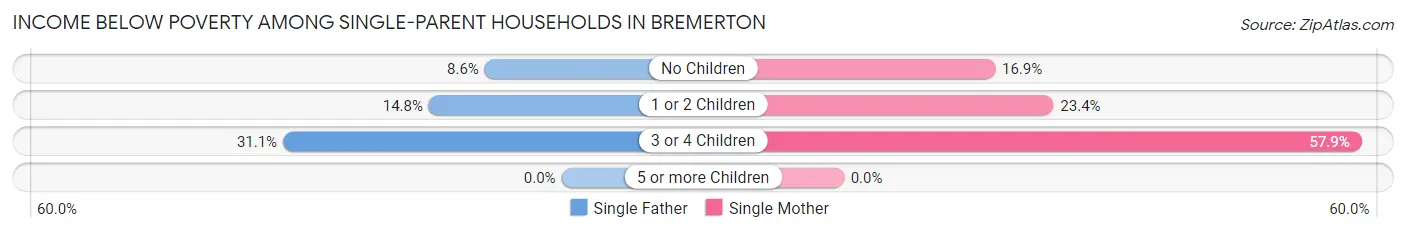
| Children | Single Father | Single Mother |
| No Children | 41 (8.6%) | 90 (16.9%) |
| 1 or 2 Children | 62 (14.8%) | 255 (23.4%) |
| 3 or 4 Children | 33 (31.1%) | 125 (57.9%) |
| 5 or more Children | 0 (0.0%) | 0 (0.0%) |
| Total | 136 (13.6%) | 470 (25.6%) |
Income Below Poverty Among Married-Couple vs Single-Parent Households in Bremerton
The poverty data for Bremerton shows that 233 of the married-couple family households (3.8%) and 606 of the single-parent households (21.3%) are living below the poverty level. Within the married-couple family households, those with 3 or 4 children have the highest poverty rate, with 40 households (8.9%) falling below the poverty line. Among the single-parent households, those with 3 or 4 children have the highest poverty rate, with 158 household (49.1%) living below poverty.
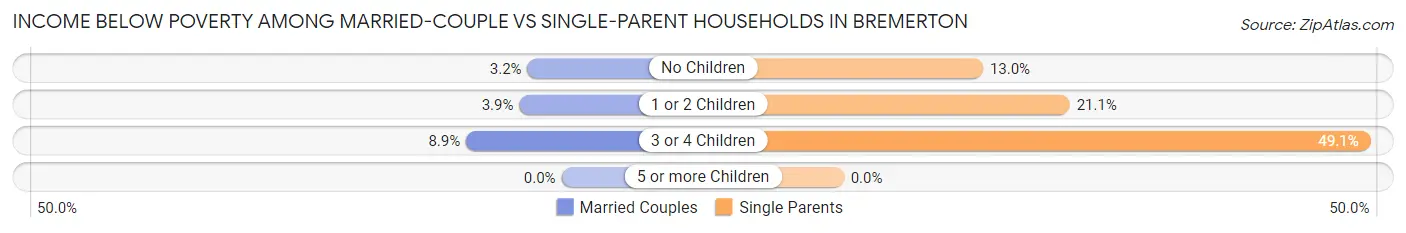
| Children | Married-Couple Families | Single-Parent Households |
| No Children | 120 (3.2%) | 131 (13.0%) |
| 1 or 2 Children | 73 (3.9%) | 317 (21.0%) |
| 3 or 4 Children | 40 (8.9%) | 158 (49.1%) |
| 5 or more Children | 0 (0.0%) | 0 (0.0%) |
| Total | 233 (3.8%) | 606 (21.3%) |
Race in Bremerton
The most populous races in Bremerton are White / Caucasian (30,492 | 69.3%), Hispanic or Latino (5,666 | 12.9%), and Two or more Races (5,419 | 12.3%).
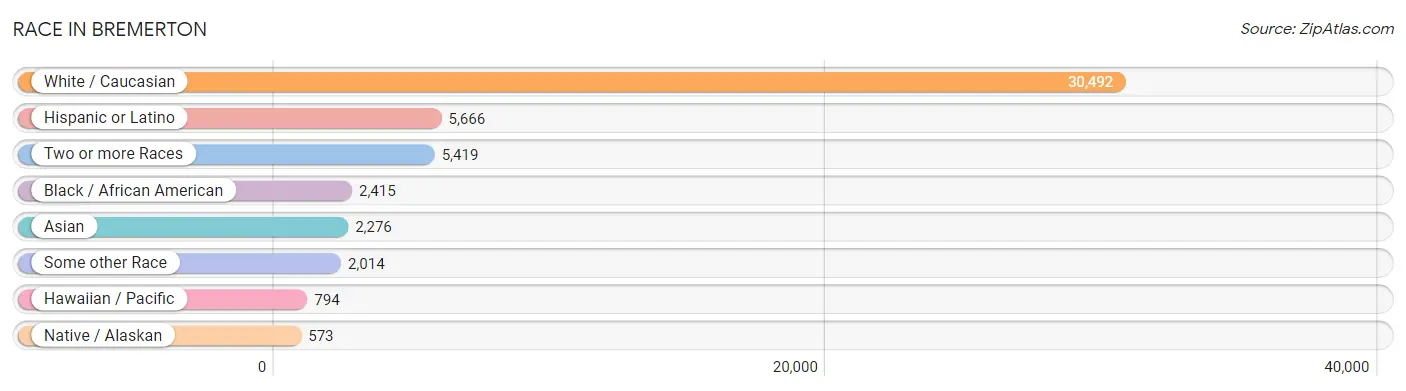
| Race | # Population | % Population |
| Asian | 2,276 | 5.2% |
| Black / African American | 2,415 | 5.5% |
| Hawaiian / Pacific | 794 | 1.8% |
| Hispanic or Latino | 5,666 | 12.9% |
| Native / Alaskan | 573 | 1.3% |
| White / Caucasian | 30,492 | 69.3% |
| Two or more Races | 5,419 | 12.3% |
| Some other Race | 2,014 | 4.6% |
| Total | 43,983 | 100.0% |
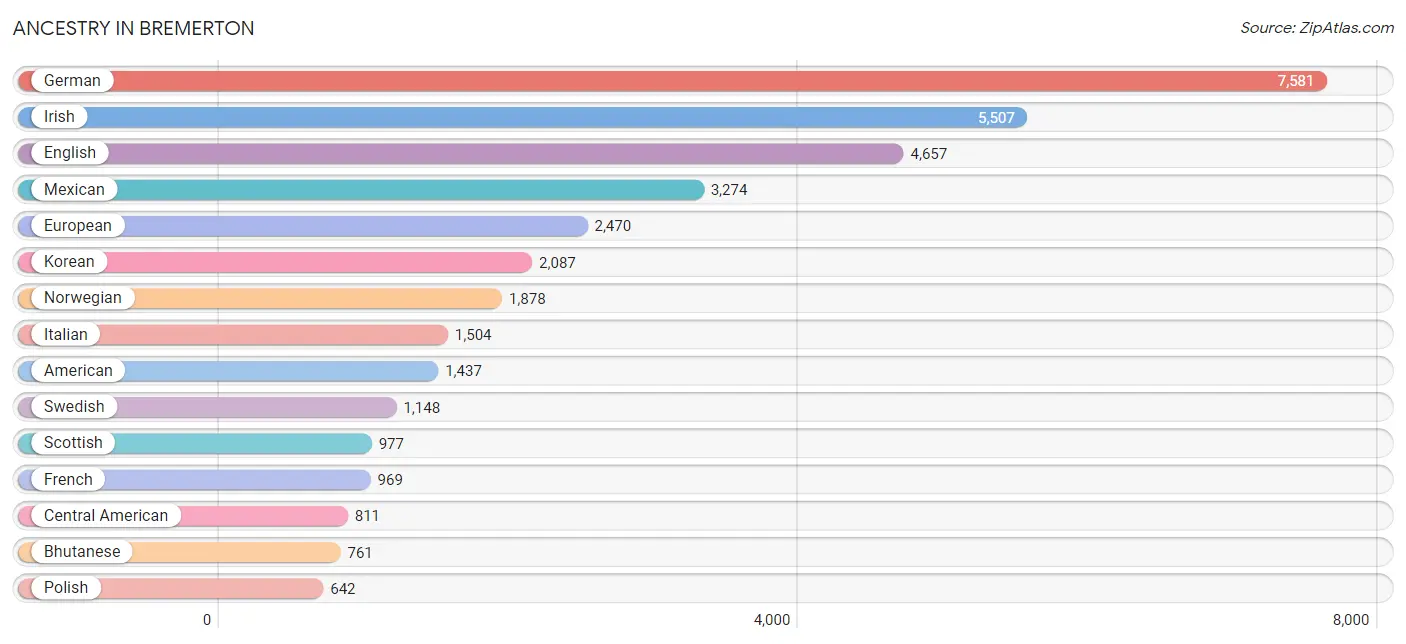
Ancestry in Bremerton
The most populous ancestries reported in Bremerton are German (7,581 | 17.2%), Irish (5,507 | 12.5%), English (4,657 | 10.6%), Mexican (3,274 | 7.4%), and European (2,470 | 5.6%), together accounting for 53.4% of all Bremerton residents.
| Ancestry | # Population | % Population |
| African | 53 | 0.1% |
| Aleut | 37 | 0.1% |
| American | 1,437 | 3.3% |
| Apache | 93 | 0.2% |
| Arab | 162 | 0.4% |
| Australian | 9 | 0.0% |
| Austrian | 61 | 0.1% |
| Barbadian | 29 | 0.1% |
| Bermudan | 2 | 0.0% |
| Bhutanese | 761 | 1.7% |
| Blackfeet | 92 | 0.2% |
| Brazilian | 2 | 0.0% |
| British | 455 | 1.0% |
| Burmese | 156 | 0.4% |
| Canadian | 134 | 0.3% |
| Central American | 811 | 1.8% |
| Cherokee | 443 | 1.0% |
| Chickasaw | 13 | 0.0% |
| Chippewa | 98 | 0.2% |
| Choctaw | 70 | 0.2% |
| Colombian | 31 | 0.1% |
| Costa Rican | 12 | 0.0% |
| Cree | 30 | 0.1% |
| Creek | 8 | 0.0% |
| Croatian | 44 | 0.1% |
| Cuban | 131 | 0.3% |
| Czech | 78 | 0.2% |
| Czechoslovakian | 26 | 0.1% |
| Danish | 360 | 0.8% |
| Dominican | 31 | 0.1% |
| Dutch | 406 | 0.9% |
| Eastern European | 124 | 0.3% |
| English | 4,657 | 10.6% |
| European | 2,470 | 5.6% |
| Fijian | 43 | 0.1% |
| Finnish | 137 | 0.3% |
| French | 969 | 2.2% |
| French American Indian | 21 | 0.1% |
| French Canadian | 304 | 0.7% |
| German | 7,581 | 17.2% |
| Ghanaian | 18 | 0.0% |
| Greek | 97 | 0.2% |
| Guamanian / Chamorro | 446 | 1.0% |
| Guatemalan | 634 | 1.4% |
| Guyanese | 39 | 0.1% |
| Haitian | 59 | 0.1% |
| Honduran | 52 | 0.1% |
| Hungarian | 19 | 0.0% |
| Icelander | 40 | 0.1% |
| Indian (Asian) | 338 | 0.8% |
| Inupiat | 20 | 0.1% |
| Iranian | 12 | 0.0% |
| Irish | 5,507 | 12.5% |
| Iroquois | 23 | 0.1% |
| Israeli | 30 | 0.1% |
| Italian | 1,504 | 3.4% |
| Jamaican | 36 | 0.1% |
| Japanese | 2 | 0.0% |
| Kiowa | 20 | 0.1% |
| Korean | 2,087 | 4.8% |
| Laotian | 12 | 0.0% |
| Latvian | 12 | 0.0% |
| Lebanese | 47 | 0.1% |
| Lithuanian | 12 | 0.0% |
| Marshallese | 228 | 0.5% |
| Mexican | 3,274 | 7.4% |
| Mexican American Indian | 149 | 0.3% |
| Mongolian | 9 | 0.0% |
| Moroccan | 93 | 0.2% |
| Native Hawaiian | 297 | 0.7% |
| Navajo | 76 | 0.2% |
| Nicaraguan | 63 | 0.1% |
| Nigerian | 78 | 0.2% |
| Northern European | 222 | 0.5% |
| Norwegian | 1,878 | 4.3% |
| Okinawan | 7 | 0.0% |
| Ottawa | 17 | 0.0% |
| Pakistani | 45 | 0.1% |
| Palestinian | 22 | 0.1% |
| Panamanian | 8 | 0.0% |
| Peruvian | 30 | 0.1% |
| Polish | 642 | 1.5% |
| Portuguese | 197 | 0.4% |
| Puerto Rican | 547 | 1.2% |
| Puget Sound Salish | 27 | 0.1% |
| Romanian | 18 | 0.0% |
| Russian | 195 | 0.4% |
| Salvadoran | 42 | 0.1% |
| Samoan | 79 | 0.2% |
| Scandinavian | 639 | 1.5% |
| Scotch-Irish | 500 | 1.1% |
| Scottish | 977 | 2.2% |
| Serbian | 10 | 0.0% |
| Sioux | 43 | 0.1% |
| Slavic | 67 | 0.2% |
| Slovak | 42 | 0.1% |
| Somali | 2 | 0.0% |
| South American | 61 | 0.1% |
| Spaniard | 151 | 0.3% |
| Spanish | 284 | 0.6% |
| Sri Lankan | 191 | 0.4% |
| Subsaharan African | 197 | 0.4% |
| Swedish | 1,148 | 2.6% |
| Swiss | 103 | 0.2% |
| Thai | 105 | 0.2% |
| Tlingit-Haida | 42 | 0.1% |
| Tohono O'Odham | 54 | 0.1% |
| Trinidadian and Tobagonian | 19 | 0.0% |
| Ukrainian | 66 | 0.2% |
| Welsh | 536 | 1.2% |
| Yakama | 5 | 0.0% |
| Yaqui | 10 | 0.0% | View All 112 Rows |
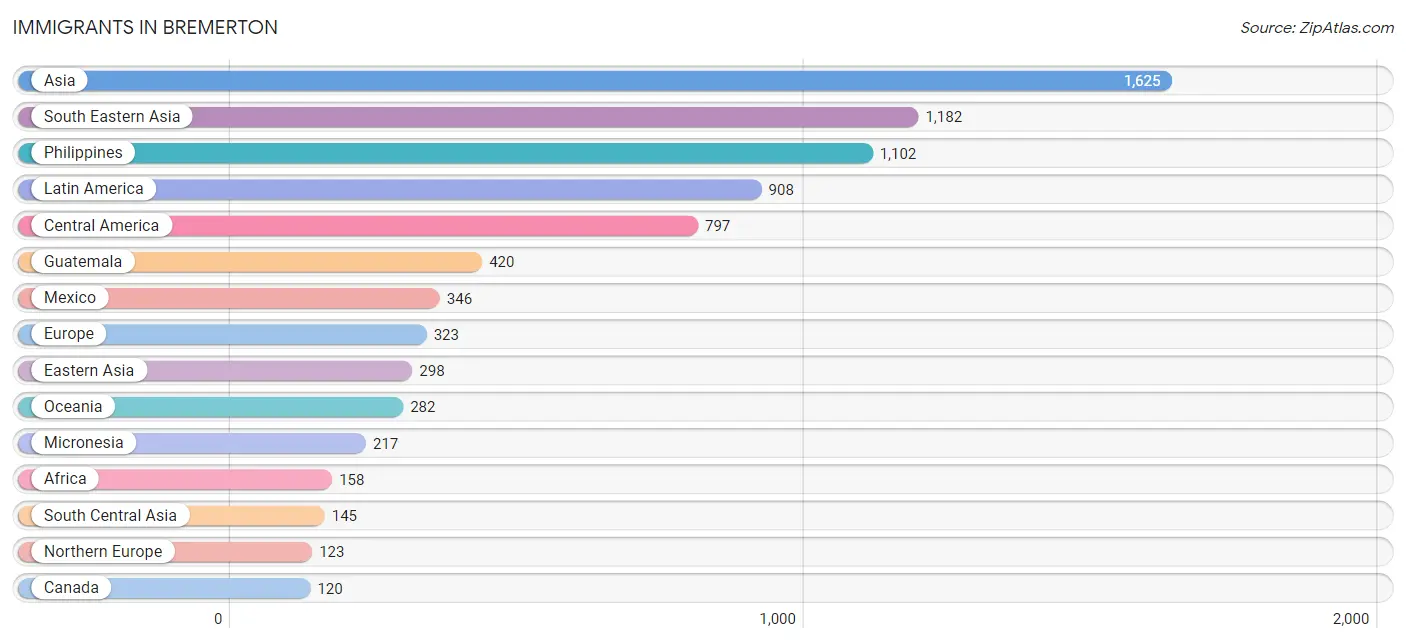
Immigrants in Bremerton
The most numerous immigrant groups reported in Bremerton came from Asia (1,625 | 3.7%), South Eastern Asia (1,182 | 2.7%), Philippines (1,102 | 2.5%), Latin America (908 | 2.1%), and Central America (797 | 1.8%), together accounting for 12.8% of all Bremerton residents.
| Immigration Origin | # Population | % Population |
| Africa | 158 | 0.4% |
| Asia | 1,625 | 3.7% |
| Australia | 22 | 0.1% |
| Barbados | 12 | 0.0% |
| Brazil | 2 | 0.0% |
| Cambodia | 2 | 0.0% |
| Cameroon | 10 | 0.0% |
| Canada | 120 | 0.3% |
| Caribbean | 57 | 0.1% |
| Central America | 797 | 1.8% |
| China | 99 | 0.2% |
| Colombia | 24 | 0.1% |
| Croatia | 32 | 0.1% |
| Cuba | 23 | 0.1% |
| Czechoslovakia | 6 | 0.0% |
| Dominican Republic | 9 | 0.0% |
| Eastern Africa | 98 | 0.2% |
| Eastern Asia | 298 | 0.7% |
| Eastern Europe | 83 | 0.2% |
| El Salvador | 20 | 0.1% |
| England | 28 | 0.1% |
| Europe | 323 | 0.7% |
| France | 40 | 0.1% |
| Germany | 30 | 0.1% |
| Greece | 12 | 0.0% |
| Guatemala | 420 | 0.9% |
| Guyana | 22 | 0.1% |
| Hong Kong | 47 | 0.1% |
| Hungary | 17 | 0.0% |
| India | 116 | 0.3% |
| Indonesia | 12 | 0.0% |
| Ireland | 30 | 0.1% |
| Jamaica | 8 | 0.0% |
| Japan | 114 | 0.3% |
| Kenya | 96 | 0.2% |
| Korea | 85 | 0.2% |
| Latin America | 908 | 2.1% |
| Malaysia | 9 | 0.0% |
| Mexico | 346 | 0.8% |
| Micronesia | 217 | 0.5% |
| Middle Africa | 10 | 0.0% |
| Morocco | 40 | 0.1% |
| Netherlands | 31 | 0.1% |
| Nicaragua | 11 | 0.0% |
| Northern Africa | 40 | 0.1% |
| Northern Europe | 123 | 0.3% |
| Norway | 10 | 0.0% |
| Oceania | 282 | 0.6% |
| Pakistan | 29 | 0.1% |
| Peru | 6 | 0.0% |
| Philippines | 1,102 | 2.5% |
| Romania | 11 | 0.0% |
| Russia | 11 | 0.0% |
| Singapore | 4 | 0.0% |
| Somalia | 2 | 0.0% |
| South Africa | 10 | 0.0% |
| South America | 54 | 0.1% |
| South Central Asia | 145 | 0.3% |
| South Eastern Asia | 1,182 | 2.7% |
| Southern Europe | 12 | 0.0% |
| Switzerland | 4 | 0.0% |
| Taiwan | 14 | 0.0% |
| Thailand | 21 | 0.1% |
| Trinidad and Tobago | 5 | 0.0% |
| Vietnam | 32 | 0.1% |
| Western Europe | 105 | 0.2% | View All 66 Rows |
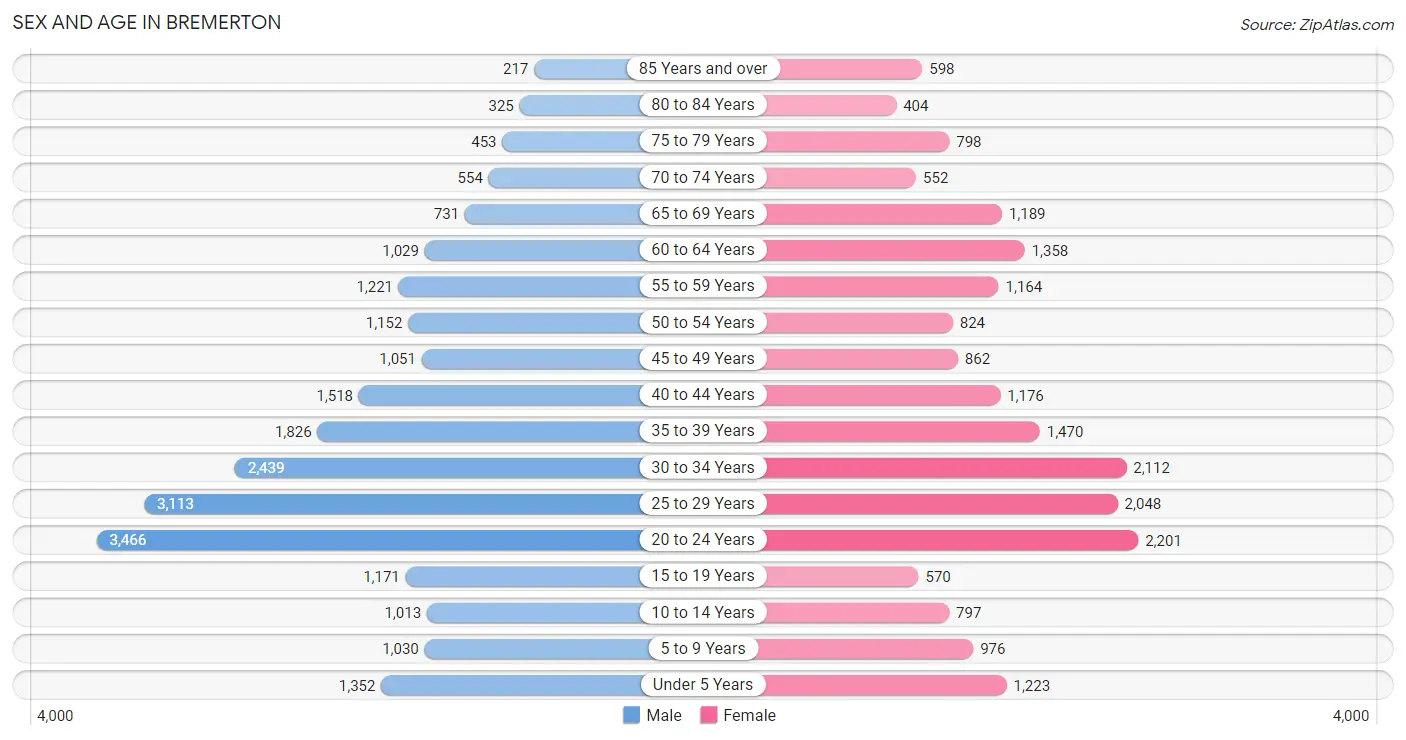
Sex and Age in Bremerton
Sex and Age in Bremerton
The most populous age groups in Bremerton are 20 to 24 Years (3,466 | 14.6%) for men and 20 to 24 Years (2,201 | 10.8%) for women.
| Age Bracket | Male | Female |
| Under 5 Years | 1,352 (5.7%) | 1,223 (6.0%) |
| 5 to 9 Years | 1,030 (4.3%) | 976 (4.8%) |
| 10 to 14 Years | 1,013 (4.3%) | 797 (3.9%) |
| 15 to 19 Years | 1,171 (5.0%) | 570 (2.8%) |
| 20 to 24 Years | 3,466 (14.6%) | 2,201 (10.8%) |
| 25 to 29 Years | 3,113 (13.2%) | 2,048 (10.1%) |
| 30 to 34 Years | 2,439 (10.3%) | 2,112 (10.4%) |
| 35 to 39 Years | 1,826 (7.7%) | 1,470 (7.2%) |
| 40 to 44 Years | 1,518 (6.4%) | 1,176 (5.8%) |
| 45 to 49 Years | 1,051 (4.4%) | 862 (4.2%) |
| 50 to 54 Years | 1,152 (4.9%) | 824 (4.1%) |
| 55 to 59 Years | 1,221 (5.2%) | 1,164 (5.7%) |
| 60 to 64 Years | 1,029 (4.3%) | 1,358 (6.7%) |
| 65 to 69 Years | 731 (3.1%) | 1,189 (5.9%) |
| 70 to 74 Years | 554 (2.3%) | 552 (2.7%) |
| 75 to 79 Years | 453 (1.9%) | 798 (3.9%) |
| 80 to 84 Years | 325 (1.4%) | 404 (2.0%) |
| 85 Years and over | 217 (0.9%) | 598 (2.9%) |
| Total | 23,661 (100.0%) | 20,322 (100.0%) |
Families and Households in Bremerton
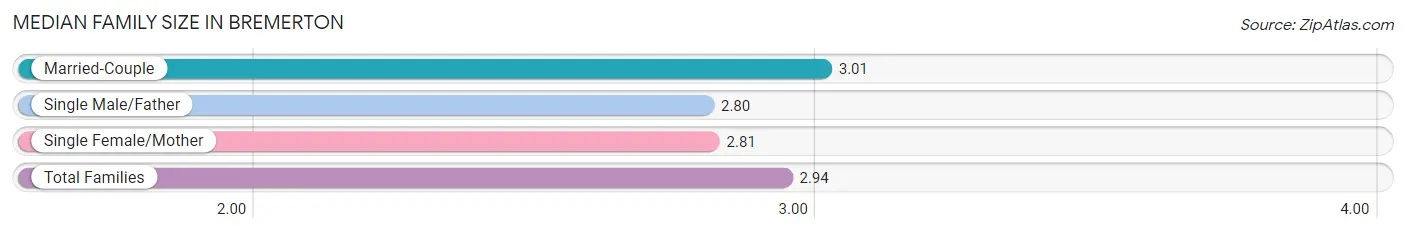
Median Family Size in Bremerton
The median family size in Bremerton is 2.94 persons per family, with married-couple families (6,123 | 68.3%) accounting for the largest median family size of 3.01 persons per family. On the other hand, single male/father families (1,002 | 11.2%) represent the smallest median family size with 2.80 persons per family.
| Family Type | # Families | Family Size |
| Married-Couple | 6,123 (68.3%) | 3.01 |
| Single Male/Father | 1,002 (11.2%) | 2.80 |
| Single Female/Mother | 1,836 (20.5%) | 2.81 |
| Total Families | 8,961 (100.0%) | 2.94 |
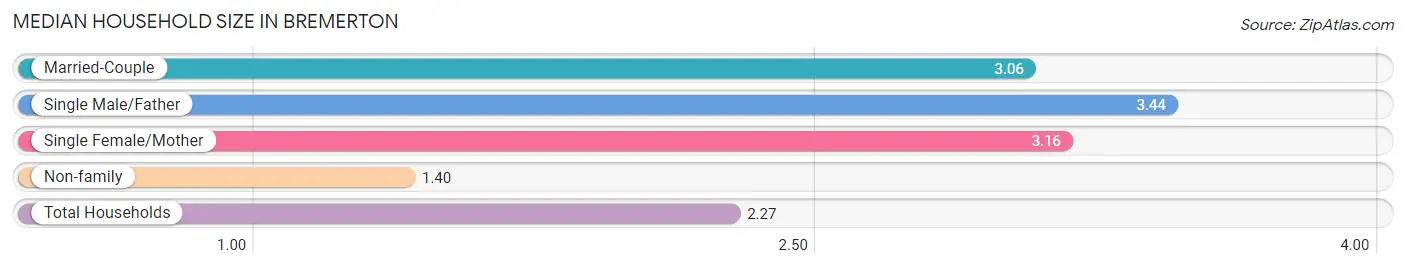
Median Household Size in Bremerton
The median household size in Bremerton is 2.27 persons per household, with single male/father households (1,002 | 5.7%) accounting for the largest median household size of 3.44 persons per household. non-family households (8,779 | 49.5%) represent the smallest median household size with 1.40 persons per household.
| Household Type | # Households | Household Size |
| Married-Couple | 6,123 (34.5%) | 3.06 |
| Single Male/Father | 1,002 (5.7%) | 3.44 |
| Single Female/Mother | 1,836 (10.3%) | 3.16 |
| Non-family | 8,779 (49.5%) | 1.40 |
| Total Households | 17,740 (100.0%) | 2.27 |
Household Size by Marriage Status in Bremerton
Out of a total of 17,740 households in Bremerton, 8,961 (50.5%) are family households, while 8,779 (49.5%) are nonfamily households. The most numerous type of family households are 2-person households, comprising 4,257, and the most common type of nonfamily households are 1-person households, comprising 6,310.
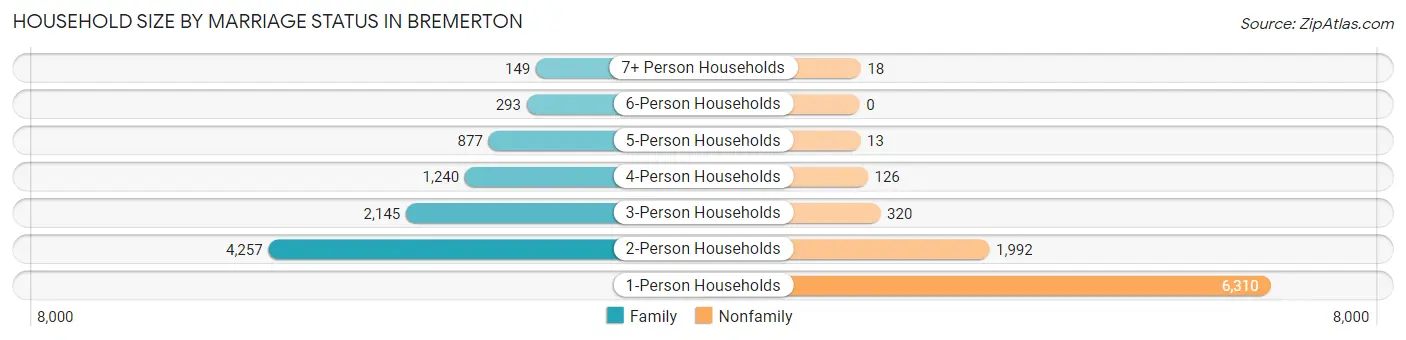
| Household Size | Family Households | Nonfamily Households |
| 1-Person Households | - | 6,310 (35.6%) |
| 2-Person Households | 4,257 (24.0%) | 1,992 (11.2%) |
| 3-Person Households | 2,145 (12.1%) | 320 (1.8%) |
| 4-Person Households | 1,240 (7.0%) | 126 (0.7%) |
| 5-Person Households | 877 (4.9%) | 13 (0.1%) |
| 6-Person Households | 293 (1.7%) | 0 (0.0%) |
| 7+ Person Households | 149 (0.8%) | 18 (0.1%) |
| Total | 8,961 (50.5%) | 8,779 (49.5%) |
Female Fertility in Bremerton
Fertility by Age in Bremerton
Average fertility rate in Bremerton is 79.0 births per 1,000 women. Women in the age bracket of 20 to 34 years have the highest fertility rate with 120.0 births per 1,000 women. Women in the age bracket of 20 to 34 years acount for 90.7% of all women with births.
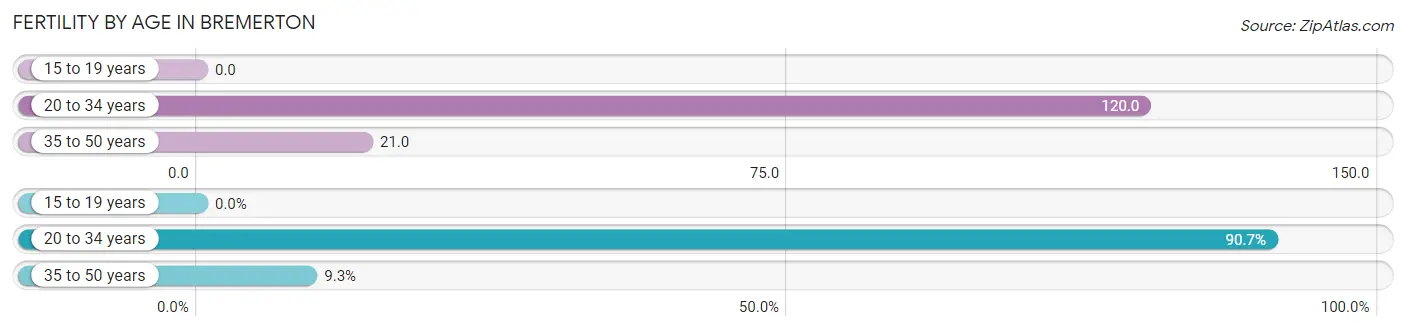
| Age Bracket | Women with Births | Births / 1,000 Women |
| 15 to 19 years | 0 (0.0%) | 0.0 |
| 20 to 34 years | 763 (90.7%) | 120.0 |
| 35 to 50 years | 78 (9.3%) | 21.0 |
| Total | 841 (100.0%) | 79.0 |
Fertility by Age by Marriage Status in Bremerton
62.2% of women with births (841) in Bremerton are married. The highest percentage of unmarried women with births falls into 20 to 34 years age bracket with 38.0% of them unmarried at the time of birth, while the lowest percentage of unmarried women with births belong to 35 to 50 years age bracket with 35.9% of them unmarried.
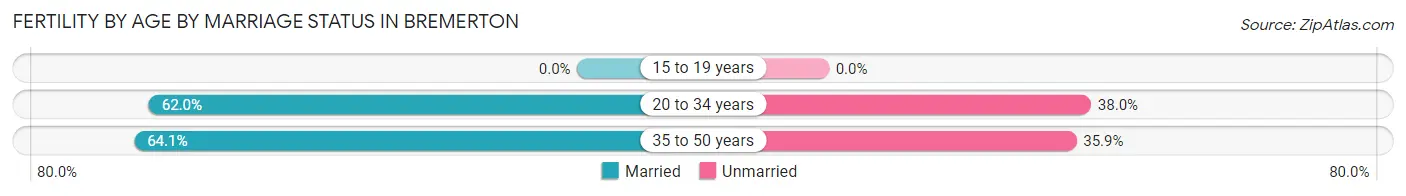
| Age Bracket | Married | Unmarried |
| 15 to 19 years | 0 (0.0%) | 0 (0.0%) |
| 20 to 34 years | 473 (62.0%) | 290 (38.0%) |
| 35 to 50 years | 50 (64.1%) | 28 (35.9%) |
| Total | 523 (62.2%) | 318 (37.8%) |
Fertility by Education in Bremerton
Average fertility rate in Bremerton is 79.0 births per 1,000 women. Women with the education attainment of college or associate's degree have the highest fertility rate of 97.0 births per 1,000 women, while women with the education attainment of graduate degree have the lowest fertility at 40.0 births per 1,000 women. Women with the education attainment of college or associate's degree represent 50.5% of all women with births.
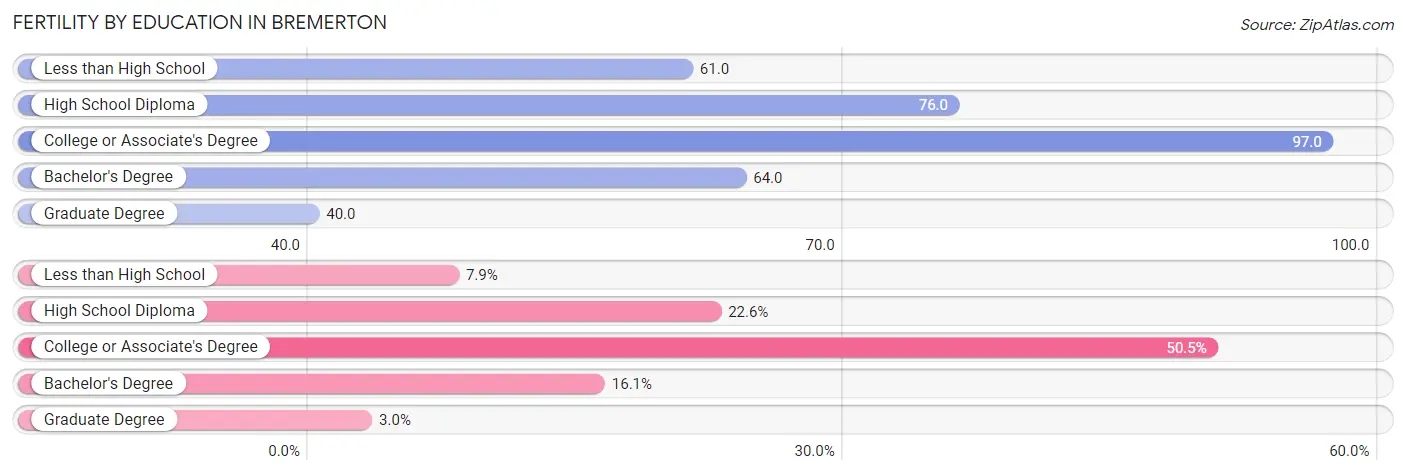
| Educational Attainment | Women with Births | Births / 1,000 Women |
| Less than High School | 66 (7.9%) | 61.0 |
| High School Diploma | 190 (22.6%) | 76.0 |
| College or Associate's Degree | 425 (50.5%) | 97.0 |
| Bachelor's Degree | 135 (16.1%) | 64.0 |
| Graduate Degree | 25 (3.0%) | 40.0 |
| Total | 841 (100.0%) | 79.0 |
Fertility by Education by Marriage Status in Bremerton
37.8% of women with births in Bremerton are unmarried. Women with the educational attainment of graduate degree are most likely to be married with 100.0% of them married at childbirth, while women with the educational attainment of college or associate's degree are least likely to be married with 51.5% of them unmarried at childbirth.
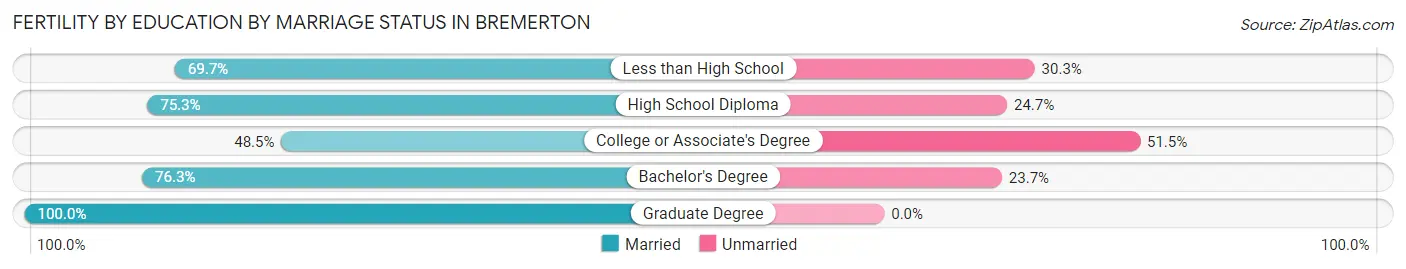
| Educational Attainment | Married | Unmarried |
| Less than High School | 46 (69.7%) | 20 (30.3%) |
| High School Diploma | 143 (75.3%) | 47 (24.7%) |
| College or Associate's Degree | 206 (48.5%) | 219 (51.5%) |
| Bachelor's Degree | 103 (76.3%) | 32 (23.7%) |
| Graduate Degree | 25 (100.0%) | 0 (0.0%) |
| Total | 523 (62.2%) | 318 (37.8%) |
Employment Characteristics in Bremerton
Employment by Class of Employer in Bremerton
Among the 23,124 employed individuals in Bremerton, private company employees (10,810 | 46.8%), federal government employees (7,931 | 34.3%), and not-for-profit organizations (1,786 | 7.7%) make up the most common classes of employment.
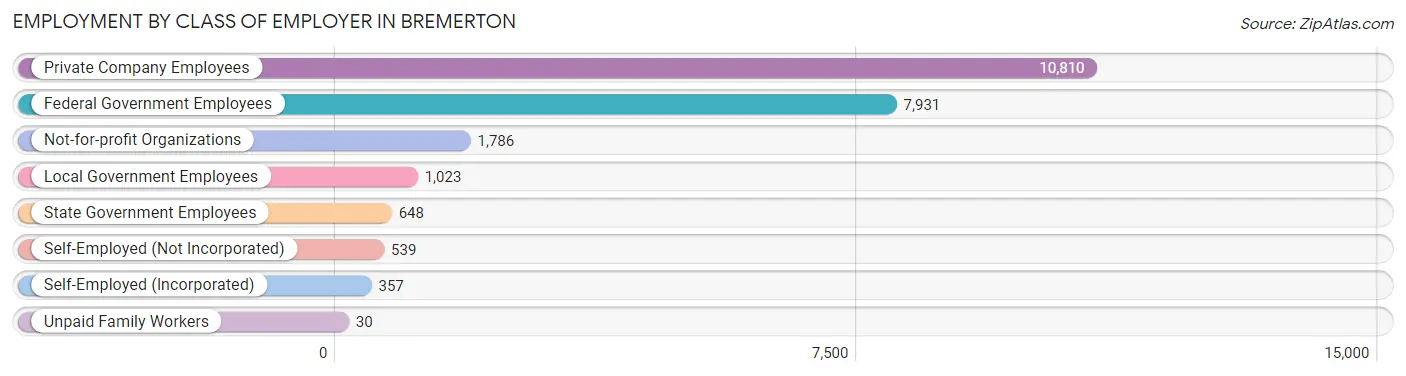
| Employer Class | # Employees | % Employees |
| Private Company Employees | 10,810 | 46.8% |
| Self-Employed (Incorporated) | 357 | 1.5% |
| Self-Employed (Not Incorporated) | 539 | 2.3% |
| Not-for-profit Organizations | 1,786 | 7.7% |
| Local Government Employees | 1,023 | 4.4% |
| State Government Employees | 648 | 2.8% |
| Federal Government Employees | 7,931 | 34.3% |
| Unpaid Family Workers | 30 | 0.1% |
| Total | 23,124 | 100.0% |
Employment Status by Age in Bremerton
According to the labor force statistics for Bremerton, out of the total population over 16 years of age (37,156), 67.2% or 24,969 individuals are in the labor force, with 5.5% or 1,373 of them unemployed. The age group with the highest labor force participation rate is 20 to 24 years, with 93.2% or 5,282 individuals in the labor force. Within the labor force, the 16 to 19 years age range has the highest percentage of unemployed individuals, with 19.0% or 100 of them being unemployed.
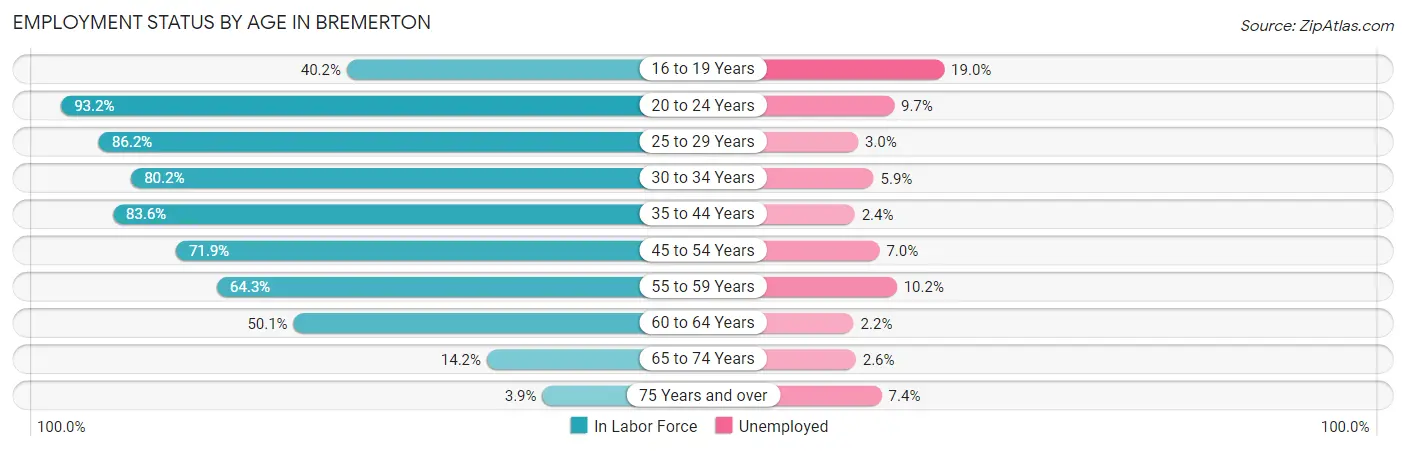
| Age Bracket | In Labor Force | Unemployed |
| 16 to 19 Years | 525 (40.2%) | 100 (19.0%) |
| 20 to 24 Years | 5,282 (93.2%) | 512 (9.7%) |
| 25 to 29 Years | 4,449 (86.2%) | 133 (3.0%) |
| 30 to 34 Years | 3,650 (80.2%) | 215 (5.9%) |
| 35 to 44 Years | 5,008 (83.6%) | 120 (2.4%) |
| 45 to 54 Years | 2,796 (71.9%) | 196 (7.0%) |
| 55 to 59 Years | 1,534 (64.3%) | 156 (10.2%) |
| 60 to 64 Years | 1,196 (50.1%) | 26 (2.2%) |
| 65 to 74 Years | 430 (14.2%) | 11 (2.6%) |
| 75 Years and over | 109 (3.9%) | 8 (7.4%) |
| Total | 24,969 (67.2%) | 1,373 (5.5%) |
Employment Status by Educational Attainment in Bremerton
According to labor force statistics for Bremerton, 76.5% of individuals (18,638) out of the total population between 25 and 64 years of age (24,363) are in the labor force, with 4.6% or 857 of them being unemployed. The group with the highest labor force participation rate are those with the educational attainment of bachelor's degree or higher, with 86.1% or 5,449 individuals in the labor force. Within the labor force, individuals with less than high school education have the highest percentage of unemployment, with 10.4% or 91 of them being unemployed.
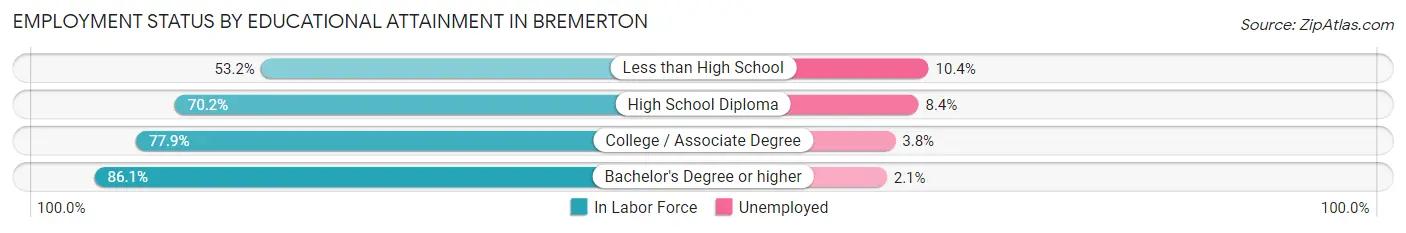
| Educational Attainment | In Labor Force | Unemployed |
| Less than High School | 871 (53.2%) | 170 (10.4%) |
| High School Diploma | 4,175 (70.2%) | 500 (8.4%) |
| College / Associate Degree | 8,140 (77.9%) | 397 (3.8%) |
| Bachelor's Degree or higher | 5,449 (86.1%) | 133 (2.1%) |
| Total | 18,638 (76.5%) | 1,121 (4.6%) |
Employment Occupations by Sex in Bremerton
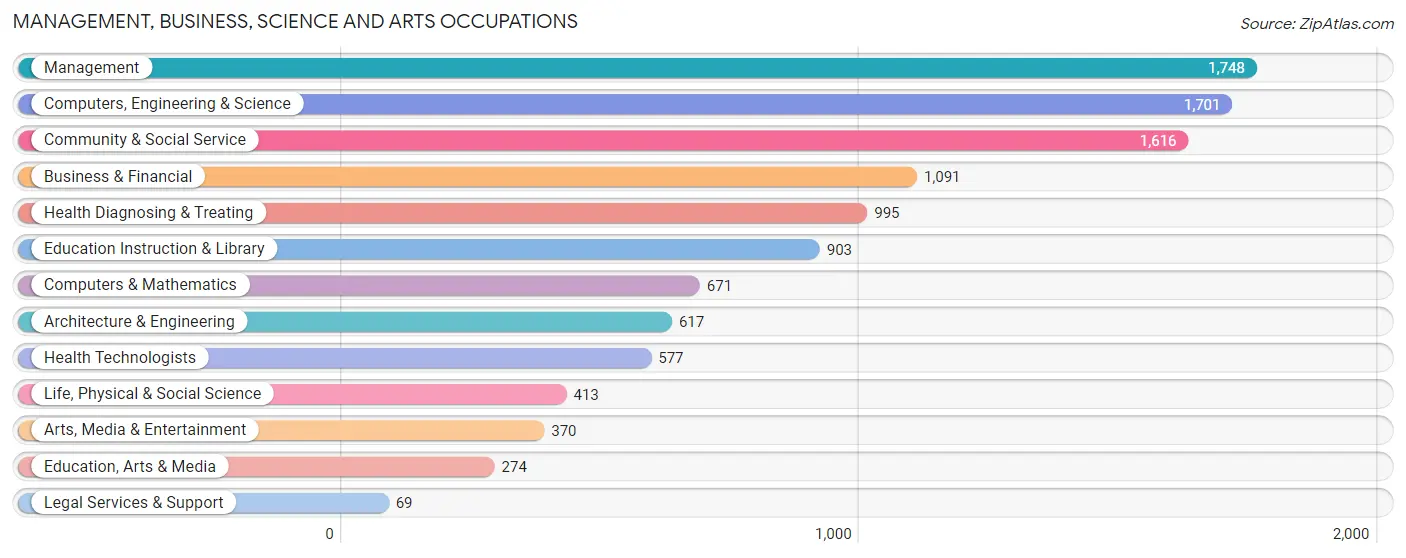
Management, Business, Science and Arts Occupations
The most common Management, Business, Science and Arts occupations in Bremerton are Management (1,748 | 9.1%), Computers, Engineering & Science (1,701 | 8.8%), Community & Social Service (1,616 | 8.4%), Business & Financial (1,091 | 5.7%), and Health Diagnosing & Treating (995 | 5.2%).
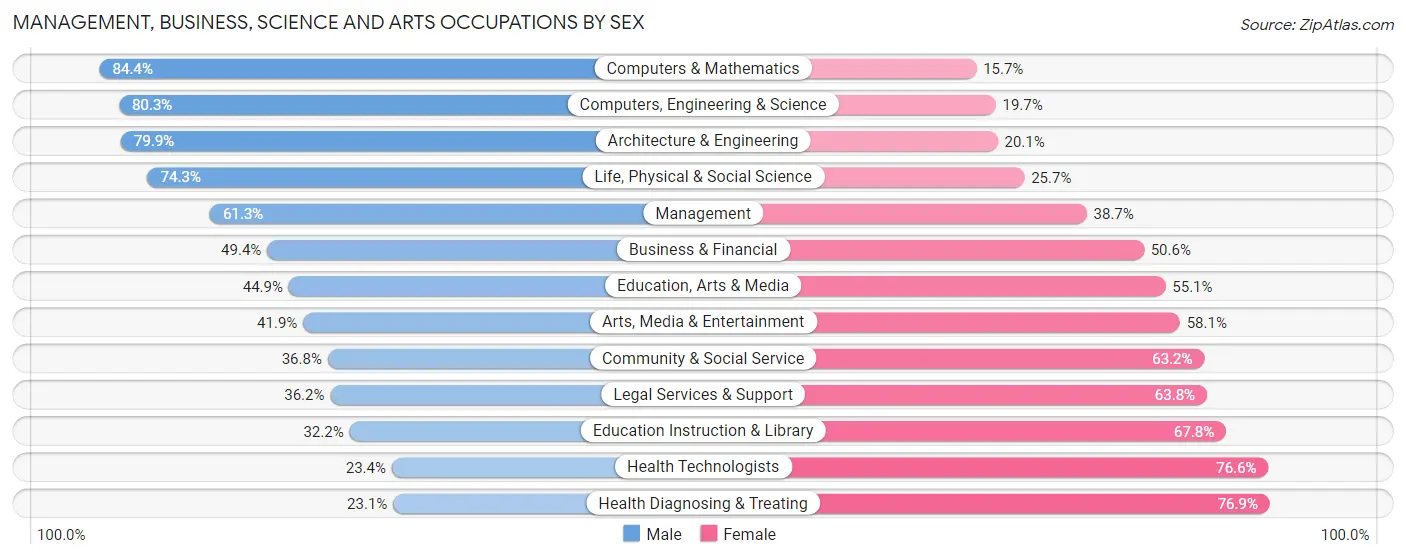
Management, Business, Science and Arts Occupations by Sex
Within the Management, Business, Science and Arts occupations in Bremerton, the most male-oriented occupations are Computers & Mathematics (84.4%), Computers, Engineering & Science (80.3%), and Architecture & Engineering (79.9%), while the most female-oriented occupations are Health Diagnosing & Treating (76.9%), Health Technologists (76.6%), and Education Instruction & Library (67.8%).
| Occupation | Male | Female |
| Management | 1,072 (61.3%) | 676 (38.7%) |
| Business & Financial | 539 (49.4%) | 552 (50.6%) |
| Computers, Engineering & Science | 1,366 (80.3%) | 335 (19.7%) |
| Computers & Mathematics | 566 (84.4%) | 105 (15.7%) |
| Architecture & Engineering | 493 (79.9%) | 124 (20.1%) |
| Life, Physical & Social Science | 307 (74.3%) | 106 (25.7%) |
| Community & Social Service | 594 (36.8%) | 1,022 (63.2%) |
| Education, Arts & Media | 123 (44.9%) | 151 (55.1%) |
| Legal Services & Support | 25 (36.2%) | 44 (63.8%) |
| Education Instruction & Library | 291 (32.2%) | 612 (67.8%) |
| Arts, Media & Entertainment | 155 (41.9%) | 215 (58.1%) |
| Health Diagnosing & Treating | 230 (23.1%) | 765 (76.9%) |
| Health Technologists | 135 (23.4%) | 442 (76.6%) |
| Total (Category) | 3,801 (53.1%) | 3,350 (46.9%) |
| Total (Overall) | 10,728 (55.7%) | 8,520 (44.3%) |
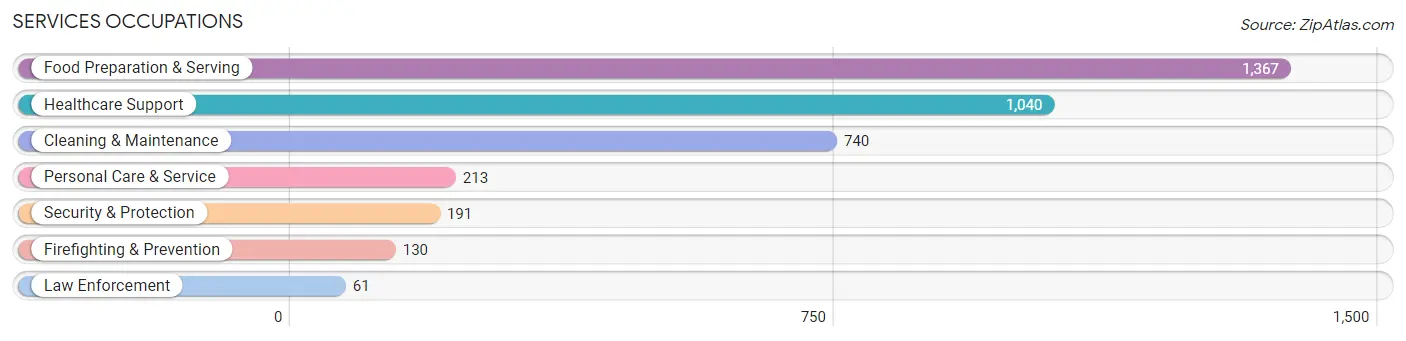
Services Occupations
The most common Services occupations in Bremerton are Food Preparation & Serving (1,367 | 7.1%), Healthcare Support (1,040 | 5.4%), Cleaning & Maintenance (740 | 3.8%), Personal Care & Service (213 | 1.1%), and Security & Protection (191 | 1.0%).
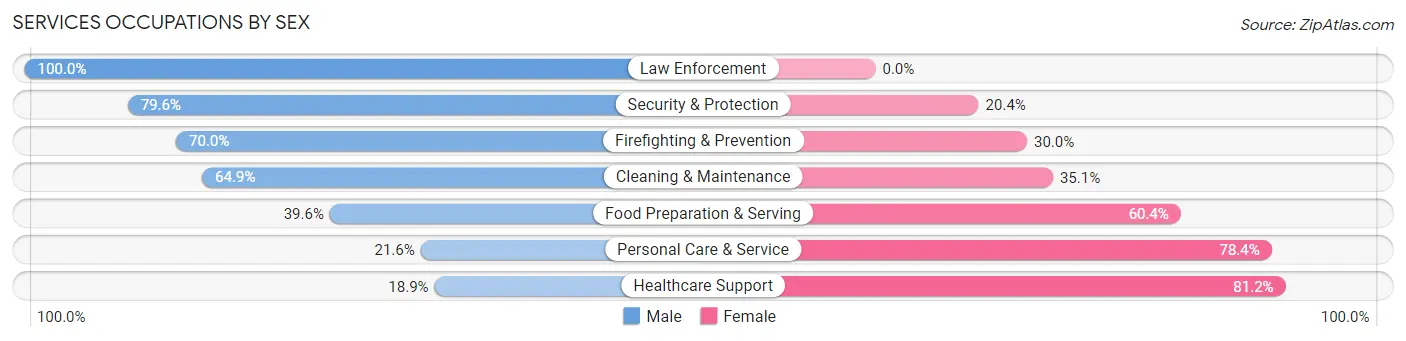
Services Occupations by Sex
Within the Services occupations in Bremerton, the most male-oriented occupations are Law Enforcement (100.0%), Security & Protection (79.6%), and Firefighting & Prevention (70.0%), while the most female-oriented occupations are Healthcare Support (81.1%), Personal Care & Service (78.4%), and Food Preparation & Serving (60.4%).
| Occupation | Male | Female |
| Healthcare Support | 196 (18.9%) | 844 (81.1%) |
| Security & Protection | 152 (79.6%) | 39 (20.4%) |
| Firefighting & Prevention | 91 (70.0%) | 39 (30.0%) |
| Law Enforcement | 61 (100.0%) | 0 (0.0%) |
| Food Preparation & Serving | 541 (39.6%) | 826 (60.4%) |
| Cleaning & Maintenance | 480 (64.9%) | 260 (35.1%) |
| Personal Care & Service | 46 (21.6%) | 167 (78.4%) |
| Total (Category) | 1,415 (39.9%) | 2,136 (60.2%) |
| Total (Overall) | 10,728 (55.7%) | 8,520 (44.3%) |
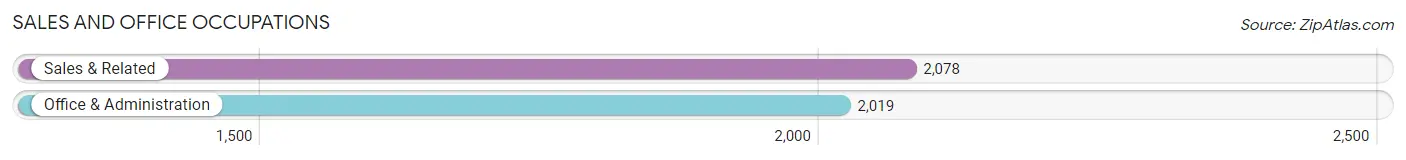
Sales and Office Occupations
The most common Sales and Office occupations in Bremerton are Sales & Related (2,078 | 10.8%), and Office & Administration (2,019 | 10.5%).
Sales and Office Occupations by Sex
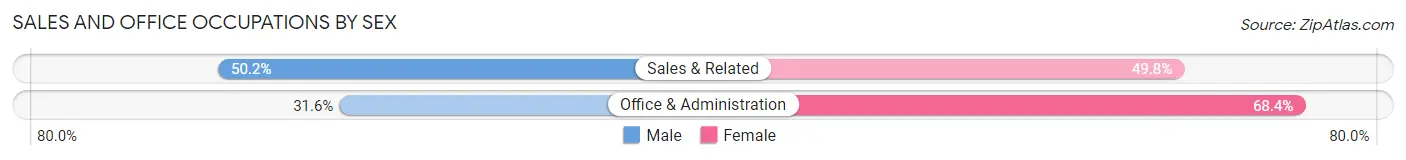
| Occupation | Male | Female |
| Sales & Related | 1,044 (50.2%) | 1,034 (49.8%) |
| Office & Administration | 638 (31.6%) | 1,381 (68.4%) |
| Total (Category) | 1,682 (41.0%) | 2,415 (59.0%) |
| Total (Overall) | 10,728 (55.7%) | 8,520 (44.3%) |
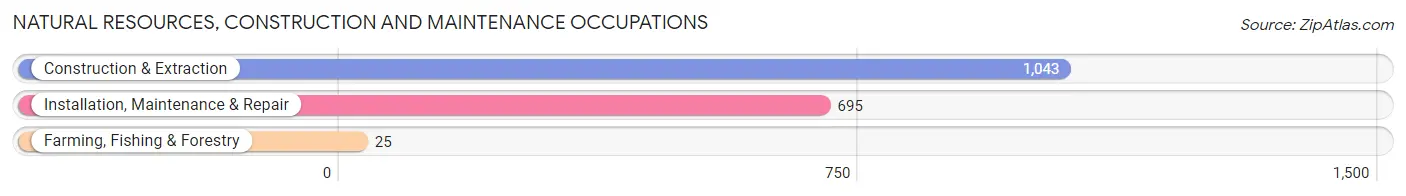
Natural Resources, Construction and Maintenance Occupations
The most common Natural Resources, Construction and Maintenance occupations in Bremerton are Construction & Extraction (1,043 | 5.4%), Installation, Maintenance & Repair (695 | 3.6%), and Farming, Fishing & Forestry (25 | 0.1%).
Natural Resources, Construction and Maintenance Occupations by Sex
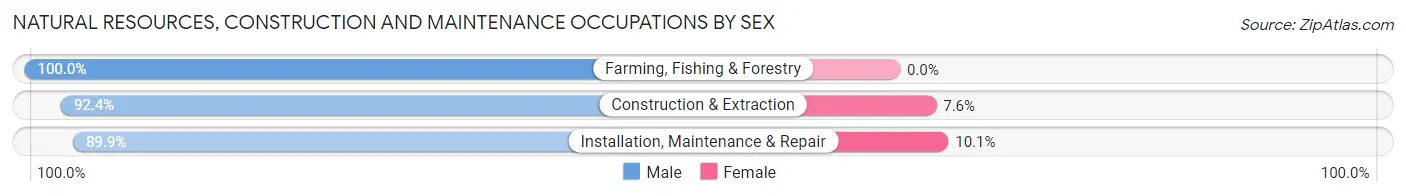
| Occupation | Male | Female |
| Farming, Fishing & Forestry | 25 (100.0%) | 0 (0.0%) |
| Construction & Extraction | 964 (92.4%) | 79 (7.6%) |
| Installation, Maintenance & Repair | 625 (89.9%) | 70 (10.1%) |
| Total (Category) | 1,614 (91.5%) | 149 (8.5%) |
| Total (Overall) | 10,728 (55.7%) | 8,520 (44.3%) |
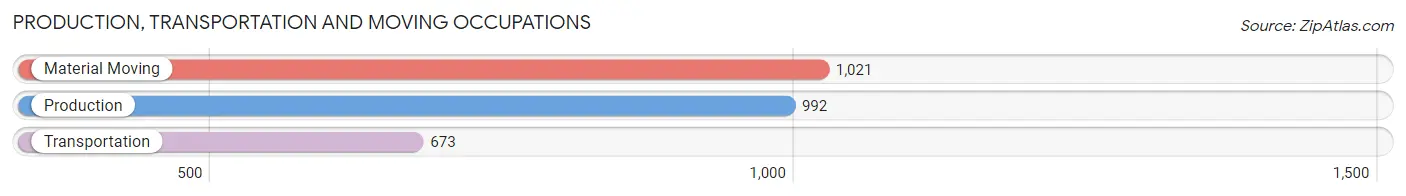
Production, Transportation and Moving Occupations
The most common Production, Transportation and Moving occupations in Bremerton are Material Moving (1,021 | 5.3%), Production (992 | 5.1%), and Transportation (673 | 3.5%).
Production, Transportation and Moving Occupations by Sex
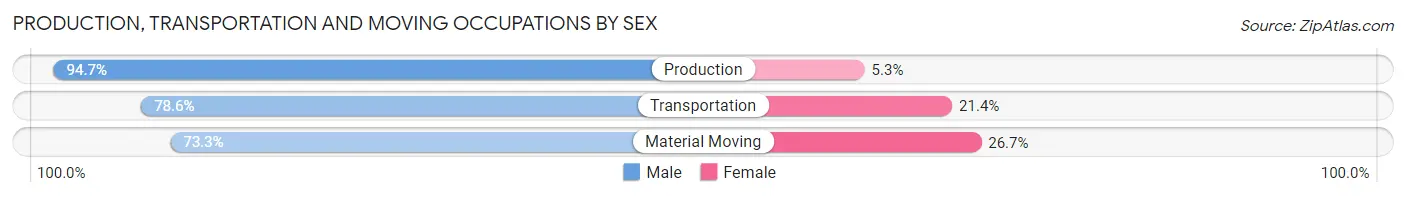
| Occupation | Male | Female |
| Production | 939 (94.7%) | 53 (5.3%) |
| Transportation | 529 (78.6%) | 144 (21.4%) |
| Material Moving | 748 (73.3%) | 273 (26.7%) |
| Total (Category) | 2,216 (82.5%) | 470 (17.5%) |
| Total (Overall) | 10,728 (55.7%) | 8,520 (44.3%) |
Employment Industries by Sex in Bremerton
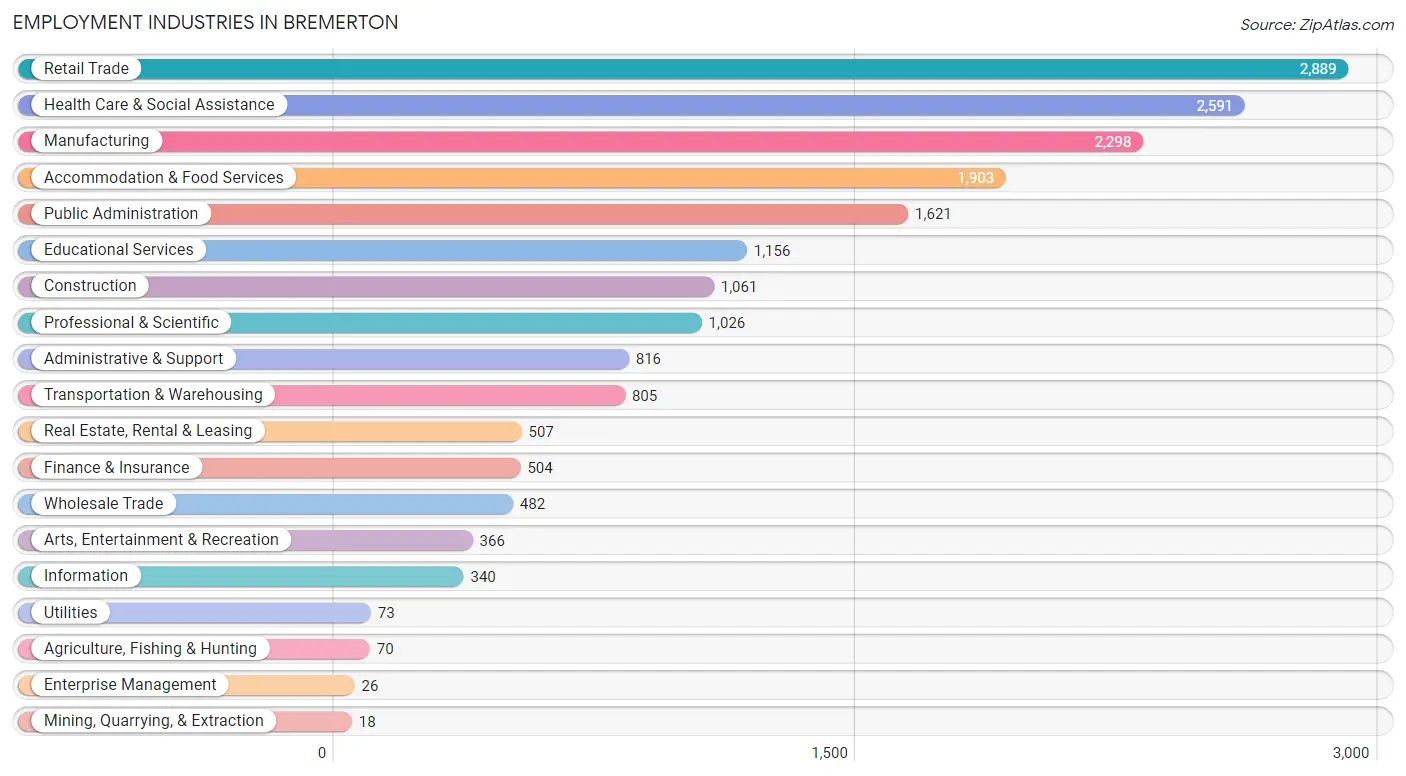
Employment Industries in Bremerton
The major employment industries in Bremerton include Retail Trade (2,889 | 15.0%), Health Care & Social Assistance (2,591 | 13.5%), Manufacturing (2,298 | 11.9%), Accommodation & Food Services (1,903 | 9.9%), and Public Administration (1,621 | 8.4%).
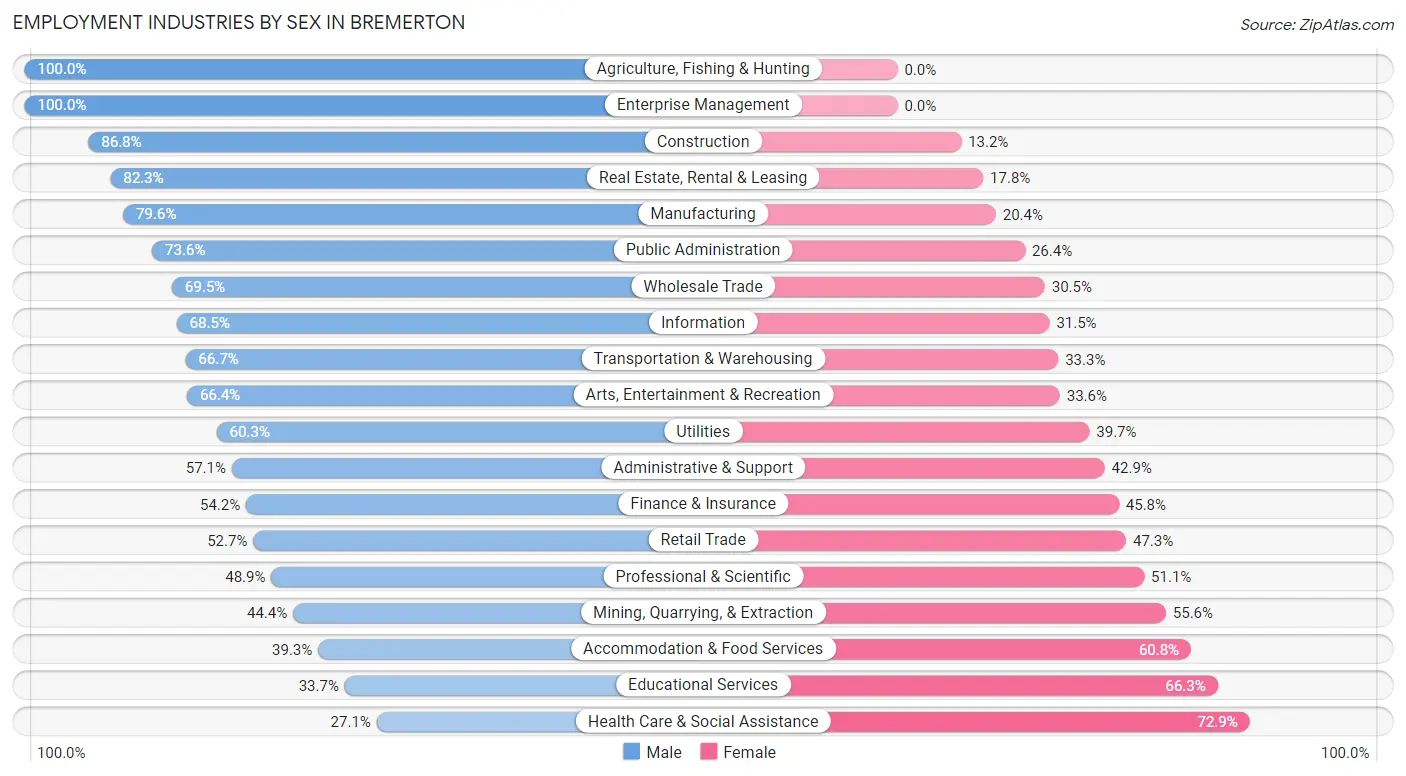
Employment Industries by Sex in Bremerton
The Bremerton industries that see more men than women are Agriculture, Fishing & Hunting (100.0%), Enterprise Management (100.0%), and Construction (86.8%), whereas the industries that tend to have a higher number of women are Health Care & Social Assistance (72.9%), Educational Services (66.3%), and Accommodation & Food Services (60.8%).
| Industry | Male | Female |
| Agriculture, Fishing & Hunting | 70 (100.0%) | 0 (0.0%) |
| Mining, Quarrying, & Extraction | 8 (44.4%) | 10 (55.6%) |
| Construction | 921 (86.8%) | 140 (13.2%) |
| Manufacturing | 1,830 (79.6%) | 468 (20.4%) |
| Wholesale Trade | 335 (69.5%) | 147 (30.5%) |
| Retail Trade | 1,522 (52.7%) | 1,367 (47.3%) |
| Transportation & Warehousing | 537 (66.7%) | 268 (33.3%) |
| Utilities | 44 (60.3%) | 29 (39.7%) |
| Information | 233 (68.5%) | 107 (31.5%) |
| Finance & Insurance | 273 (54.2%) | 231 (45.8%) |
| Real Estate, Rental & Leasing | 417 (82.3%) | 90 (17.7%) |
| Professional & Scientific | 502 (48.9%) | 524 (51.1%) |
| Enterprise Management | 26 (100.0%) | 0 (0.0%) |
| Administrative & Support | 466 (57.1%) | 350 (42.9%) |
| Educational Services | 390 (33.7%) | 766 (66.3%) |
| Health Care & Social Assistance | 703 (27.1%) | 1,888 (72.9%) |
| Arts, Entertainment & Recreation | 243 (66.4%) | 123 (33.6%) |
| Accommodation & Food Services | 747 (39.3%) | 1,156 (60.8%) |
| Public Administration | 1,193 (73.6%) | 428 (26.4%) |
| Total | 10,728 (55.7%) | 8,520 (44.3%) |
Education in Bremerton
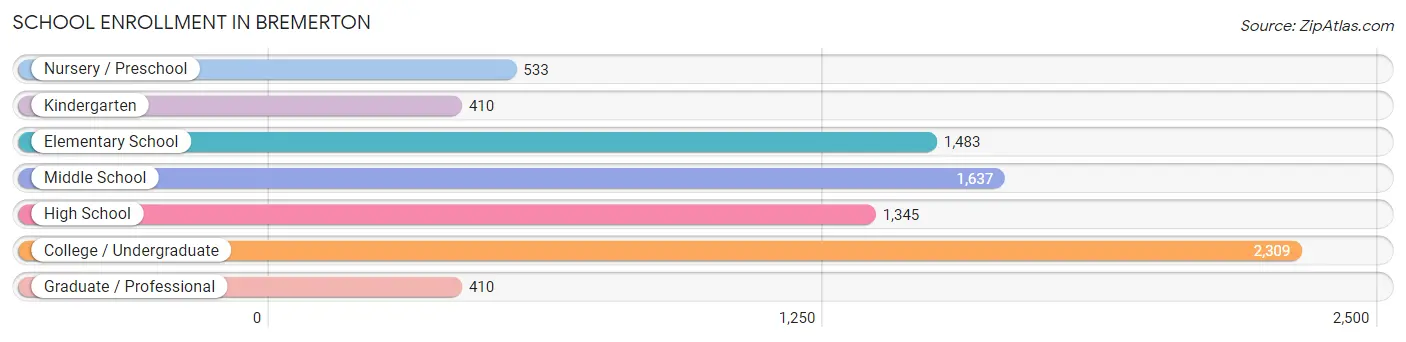
School Enrollment in Bremerton
The most common levels of schooling among the 8,127 students in Bremerton are college / undergraduate (2,309 | 28.4%), middle school (1,637 | 20.1%), and elementary school (1,483 | 18.2%).
| School Level | # Students | % Students |
| Nursery / Preschool | 533 | 6.6% |
| Kindergarten | 410 | 5.0% |
| Elementary School | 1,483 | 18.2% |
| Middle School | 1,637 | 20.1% |
| High School | 1,345 | 16.6% |
| College / Undergraduate | 2,309 | 28.4% |
| Graduate / Professional | 410 | 5.0% |
| Total | 8,127 | 100.0% |
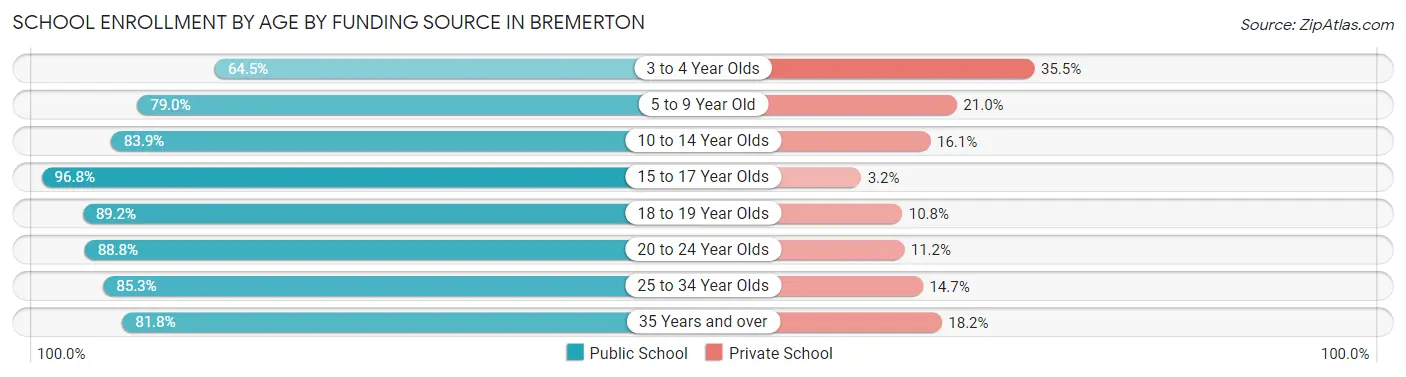
School Enrollment by Age by Funding Source in Bremerton
Out of a total of 8,127 students who are enrolled in schools in Bremerton, 1,292 (15.9%) attend a private institution, while the remaining 6,835 (84.1%) are enrolled in public schools. The age group of 3 to 4 year olds has the highest likelihood of being enrolled in private schools, with 150 (35.5% in the age bracket) enrolled. Conversely, the age group of 15 to 17 year olds has the lowest likelihood of being enrolled in a private school, with 883 (96.8% in the age bracket) attending a public institution.
| Age Bracket | Public School | Private School |
| 3 to 4 Year Olds | 273 (64.5%) | 150 (35.5%) |
| 5 to 9 Year Old | 1,501 (79.0%) | 399 (21.0%) |
| 10 to 14 Year Olds | 1,519 (83.9%) | 291 (16.1%) |
| 15 to 17 Year Olds | 883 (96.8%) | 29 (3.2%) |
| 18 to 19 Year Olds | 354 (89.2%) | 43 (10.8%) |
| 20 to 24 Year Olds | 848 (88.8%) | 107 (11.2%) |
| 25 to 34 Year Olds | 1,040 (85.3%) | 179 (14.7%) |
| 35 Years and over | 418 (81.8%) | 93 (18.2%) |
| Total | 6,835 (84.1%) | 1,292 (15.9%) |
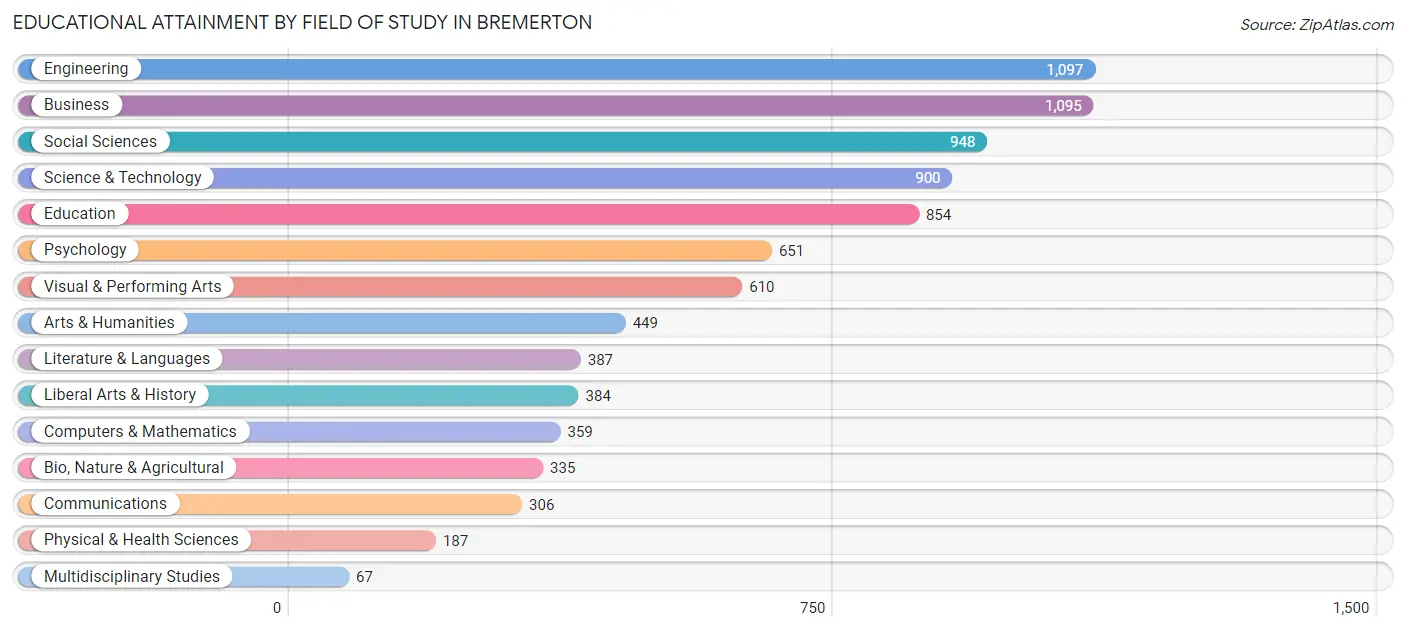
Educational Attainment by Field of Study in Bremerton
Engineering (1,097 | 12.7%), business (1,095 | 12.7%), social sciences (948 | 11.0%), science & technology (900 | 10.4%), and education (854 | 9.9%) are the most common fields of study among 8,629 individuals in Bremerton who have obtained a bachelor's degree or higher.
| Field of Study | # Graduates | % Graduates |
| Computers & Mathematics | 359 | 4.2% |
| Bio, Nature & Agricultural | 335 | 3.9% |
| Physical & Health Sciences | 187 | 2.2% |
| Psychology | 651 | 7.5% |
| Social Sciences | 948 | 11.0% |
| Engineering | 1,097 | 12.7% |
| Multidisciplinary Studies | 67 | 0.8% |
| Science & Technology | 900 | 10.4% |
| Business | 1,095 | 12.7% |
| Education | 854 | 9.9% |
| Literature & Languages | 387 | 4.5% |
| Liberal Arts & History | 384 | 4.4% |
| Visual & Performing Arts | 610 | 7.1% |
| Communications | 306 | 3.5% |
| Arts & Humanities | 449 | 5.2% |
| Total | 8,629 | 100.0% |
Transportation & Commute in Bremerton
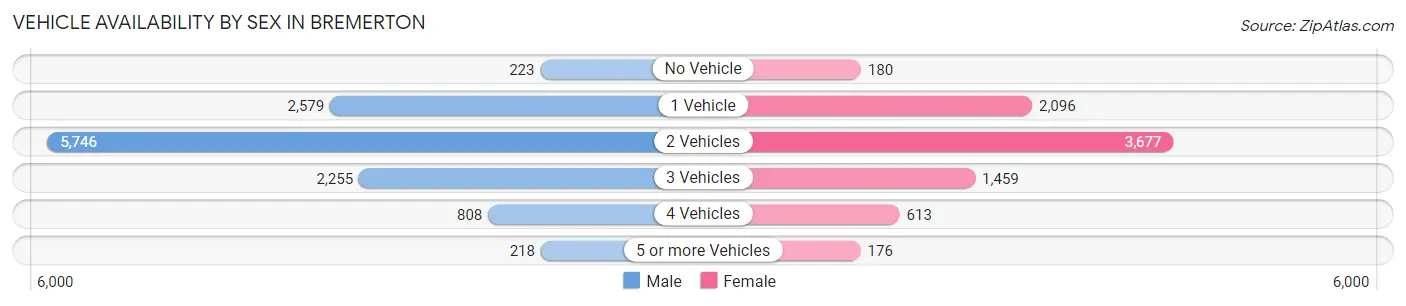
Vehicle Availability by Sex in Bremerton
The most prevalent vehicle ownership categories in Bremerton are males with 2 vehicles (5,746, accounting for 48.6%) and females with 2 vehicles (3,677, making up 70.1%).
| Vehicles Available | Male | Female |
| No Vehicle | 223 (1.9%) | 180 (2.2%) |
| 1 Vehicle | 2,579 (21.8%) | 2,096 (25.6%) |
| 2 Vehicles | 5,746 (48.6%) | 3,677 (44.8%) |
| 3 Vehicles | 2,255 (19.1%) | 1,459 (17.8%) |
| 4 Vehicles | 808 (6.8%) | 613 (7.5%) |
| 5 or more Vehicles | 218 (1.8%) | 176 (2.1%) |
| Total | 11,829 (100.0%) | 8,201 (100.0%) |
Commute Time in Bremerton
The most frequently occuring commute durations in Bremerton are 15 to 19 minutes (4,444 commuters, 20.8%), 20 to 24 minutes (3,521 commuters, 16.5%), and 10 to 14 minutes (3,359 commuters, 15.7%).
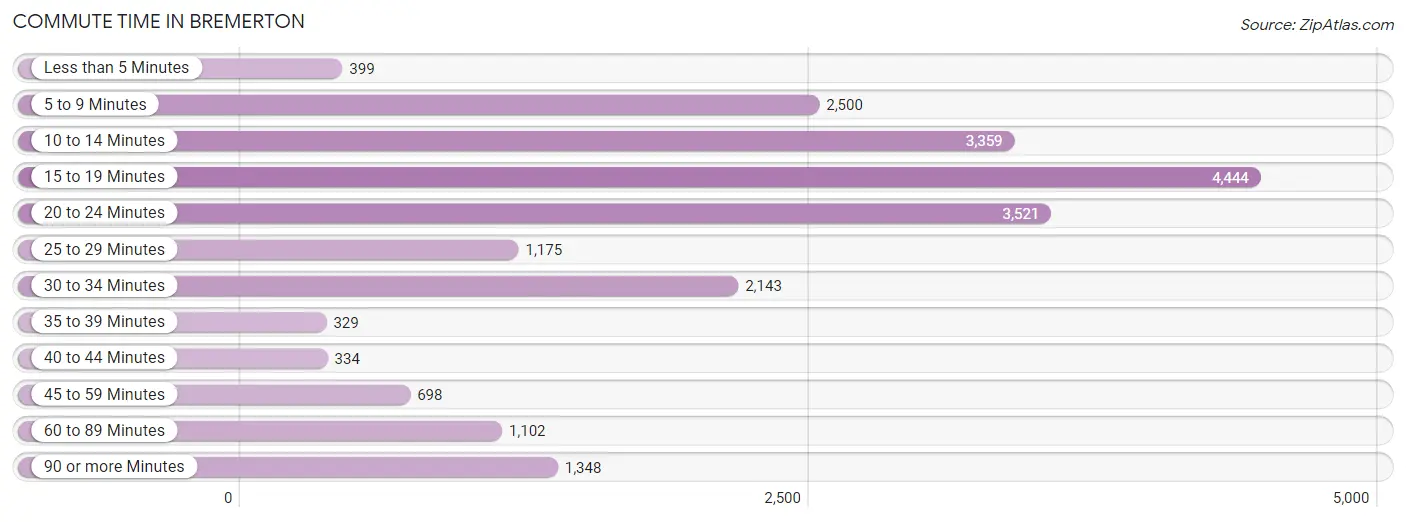
| Commute Time | # Commuters | % Commuters |
| Less than 5 Minutes | 399 | 1.9% |
| 5 to 9 Minutes | 2,500 | 11.7% |
| 10 to 14 Minutes | 3,359 | 15.7% |
| 15 to 19 Minutes | 4,444 | 20.8% |
| 20 to 24 Minutes | 3,521 | 16.5% |
| 25 to 29 Minutes | 1,175 | 5.5% |
| 30 to 34 Minutes | 2,143 | 10.0% |
| 35 to 39 Minutes | 329 | 1.5% |
| 40 to 44 Minutes | 334 | 1.6% |
| 45 to 59 Minutes | 698 | 3.3% |
| 60 to 89 Minutes | 1,102 | 5.2% |
| 90 or more Minutes | 1,348 | 6.3% |
Commute Time by Sex in Bremerton
The most common commute times in Bremerton are 15 to 19 minutes (2,875 commuters, 21.6%) for males and 15 to 19 minutes (1,569 commuters, 19.5%) for females.
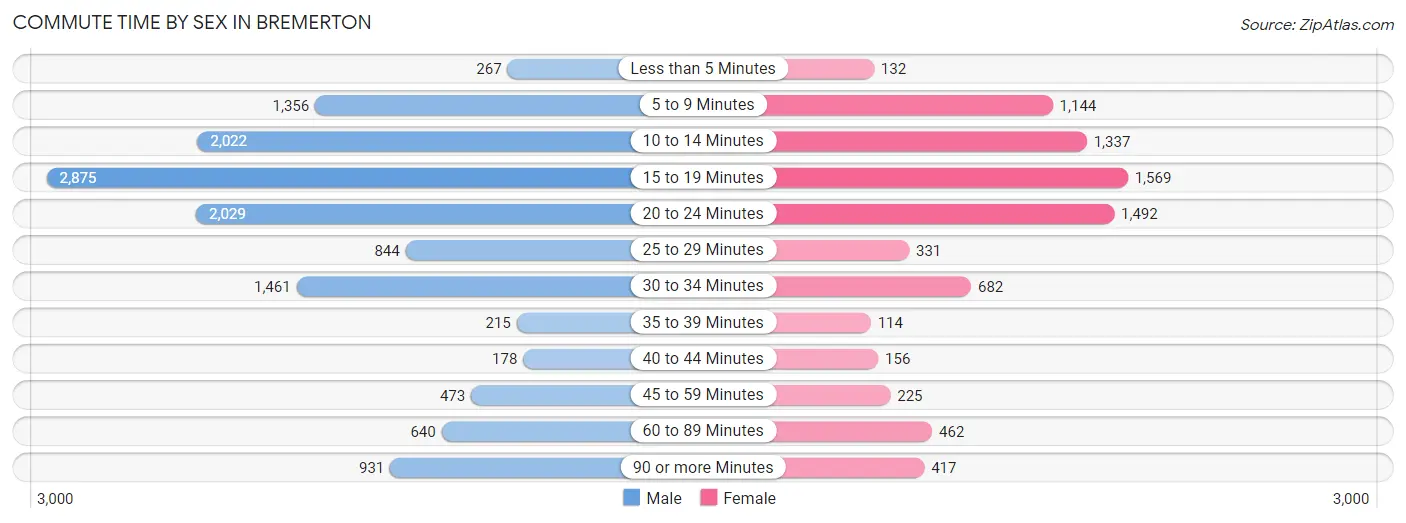
| Commute Time | Male | Female |
| Less than 5 Minutes | 267 (2.0%) | 132 (1.6%) |
| 5 to 9 Minutes | 1,356 (10.2%) | 1,144 (14.2%) |
| 10 to 14 Minutes | 2,022 (15.2%) | 1,337 (16.6%) |
| 15 to 19 Minutes | 2,875 (21.6%) | 1,569 (19.5%) |
| 20 to 24 Minutes | 2,029 (15.3%) | 1,492 (18.5%) |
| 25 to 29 Minutes | 844 (6.4%) | 331 (4.1%) |
| 30 to 34 Minutes | 1,461 (11.0%) | 682 (8.5%) |
| 35 to 39 Minutes | 215 (1.6%) | 114 (1.4%) |
| 40 to 44 Minutes | 178 (1.3%) | 156 (1.9%) |
| 45 to 59 Minutes | 473 (3.6%) | 225 (2.8%) |
| 60 to 89 Minutes | 640 (4.8%) | 462 (5.7%) |
| 90 or more Minutes | 931 (7.0%) | 417 (5.2%) |
Time of Departure to Work by Sex in Bremerton
The most frequent times of departure to work in Bremerton are 6:30 AM to 6:59 AM (1,806, 13.6%) for males and 7:30 AM to 7:59 AM (930, 11.5%) for females.
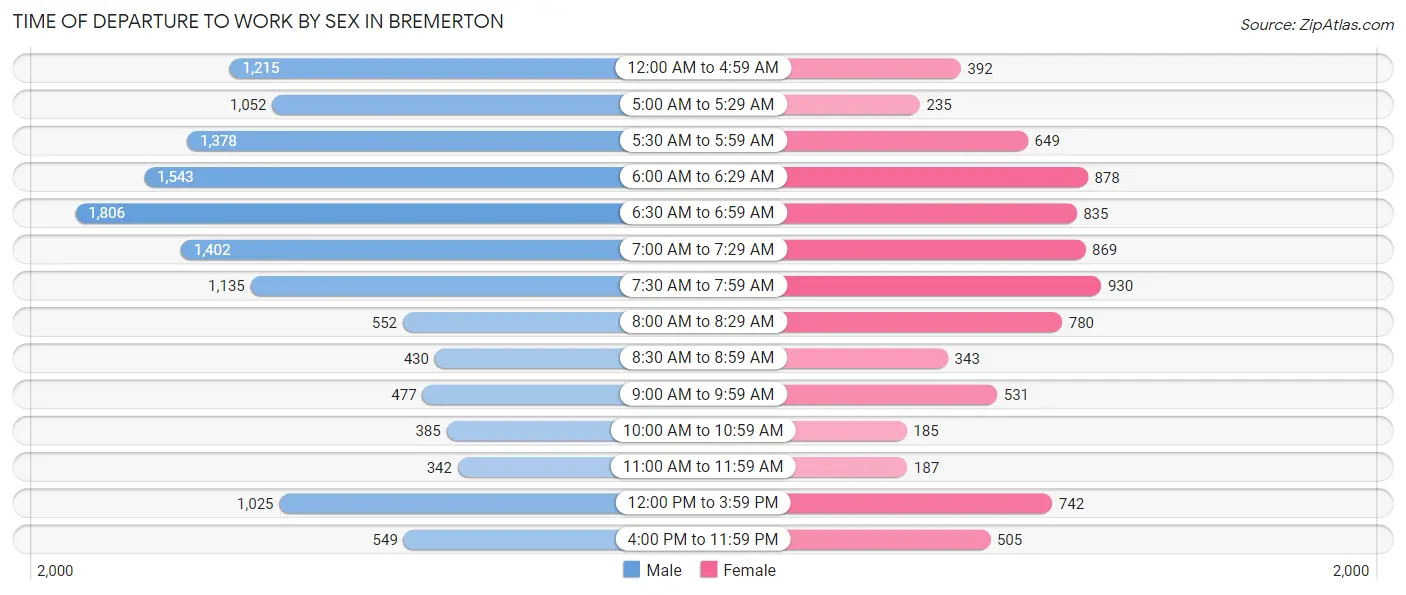
| Time of Departure | Male | Female |
| 12:00 AM to 4:59 AM | 1,215 (9.1%) | 392 (4.9%) |
| 5:00 AM to 5:29 AM | 1,052 (7.9%) | 235 (2.9%) |
| 5:30 AM to 5:59 AM | 1,378 (10.4%) | 649 (8.1%) |
| 6:00 AM to 6:29 AM | 1,543 (11.6%) | 878 (10.9%) |
| 6:30 AM to 6:59 AM | 1,806 (13.6%) | 835 (10.4%) |
| 7:00 AM to 7:29 AM | 1,402 (10.5%) | 869 (10.8%) |
| 7:30 AM to 7:59 AM | 1,135 (8.5%) | 930 (11.5%) |
| 8:00 AM to 8:29 AM | 552 (4.2%) | 780 (9.7%) |
| 8:30 AM to 8:59 AM | 430 (3.2%) | 343 (4.3%) |
| 9:00 AM to 9:59 AM | 477 (3.6%) | 531 (6.6%) |
| 10:00 AM to 10:59 AM | 385 (2.9%) | 185 (2.3%) |
| 11:00 AM to 11:59 AM | 342 (2.6%) | 187 (2.3%) |
| 12:00 PM to 3:59 PM | 1,025 (7.7%) | 742 (9.2%) |
| 4:00 PM to 11:59 PM | 549 (4.1%) | 505 (6.3%) |
| Total | 13,291 (100.0%) | 8,061 (100.0%) |
Housing Occupancy in Bremerton
Occupancy by Ownership in Bremerton
Of the total 17,740 dwellings in Bremerton, owner-occupied units account for 8,260 (46.6%), while renter-occupied units make up 9,480 (53.4%).
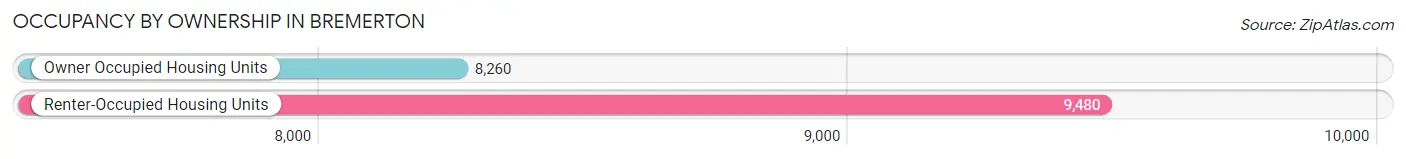
| Occupancy | # Housing Units | % Housing Units |
| Owner Occupied Housing Units | 8,260 | 46.6% |
| Renter-Occupied Housing Units | 9,480 | 53.4% |
| Total Occupied Housing Units | 17,740 | 100.0% |
Occupancy by Household Size in Bremerton
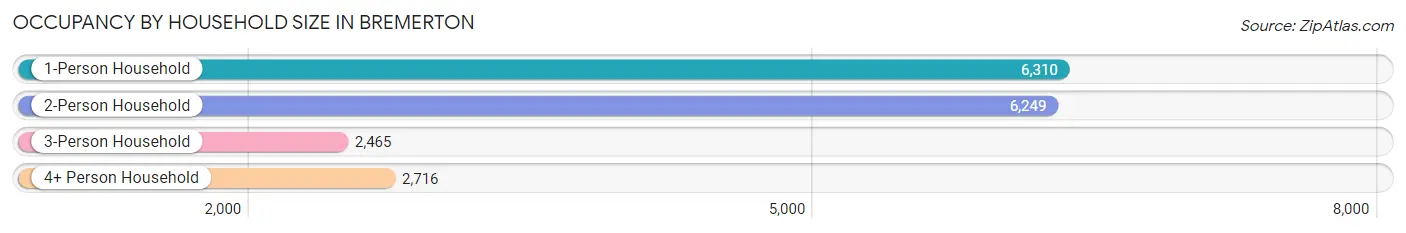
| Household Size | # Housing Units | % Housing Units |
| 1-Person Household | 6,310 | 35.6% |
| 2-Person Household | 6,249 | 35.2% |
| 3-Person Household | 2,465 | 13.9% |
| 4+ Person Household | 2,716 | 15.3% |
| Total Housing Units | 17,740 | 100.0% |
Occupancy by Ownership by Household Size in Bremerton
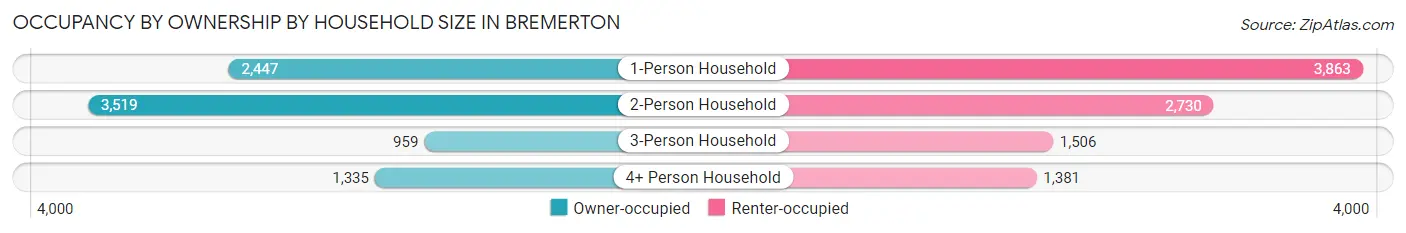
| Household Size | Owner-occupied | Renter-occupied |
| 1-Person Household | 2,447 (38.8%) | 3,863 (61.2%) |
| 2-Person Household | 3,519 (56.3%) | 2,730 (43.7%) |
| 3-Person Household | 959 (38.9%) | 1,506 (61.1%) |
| 4+ Person Household | 1,335 (49.1%) | 1,381 (50.8%) |
| Total Housing Units | 8,260 (46.6%) | 9,480 (53.4%) |
Occupancy by Educational Attainment in Bremerton
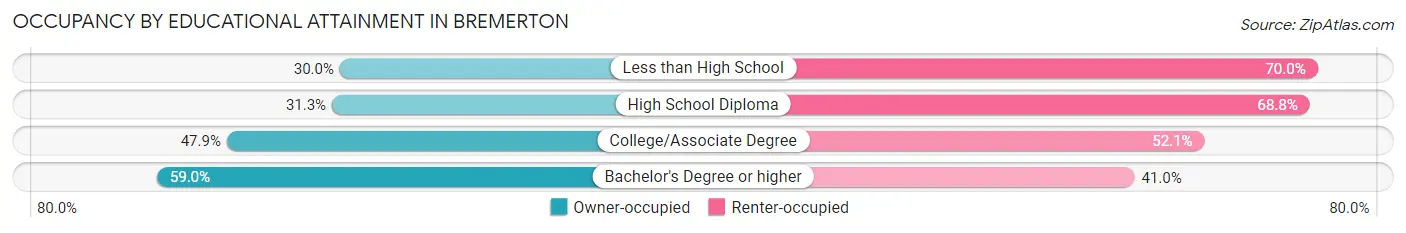
| Household Size | Owner-occupied | Renter-occupied |
| Less than High School | 253 (30.0%) | 590 (70.0%) |
| High School Diploma | 1,176 (31.2%) | 2,587 (68.8%) |
| College/Associate Degree | 3,984 (47.9%) | 4,326 (52.1%) |
| Bachelor's Degree or higher | 2,847 (59.0%) | 1,977 (41.0%) |
Occupancy by Age of Householder in Bremerton
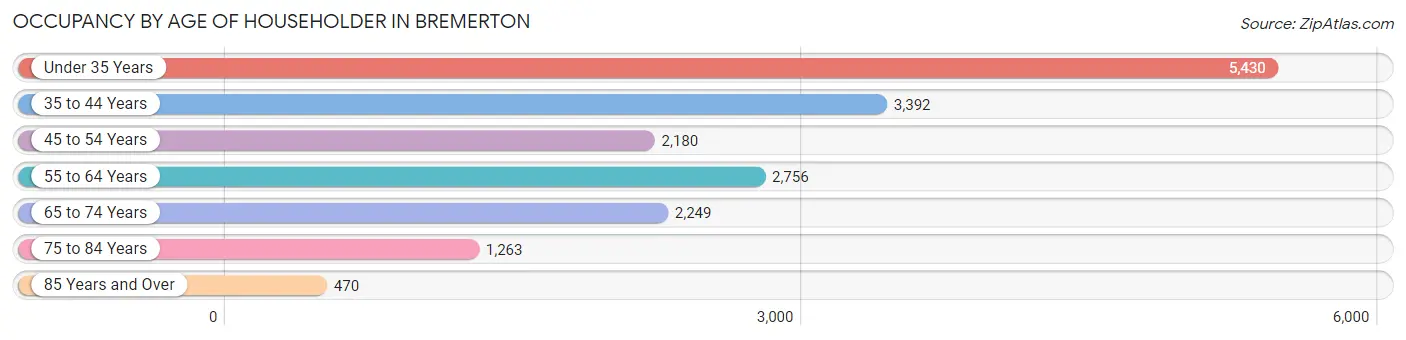
| Age Bracket | # Households | % Households |
| Under 35 Years | 5,430 | 30.6% |
| 35 to 44 Years | 3,392 | 19.1% |
| 45 to 54 Years | 2,180 | 12.3% |
| 55 to 64 Years | 2,756 | 15.5% |
| 65 to 74 Years | 2,249 | 12.7% |
| 75 to 84 Years | 1,263 | 7.1% |
| 85 Years and Over | 470 | 2.6% |
| Total | 17,740 | 100.0% |
Housing Finances in Bremerton
Median Income by Occupancy in Bremerton
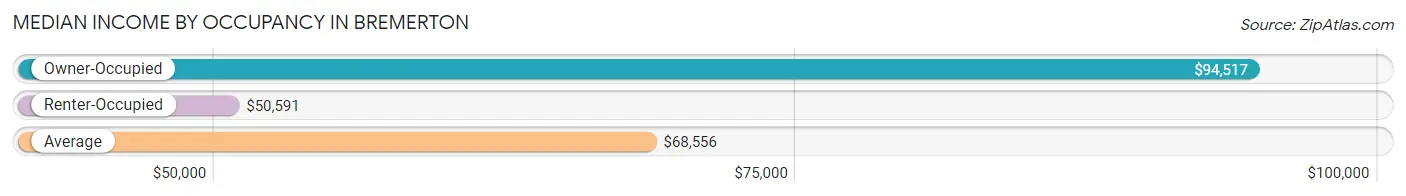
| Occupancy Type | # Households | Median Income |
| Owner-Occupied | 8,260 (46.6%) | $94,517 |
| Renter-Occupied | 9,480 (53.4%) | $50,591 |
| Average | 17,740 (100.0%) | $68,556 |
Occupancy by Householder Income Bracket in Bremerton
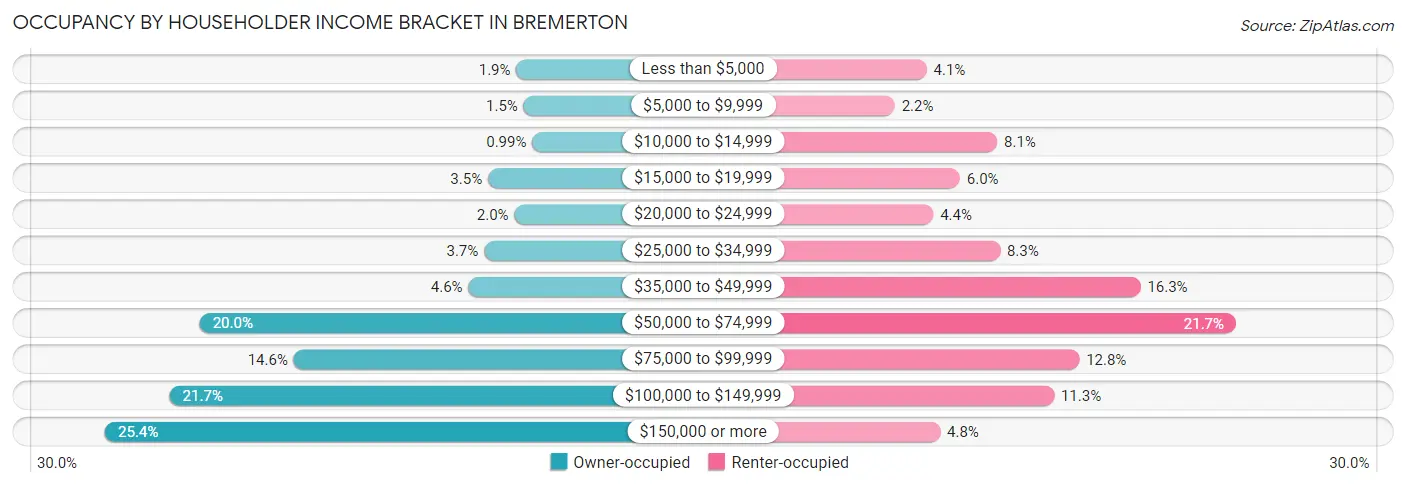
| Income Bracket | Owner-occupied | Renter-occupied |
| Less than $5,000 | 157 (1.9%) | 385 (4.1%) |
| $5,000 to $9,999 | 122 (1.5%) | 212 (2.2%) |
| $10,000 to $14,999 | 82 (1.0%) | 767 (8.1%) |
| $15,000 to $19,999 | 291 (3.5%) | 565 (6.0%) |
| $20,000 to $24,999 | 166 (2.0%) | 421 (4.4%) |
| $25,000 to $34,999 | 309 (3.7%) | 782 (8.3%) |
| $35,000 to $49,999 | 383 (4.6%) | 1,543 (16.3%) |
| $50,000 to $74,999 | 1,651 (20.0%) | 2,060 (21.7%) |
| $75,000 to $99,999 | 1,208 (14.6%) | 1,212 (12.8%) |
| $100,000 to $149,999 | 1,793 (21.7%) | 1,075 (11.3%) |
| $150,000 or more | 2,098 (25.4%) | 458 (4.8%) |
| Total | 8,260 (100.0%) | 9,480 (100.0%) |
Monthly Housing Cost Tiers in Bremerton
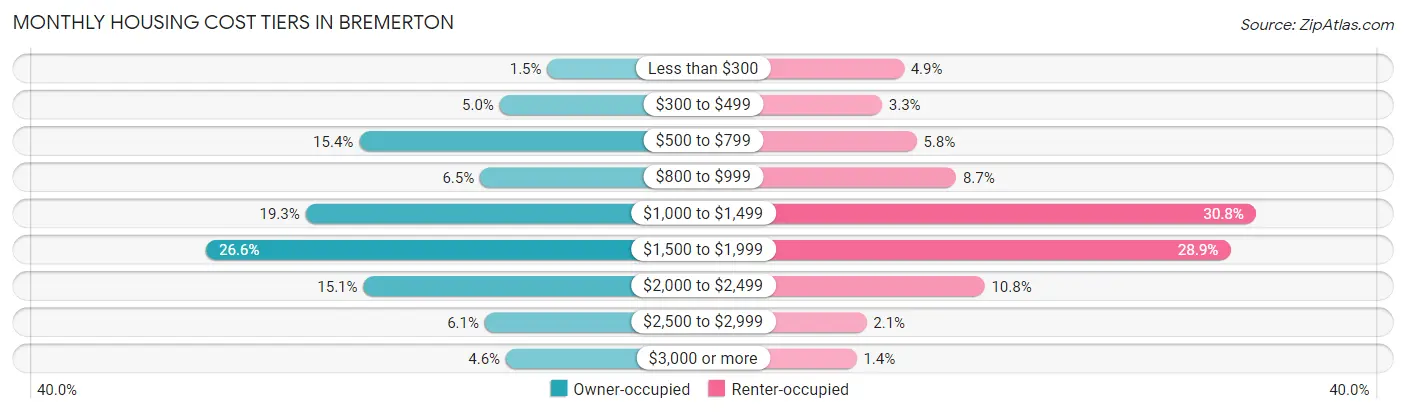
| Monthly Cost | Owner-occupied | Renter-occupied |
| Less than $300 | 124 (1.5%) | 463 (4.9%) |
| $300 to $499 | 414 (5.0%) | 310 (3.3%) |
| $500 to $799 | 1,269 (15.4%) | 552 (5.8%) |
| $800 to $999 | 534 (6.5%) | 828 (8.7%) |
| $1,000 to $1,499 | 1,595 (19.3%) | 2,920 (30.8%) |
| $1,500 to $1,999 | 2,200 (26.6%) | 2,742 (28.9%) |
| $2,000 to $2,499 | 1,243 (15.0%) | 1,027 (10.8%) |
| $2,500 to $2,999 | 505 (6.1%) | 202 (2.1%) |
| $3,000 or more | 376 (4.5%) | 133 (1.4%) |
| Total | 8,260 (100.0%) | 9,480 (100.0%) |
Physical Housing Characteristics in Bremerton
Housing Structures in Bremerton
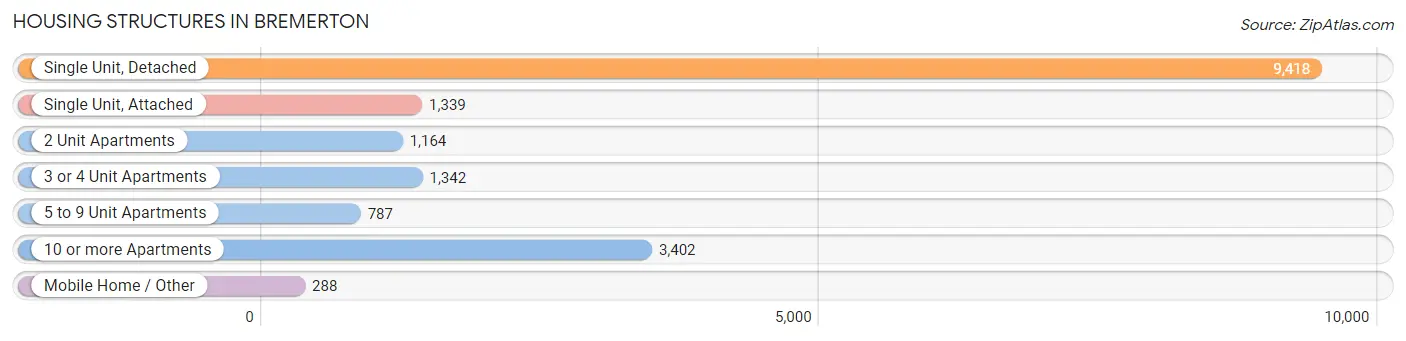
| Structure Type | # Housing Units | % Housing Units |
| Single Unit, Detached | 9,418 | 53.1% |
| Single Unit, Attached | 1,339 | 7.5% |
| 2 Unit Apartments | 1,164 | 6.6% |
| 3 or 4 Unit Apartments | 1,342 | 7.6% |
| 5 to 9 Unit Apartments | 787 | 4.4% |
| 10 or more Apartments | 3,402 | 19.2% |
| Mobile Home / Other | 288 | 1.6% |
| Total | 17,740 | 100.0% |
Housing Structures by Occupancy in Bremerton
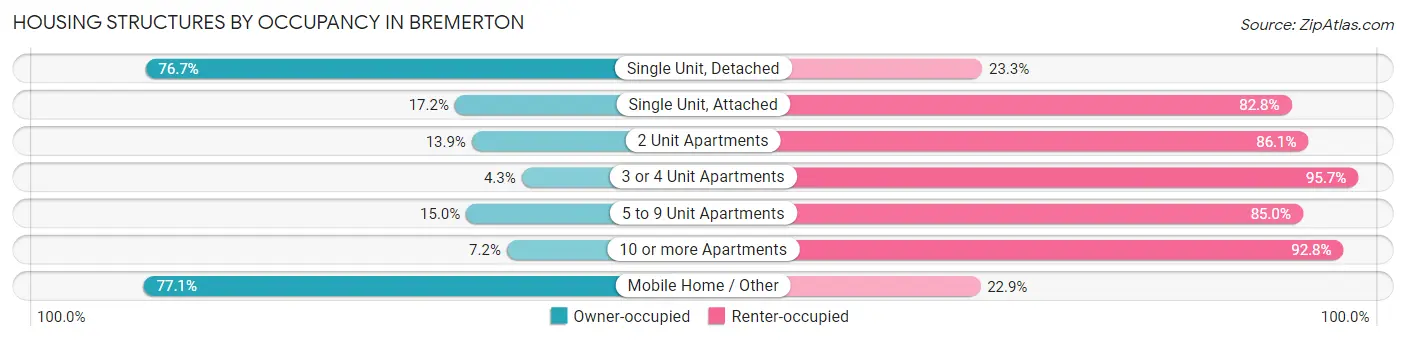
| Structure Type | Owner-occupied | Renter-occupied |
| Single Unit, Detached | 7,226 (76.7%) | 2,192 (23.3%) |
| Single Unit, Attached | 230 (17.2%) | 1,109 (82.8%) |
| 2 Unit Apartments | 162 (13.9%) | 1,002 (86.1%) |
| 3 or 4 Unit Apartments | 58 (4.3%) | 1,284 (95.7%) |
| 5 to 9 Unit Apartments | 118 (15.0%) | 669 (85.0%) |
| 10 or more Apartments | 244 (7.2%) | 3,158 (92.8%) |
| Mobile Home / Other | 222 (77.1%) | 66 (22.9%) |
| Total | 8,260 (46.6%) | 9,480 (53.4%) |
Housing Structures by Number of Rooms in Bremerton
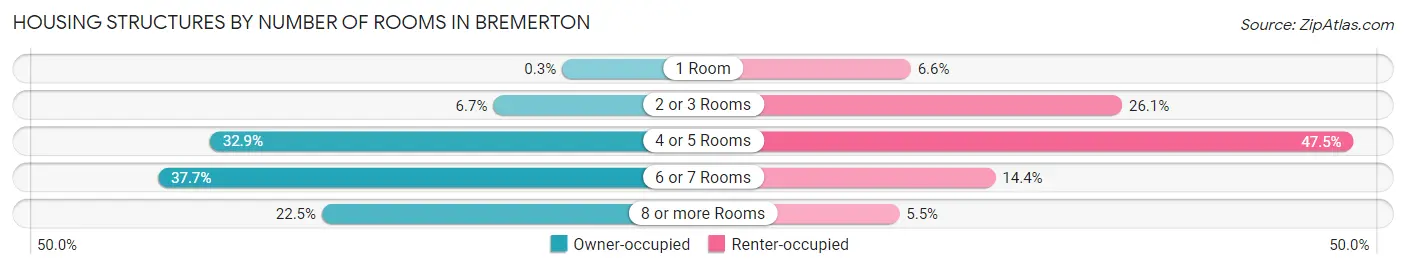
| Number of Rooms | Owner-occupied | Renter-occupied |
| 1 Room | 25 (0.3%) | 621 (6.6%) |
| 2 or 3 Rooms | 550 (6.7%) | 2,473 (26.1%) |
| 4 or 5 Rooms | 2,715 (32.9%) | 4,502 (47.5%) |
| 6 or 7 Rooms | 3,111 (37.7%) | 1,363 (14.4%) |
| 8 or more Rooms | 1,859 (22.5%) | 521 (5.5%) |
| Total | 8,260 (100.0%) | 9,480 (100.0%) |
Housing Structure by Heating Type in Bremerton
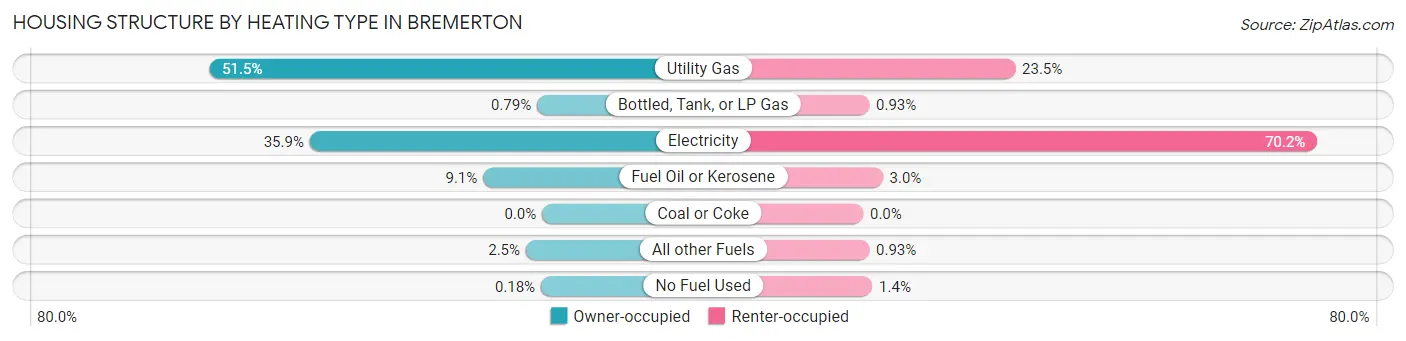
| Heating Type | Owner-occupied | Renter-occupied |
| Utility Gas | 4,253 (51.5%) | 2,229 (23.5%) |
| Bottled, Tank, or LP Gas | 65 (0.8%) | 88 (0.9%) |
| Electricity | 2,967 (35.9%) | 6,655 (70.2%) |
| Fuel Oil or Kerosene | 753 (9.1%) | 286 (3.0%) |
| Coal or Coke | 0 (0.0%) | 0 (0.0%) |
| All other Fuels | 207 (2.5%) | 88 (0.9%) |
| No Fuel Used | 15 (0.2%) | 134 (1.4%) |
| Total | 8,260 (100.0%) | 9,480 (100.0%) |
Household Vehicle Usage in Bremerton
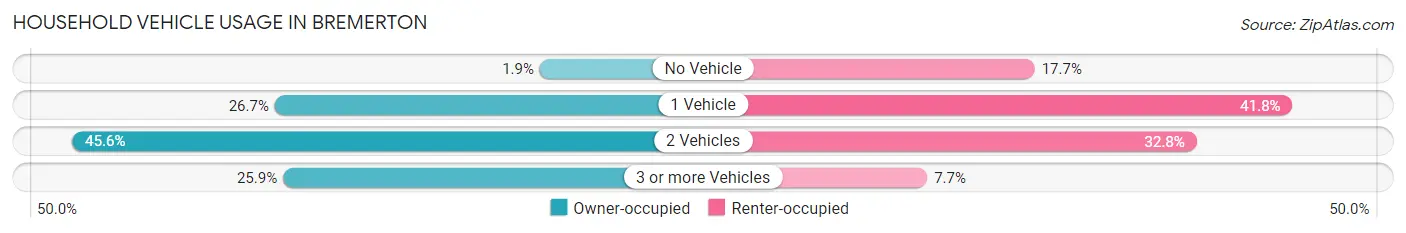
| Vehicles per Household | Owner-occupied | Renter-occupied |
| No Vehicle | 158 (1.9%) | 1,680 (17.7%) |
| 1 Vehicle | 2,201 (26.7%) | 3,960 (41.8%) |
| 2 Vehicles | 3,763 (45.6%) | 3,112 (32.8%) |
| 3 or more Vehicles | 2,138 (25.9%) | 728 (7.7%) |
| Total | 8,260 (100.0%) | 9,480 (100.0%) |
Real Estate & Mortgages in Bremerton
Real Estate and Mortgage Overview in Bremerton
| Characteristic | Without Mortgage | With Mortgage |
| Housing Units | 2,136 | 6,124 |
| Median Property Value | $373,100 | $368,700 |
| Median Household Income | $67,098 | $1,903 |
| Monthly Housing Costs | $602 | $376 |
| Real Estate Taxes | $3,170 | $60 |
Property Value by Mortgage Status in Bremerton
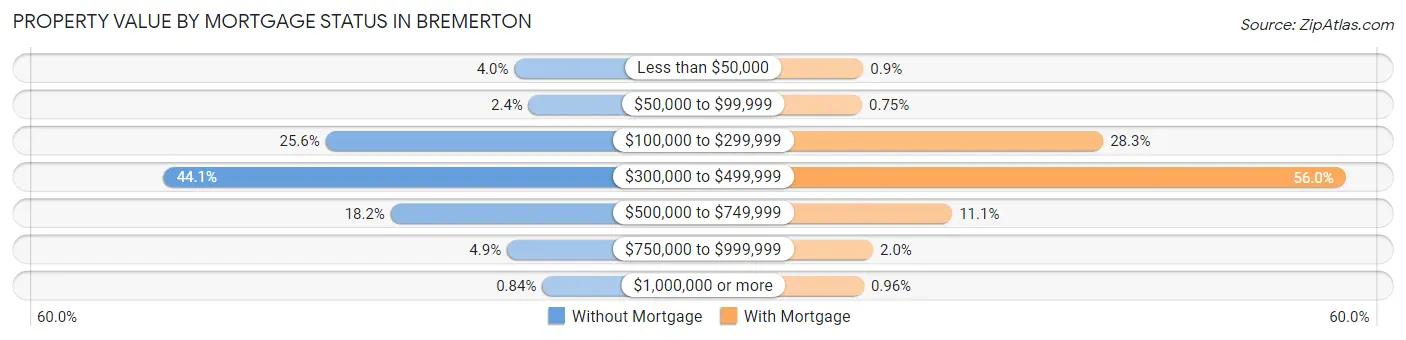
| Property Value | Without Mortgage | With Mortgage |
| Less than $50,000 | 86 (4.0%) | 55 (0.9%) |
| $50,000 to $99,999 | 51 (2.4%) | 46 (0.7%) |
| $100,000 to $299,999 | 547 (25.6%) | 1,734 (28.3%) |
| $300,000 to $499,999 | 942 (44.1%) | 3,430 (56.0%) |
| $500,000 to $749,999 | 388 (18.2%) | 677 (11.1%) |
| $750,000 to $999,999 | 104 (4.9%) | 123 (2.0%) |
| $1,000,000 or more | 18 (0.8%) | 59 (1.0%) |
| Total | 2,136 (100.0%) | 6,124 (100.0%) |
Household Income by Mortgage Status in Bremerton
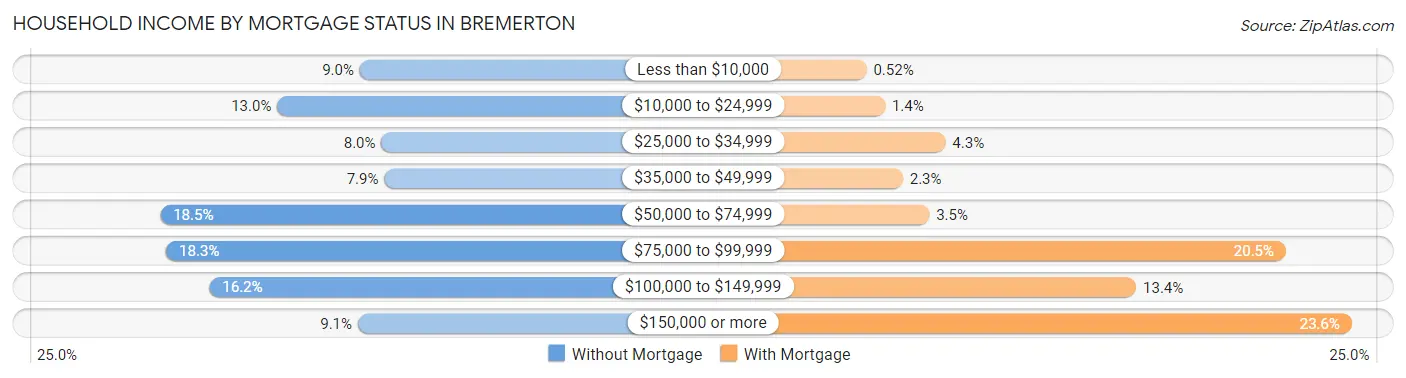
| Household Income | Without Mortgage | With Mortgage |
| Less than $10,000 | 193 (9.0%) | 32 (0.5%) |
| $10,000 to $24,999 | 277 (13.0%) | 86 (1.4%) |
| $25,000 to $34,999 | 171 (8.0%) | 262 (4.3%) |
| $35,000 to $49,999 | 168 (7.9%) | 138 (2.2%) |
| $50,000 to $74,999 | 396 (18.5%) | 215 (3.5%) |
| $75,000 to $99,999 | 390 (18.3%) | 1,255 (20.5%) |
| $100,000 to $149,999 | 346 (16.2%) | 818 (13.4%) |
| $150,000 or more | 195 (9.1%) | 1,447 (23.6%) |
| Total | 2,136 (100.0%) | 6,124 (100.0%) |
Property Value to Household Income Ratio in Bremerton
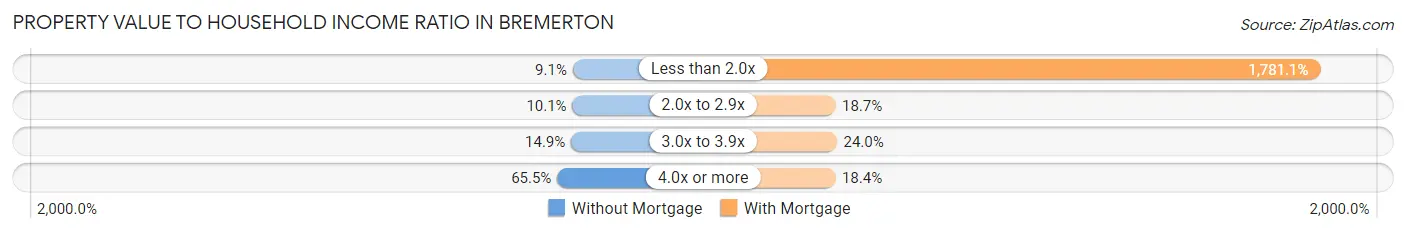
| Value-to-Income Ratio | Without Mortgage | With Mortgage |
| Less than 2.0x | 194 (9.1%) | 109,075 (1,781.1%) |
| 2.0x to 2.9x | 215 (10.1%) | 1,144 (18.7%) |
| 3.0x to 3.9x | 318 (14.9%) | 1,470 (24.0%) |
| 4.0x or more | 1,398 (65.4%) | 1,125 (18.4%) |
| Total | 2,136 (100.0%) | 6,124 (100.0%) |
Real Estate Taxes by Mortgage Status in Bremerton

| Property Taxes | Without Mortgage | With Mortgage |
| Less than $800 | 111 (5.2%) | 31 (0.5%) |
| $800 to $1,499 | 124 (5.8%) | 273 (4.5%) |
| $800 to $1,499 | 1,764 (82.6%) | 463 (7.6%) |
| Total | 2,136 (100.0%) | 6,124 (100.0%) |
Health & Disability in Bremerton
Health Insurance Coverage by Age in Bremerton
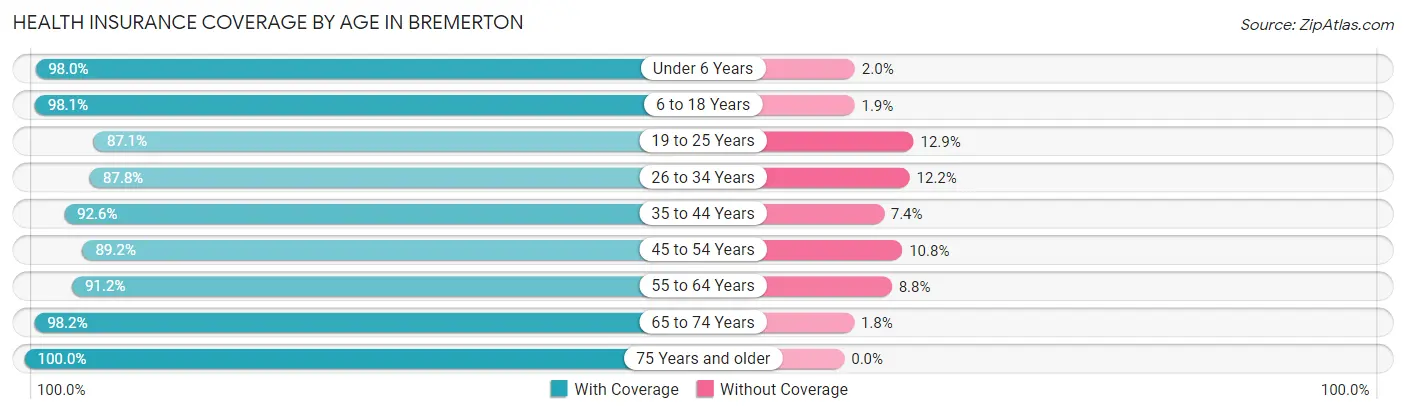
| Age Bracket | With Coverage | Without Coverage |
| Under 6 Years | 2,875 (98.0%) | 58 (2.0%) |
| 6 to 18 Years | 4,670 (98.1%) | 91 (1.9%) |
| 19 to 25 Years | 3,602 (87.1%) | 534 (12.9%) |
| 26 to 34 Years | 6,570 (87.8%) | 911 (12.2%) |
| 35 to 44 Years | 5,145 (92.6%) | 409 (7.4%) |
| 45 to 54 Years | 3,402 (89.2%) | 412 (10.8%) |
| 55 to 64 Years | 4,311 (91.2%) | 418 (8.8%) |
| 65 to 74 Years | 2,841 (98.2%) | 52 (1.8%) |
| 75 Years and older | 2,564 (100.0%) | 0 (0.0%) |
| Total | 35,980 (92.6%) | 2,885 (7.4%) |
Health Insurance Coverage by Citizenship Status in Bremerton
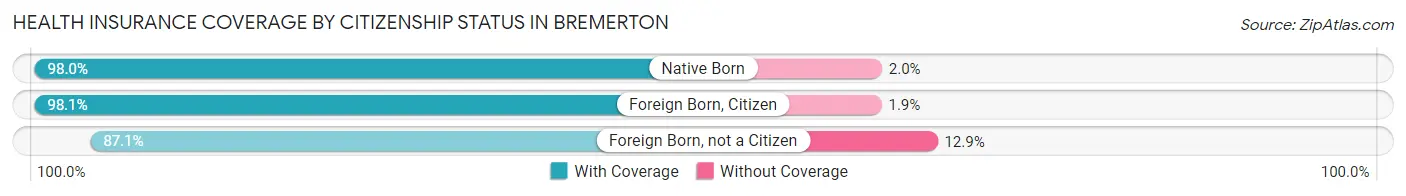
| Citizenship Status | With Coverage | Without Coverage |
| Native Born | 2,875 (98.0%) | 58 (2.0%) |
| Foreign Born, Citizen | 4,670 (98.1%) | 91 (1.9%) |
| Foreign Born, not a Citizen | 3,602 (87.1%) | 534 (12.9%) |
Health Insurance Coverage by Household Income in Bremerton
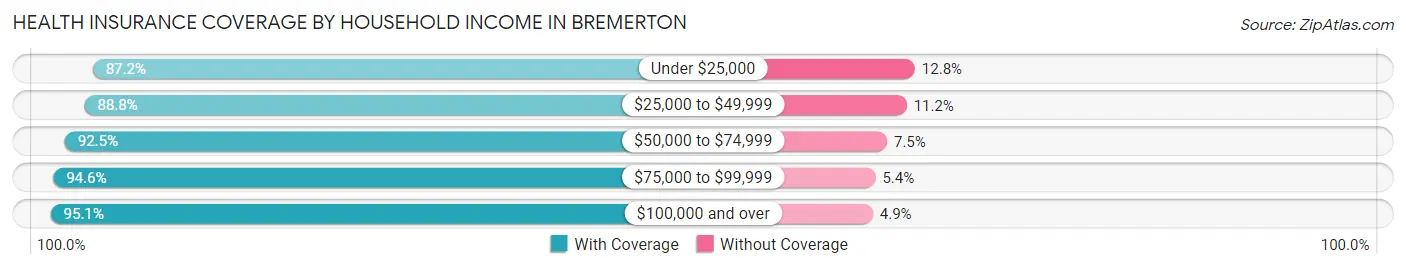
| Household Income | With Coverage | Without Coverage |
| Under $25,000 | 4,390 (87.2%) | 642 (12.8%) |
| $25,000 to $49,999 | 5,137 (88.8%) | 649 (11.2%) |
| $50,000 to $74,999 | 6,893 (92.5%) | 562 (7.5%) |
| $75,000 to $99,999 | 4,974 (94.6%) | 282 (5.4%) |
| $100,000 and over | 14,309 (95.1%) | 734 (4.9%) |
Public vs Private Health Insurance Coverage by Age in Bremerton
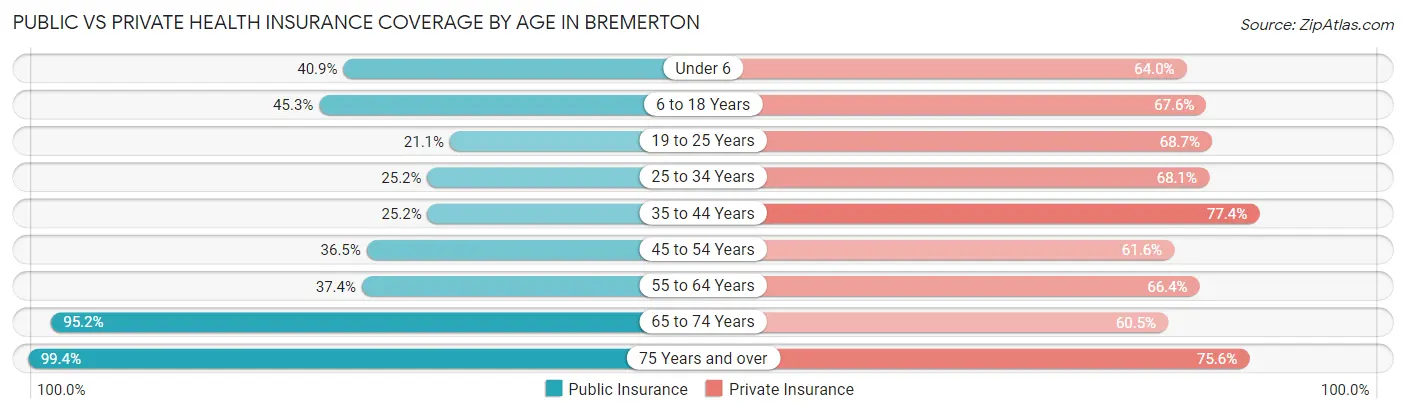
| Age Bracket | Public Insurance | Private Insurance |
| Under 6 | 1,198 (40.8%) | 1,876 (64.0%) |
| 6 to 18 Years | 2,158 (45.3%) | 3,220 (67.6%) |
| 19 to 25 Years | 871 (21.1%) | 2,840 (68.7%) |
| 25 to 34 Years | 1,888 (25.2%) | 5,096 (68.1%) |
| 35 to 44 Years | 1,400 (25.2%) | 4,301 (77.4%) |
| 45 to 54 Years | 1,393 (36.5%) | 2,351 (61.6%) |
| 55 to 64 Years | 1,769 (37.4%) | 3,139 (66.4%) |
| 65 to 74 Years | 2,755 (95.2%) | 1,751 (60.5%) |
| 75 Years and over | 2,549 (99.4%) | 1,938 (75.6%) |
| Total | 15,981 (41.1%) | 26,512 (68.2%) |
Disability Status by Sex by Age in Bremerton
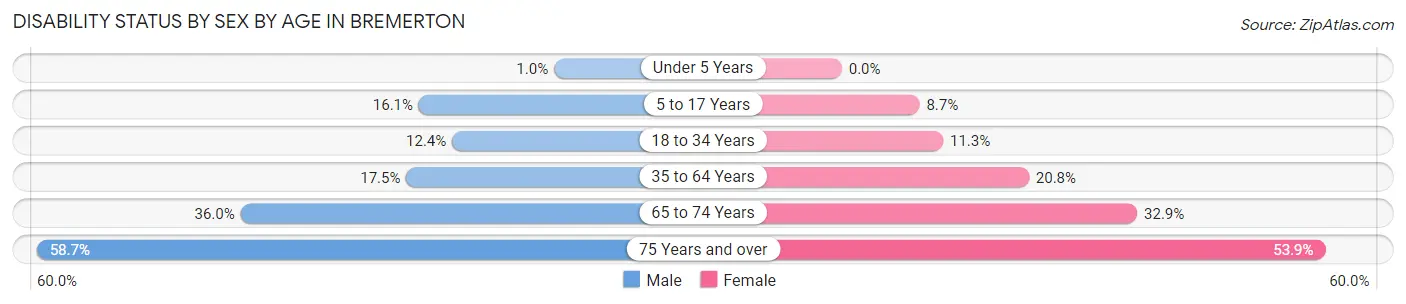
| Age Bracket | Male | Female |
| Under 5 Years | 14 (1.0%) | 0 (0.0%) |
| 5 to 17 Years | 425 (16.1%) | 183 (8.6%) |
| 18 to 34 Years | 764 (12.4%) | 656 (11.3%) |
| 35 to 64 Years | 1,281 (17.5%) | 1,411 (20.8%) |
| 65 to 74 Years | 440 (35.9%) | 549 (32.9%) |
| 75 Years and over | 566 (58.7%) | 861 (53.8%) |
Disability Class by Sex by Age in Bremerton
Disability Class: Hearing Difficulty
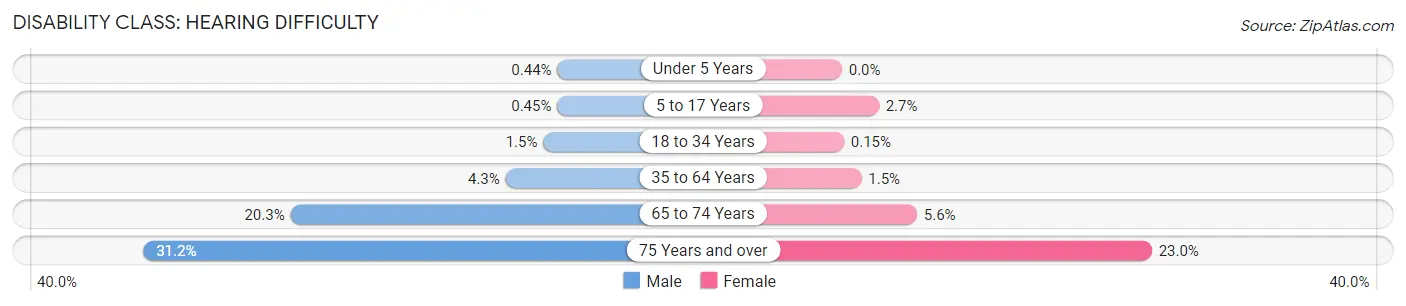
| Age Bracket | Male | Female |
| Under 5 Years | 6 (0.4%) | 0 (0.0%) |
| 5 to 17 Years | 12 (0.4%) | 58 (2.7%) |
| 18 to 34 Years | 92 (1.5%) | 9 (0.2%) |
| 35 to 64 Years | 314 (4.3%) | 98 (1.5%) |
| 65 to 74 Years | 248 (20.3%) | 93 (5.6%) |
| 75 Years and over | 301 (31.2%) | 368 (23.0%) |
Disability Class: Vision Difficulty
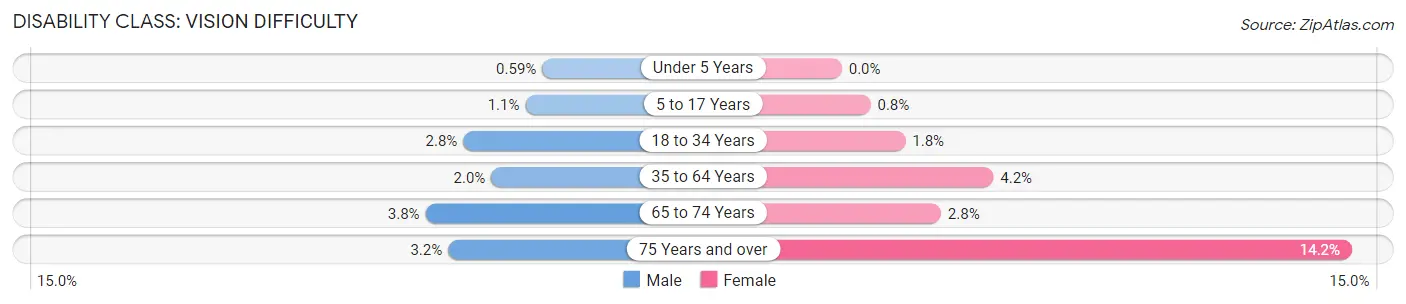
| Age Bracket | Male | Female |
| Under 5 Years | 8 (0.6%) | 0 (0.0%) |
| 5 to 17 Years | 28 (1.1%) | 17 (0.8%) |
| 18 to 34 Years | 172 (2.8%) | 103 (1.8%) |
| 35 to 64 Years | 147 (2.0%) | 286 (4.2%) |
| 65 to 74 Years | 47 (3.8%) | 46 (2.8%) |
| 75 Years and over | 31 (3.2%) | 227 (14.2%) |
Disability Class: Cognitive Difficulty
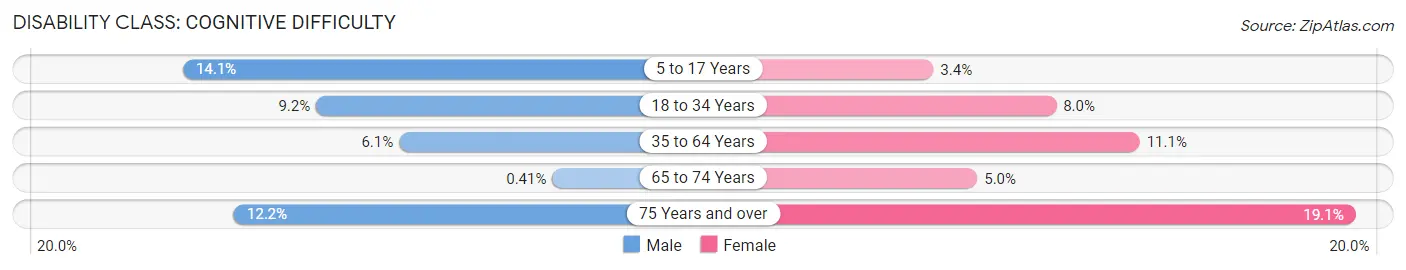
| Age Bracket | Male | Female |
| 5 to 17 Years | 373 (14.1%) | 72 (3.4%) |
| 18 to 34 Years | 566 (9.2%) | 463 (8.0%) |
| 35 to 64 Years | 447 (6.1%) | 749 (11.1%) |
| 65 to 74 Years | 5 (0.4%) | 84 (5.0%) |
| 75 Years and over | 118 (12.2%) | 305 (19.1%) |
Disability Class: Ambulatory Difficulty
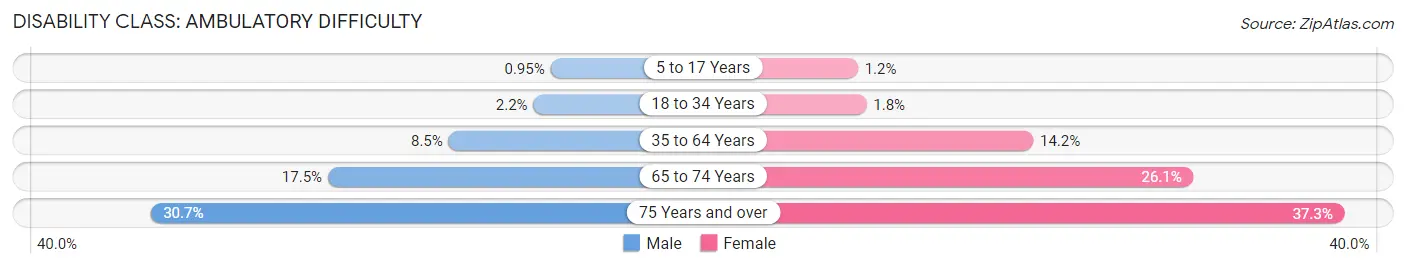
| Age Bracket | Male | Female |
| 5 to 17 Years | 25 (0.9%) | 25 (1.2%) |
| 18 to 34 Years | 137 (2.2%) | 106 (1.8%) |
| 35 to 64 Years | 624 (8.5%) | 962 (14.2%) |
| 65 to 74 Years | 214 (17.5%) | 436 (26.1%) |
| 75 Years and over | 296 (30.7%) | 597 (37.3%) |
Disability Class: Self-Care Difficulty
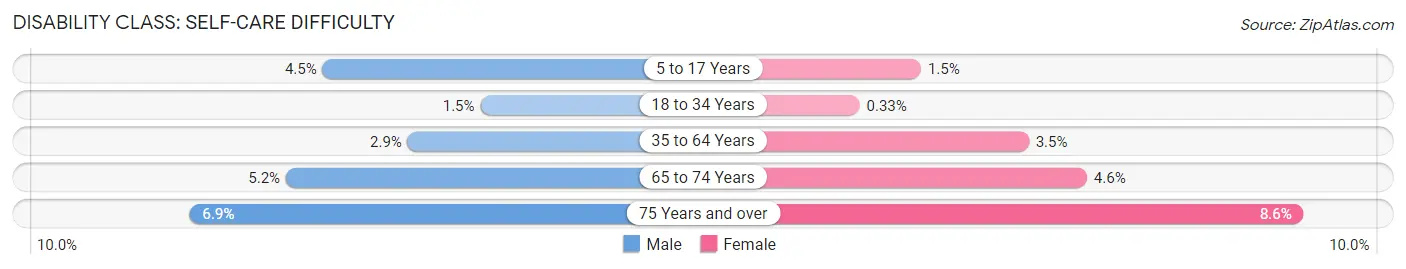
| Age Bracket | Male | Female |
| 5 to 17 Years | 118 (4.5%) | 31 (1.5%) |
| 18 to 34 Years | 95 (1.5%) | 19 (0.3%) |
| 35 to 64 Years | 212 (2.9%) | 235 (3.5%) |
| 65 to 74 Years | 63 (5.1%) | 76 (4.5%) |
| 75 Years and over | 67 (6.9%) | 137 (8.6%) |
Technology Access in Bremerton
Computing Device Access in Bremerton
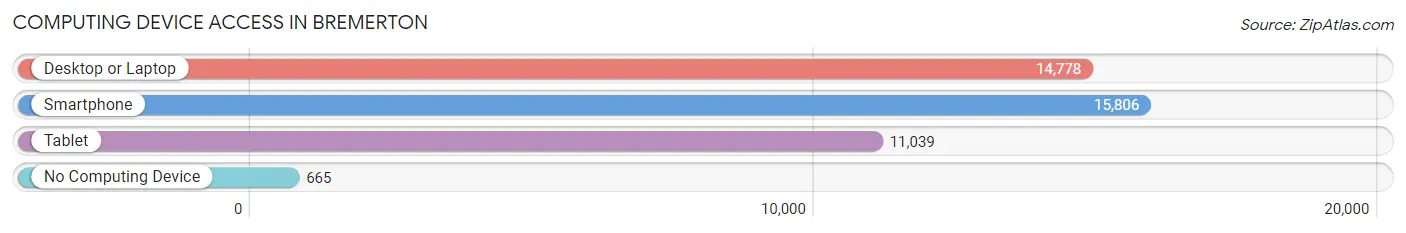
| Device Type | # Households | % Households |
| Desktop or Laptop | 14,778 | 83.3% |
| Smartphone | 15,806 | 89.1% |
| Tablet | 11,039 | 62.2% |
| No Computing Device | 665 | 3.7% |
| Total | 17,740 | 100.0% |
Internet Access in Bremerton
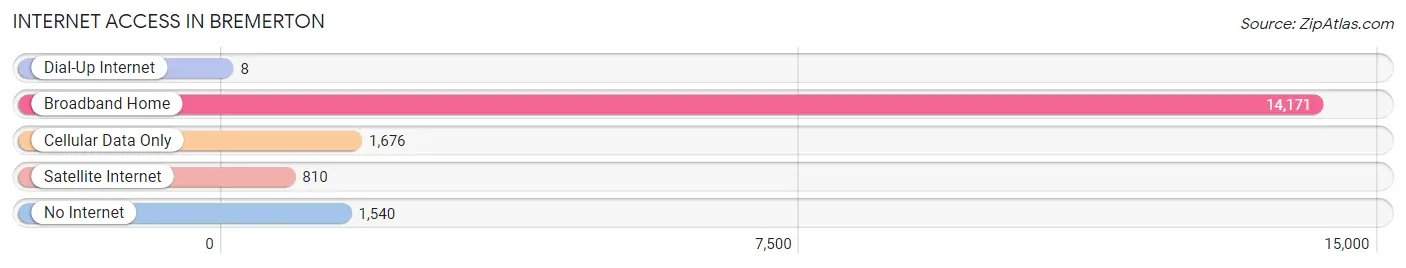
| Internet Type | # Households | % Households |
| Dial-Up Internet | 8 | 0.1% |
| Broadband Home | 14,171 | 79.9% |
| Cellular Data Only | 1,676 | 9.5% |
| Satellite Internet | 810 | 4.6% |
| No Internet | 1,540 | 8.7% |
| Total | 17,740 | 100.0% |
Bremerton Summary
Introduction
Bremerton is a city located in Kitsap County, Washington, United States. It is situated on the Kitsap Peninsula, across the Puget Sound from Seattle. Bremerton is the largest city in Kitsap County and the largest city on the Kitsap Peninsula. The population of Bremerton was 37,729 at the 2010 census.
History
The area that is now Bremerton was first settled by William Bremer in 1864. Bremer was a German immigrant who had come to the United States in 1854. He established a sawmill on the site of what is now downtown Bremerton. The city was officially incorporated in 1891.
In the early 20th century, Bremerton was a major shipbuilding center. During World War II, the Puget Sound Naval Shipyard was established in Bremerton and it became the largest employer in the city. The shipyard was responsible for the construction of many of the ships used in the war effort.
After the war, the shipyard continued to be a major employer in the city. In the late 20th century, the shipyard began to downsize and the city began to diversify its economy. Today, Bremerton is home to a variety of industries, including technology, healthcare, and retail.
Geography
Bremerton is located on the Kitsap Peninsula, across the Puget Sound from Seattle. The city is situated on the Kitsap Peninsula, which is bordered by the Hood Canal to the west and the Puget Sound to the east. The city is located at the northern end of the Kitsap Peninsula, and is bordered by the cities of Port Orchard to the south and Poulsbo to the north.
The city has a total area of 16.2 square miles, of which 15.7 square miles is land and 0.5 square miles is water. The city is located at an elevation of approximately 100 feet above sea level.
Economy
Bremerton’s economy is largely based on the Puget Sound Naval Shipyard, which is the largest employer in the city. The shipyard is responsible for the construction and repair of naval vessels. Other major employers in the city include the Harrison Medical Center, the Kitsap County government, and the Bremerton School District.
The city is also home to a variety of retail and service businesses, including restaurants, bars, and shops. Bremerton is also home to a number of technology companies, including Microsoft, Amazon, and Boeing.
Demographics
As of the 2010 census, the population of Bremerton was 37,729. The racial makeup of the city was 73.3% White, 11.2% African American, 5.2% Asian, 0.7% Native American, 0.2% Pacific Islander, and 8.4% from other races. The median household income in the city was $45,945.
Conclusion
Bremerton is a city located in Kitsap County, Washington, United States. It is situated on the Kitsap Peninsula, across the Puget Sound from Seattle. The city was first settled by William Bremer in 1864 and was officially incorporated in 1891. Bremerton is the largest city in Kitsap County and the largest city on the Kitsap Peninsula. The city’s economy is largely based on the Puget Sound Naval Shipyard, which is the largest employer in the city. As of the 2010 census, the population of Bremerton was 37,729.
Common Questions
What is Per Capita Income in Bremerton?
Per Capita income in Bremerton is $39,139.
What is the Median Family Income in Bremerton?
Median Family Income in Bremerton is $84,330.
What is the Median Household income in Bremerton?
Median Household Income in Bremerton is $68,556.
What is Income or Wage Gap in Bremerton?
Income or Wage Gap in Bremerton is 16.5%.
Women in Bremerton earn 83.5 cents for every dollar earned by a man.
What is Family Income Deficit in Bremerton?
Family Income Deficit in Bremerton is $11,620.
Families that are below poverty line in Bremerton earn $11,620 less on average than the poverty threshold level.
What is Inequality or Gini Index in Bremerton?
Inequality or Gini Index in Bremerton is 0.44.
What is the Total Population of Bremerton?
Total Population of Bremerton is 43,983.
What is the Total Male Population of Bremerton?
Total Male Population of Bremerton is 23,661.
What is the Total Female Population of Bremerton?
Total Female Population of Bremerton is 20,322.
What is the Ratio of Males per 100 Females in Bremerton?
There are 116.43 Males per 100 Females in Bremerton.
What is the Ratio of Females per 100 Males in Bremerton?
There are 85.89 Females per 100 Males in Bremerton.
What is the Median Population Age in Bremerton?
Median Population Age in Bremerton is 33.5 Years.
What is the Average Family Size in Bremerton
Average Family Size in Bremerton is 2.9 People.
What is the Average Household Size in Bremerton
Average Household Size in Bremerton is 2.3 People.
How Large is the Labor Force in Bremerton?
There are 24,969 People in the Labor Forcein in Bremerton.
What is the Percentage of People in the Labor Force in Bremerton?
67.2% of People are in the Labor Force in Bremerton.
What is the Unemployment Rate in Bremerton?
Unemployment Rate in Bremerton is 5.5%.