Zip Codes with the Highest Percentage of Population with a Degree in Engineering in Seattle, WA
RELATED REPORTS & OPTIONS
Engineering
Seattle
Compare Zip Codes
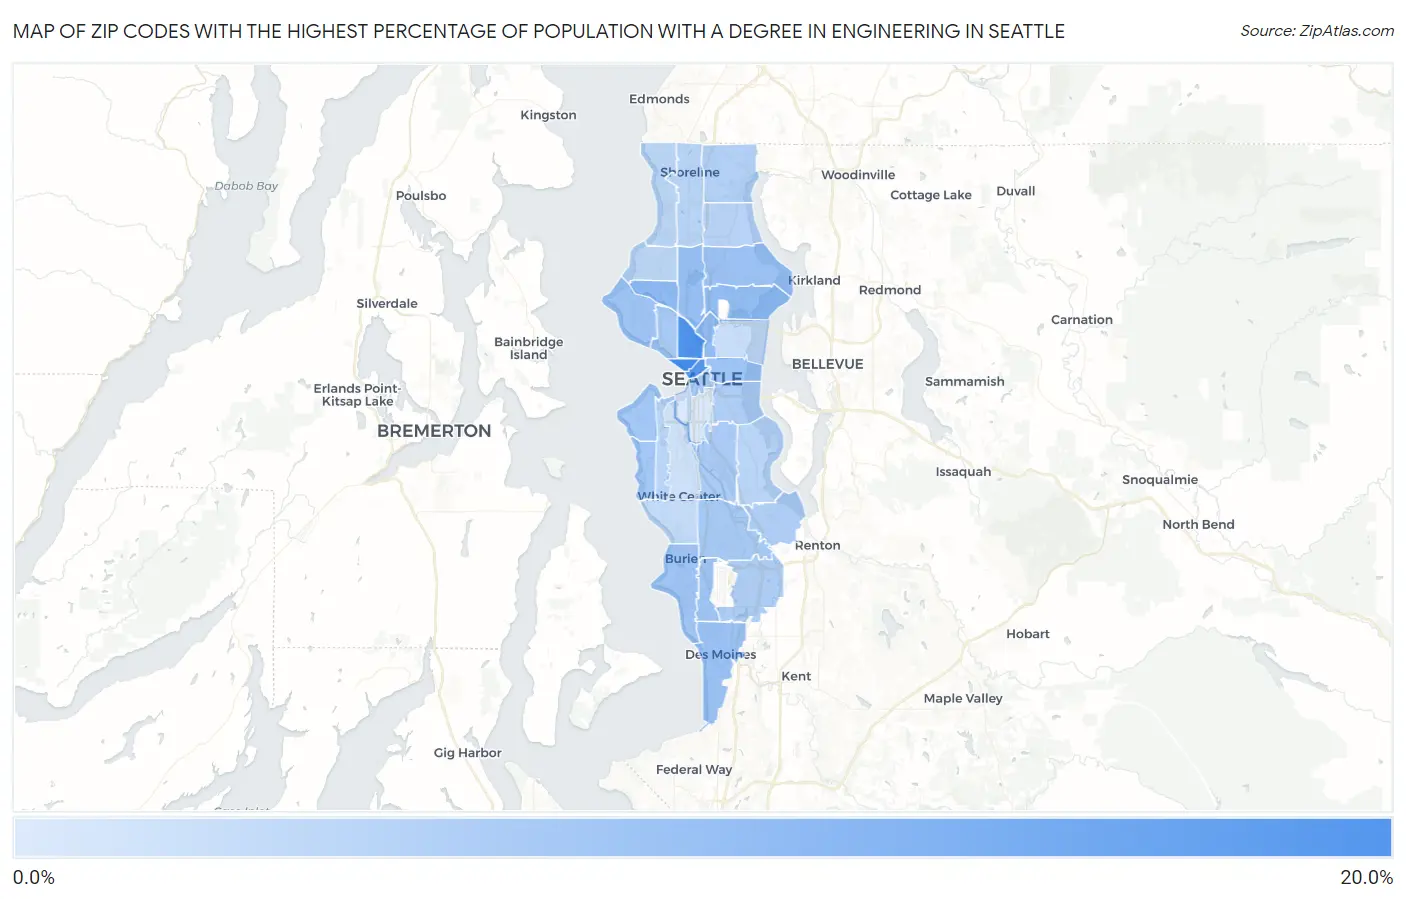
Map of Zip Codes with the Highest Percentage of Population with a Degree in Engineering in Seattle
3.8%
19.8%
Zip Codes with the Highest Percentage of Population with a Degree in Engineering in Seattle, WA
| Zip Code | % Graduates | vs State | vs National | |
| 1. | 98121 | 19.8% | 9.8%(+10.0)#24 | 7.6%(+12.2)#931 |
| 2. | 98109 | 19.0% | 9.8%(+9.17)#27 | 7.6%(+11.4)#1,027 |
| 3. | 98101 | 18.0% | 9.8%(+8.19)#32 | 7.6%(+10.4)#1,159 |
| 4. | 98107 | 11.9% | 9.8%(+2.09)#74 | 7.6%(+4.28)#2,933 |
| 5. | 98102 | 11.6% | 9.8%(+1.72)#84 | 7.6%(+3.91)#3,134 |
| 6. | 98105 | 11.5% | 9.8%(+1.63)#89 | 7.6%(+3.81)#3,205 |
| 7. | 98103 | 10.9% | 9.8%(+1.02)#100 | 7.6%(+3.20)#3,654 |
| 8. | 98115 | 10.7% | 9.8%(+0.826)#104 | 7.6%(+3.01)#3,818 |
| 9. | 98198 | 10.6% | 9.8%(+0.754)#107 | 7.6%(+2.94)#3,898 |
| 10. | 98122 | 10.1% | 9.8%(+0.252)#124 | 7.6%(+2.44)#4,367 |
| 11. | 98199 | 9.9% | 9.8%(+0.054)#130 | 7.6%(+2.24)#4,547 |
| 12. | 98148 | 9.9% | 9.8%(+0.020)#131 | 7.6%(+2.21)#4,570 |
| 13. | 98166 | 9.8% | 9.8%(-0.020)#133 | 7.6%(+2.17)#4,614 |
| 14. | 98136 | 9.7% | 9.8%(-0.099)#135 | 7.6%(+2.09)#4,704 |
| 15. | 98116 | 9.7% | 9.8%(-0.138)#138 | 7.6%(+2.05)#4,755 |
| 16. | 98168 | 9.3% | 9.8%(-0.580)#148 | 7.6%(+1.61)#5,256 |
| 17. | 98119 | 9.2% | 9.8%(-0.655)#149 | 7.6%(+1.53)#5,343 |
| 18. | 98104 | 9.2% | 9.8%(-0.668)#151 | 7.6%(+1.52)#5,359 |
| 19. | 98108 | 9.0% | 9.8%(-0.829)#158 | 7.6%(+1.36)#5,595 |
| 20. | 98188 | 8.6% | 9.8%(-1.27)#171 | 7.6%(+0.918)#6,188 |
| 21. | 98144 | 8.5% | 9.8%(-1.30)#173 | 7.6%(+0.882)#6,238 |
| 22. | 98178 | 8.4% | 9.8%(-1.40)#177 | 7.6%(+0.783)#6,384 |
| 23. | 98155 | 7.9% | 9.8%(-1.94)#200 | 7.6%(+0.247)#7,293 |
| 24. | 98125 | 7.4% | 9.8%(-2.43)#217 | 7.6%(-0.242)#8,195 |
| 25. | 98118 | 7.4% | 9.8%(-2.47)#219 | 7.6%(-0.285)#8,269 |
| 26. | 98126 | 7.3% | 9.8%(-2.54)#221 | 7.6%(-0.353)#8,393 |
| 27. | 98133 | 7.2% | 9.8%(-2.67)#225 | 7.6%(-0.482)#8,631 |
| 28. | 98177 | 7.0% | 9.8%(-2.87)#233 | 7.6%(-0.682)#9,069 |
| 29. | 98117 | 7.0% | 9.8%(-2.88)#234 | 7.6%(-0.697)#9,108 |
| 30. | 98146 | 6.4% | 9.8%(-3.40)#258 | 7.6%(-1.22)#10,151 |
| 31. | 98112 | 5.8% | 9.8%(-4.01)#277 | 7.6%(-1.82)#11,620 |
| 32. | 98106 | 5.2% | 9.8%(-4.58)#297 | 7.6%(-2.40)#13,074 |
| 33. | 98134 | 4.1% | 9.8%(-5.74)#349 | 7.6%(-3.56)#16,102 |
| 34. | 98164 | 3.8% | 9.8%(-6.07)#365 | 7.6%(-3.88)#16,973 |
1
Common Questions
What are the Top 10 Zip Codes with the Highest Percentage of Population with a Degree in Engineering in Seattle, WA?
Top 10 Zip Codes with the Highest Percentage of Population with a Degree in Engineering in Seattle, WA are:
What zip code has the Highest Percentage of Population with a Degree in Engineering in Seattle, WA?
98121 has the Highest Percentage of Population with a Degree in Engineering in Seattle, WA with 19.8%.
What is the Percentage of Population with a Degree in Engineering in Seattle, WA?
Percentage of Population with a Degree in Engineering in Seattle is 10.4%.
What is the Percentage of Population with a Degree in Engineering in Washington?
Percentage of Population with a Degree in Engineering in Washington is 9.8%.
What is the Percentage of Population with a Degree in Engineering in the United States?
Percentage of Population with a Degree in Engineering in the United States is 7.6%.