Marcus, WA Map & Demographics
Marcus Map
Marcus Overview
$18,975
PER CAPITA INCOME
$50,500
AVG FAMILY INCOME
$48,125
AVG HOUSEHOLD INCOME
50.5%
WAGE / INCOME GAP [ % ]
49.5¢/ $1
WAGE / INCOME GAP [ $ ]
$13,730
FAMILY INCOME DEFICIT
0.30
INEQUALITY / GINI INDEX
182
TOTAL POPULATION
92
MALE POPULATION
90
FEMALE POPULATION
102.22
MALES / 100 FEMALES
97.83
FEMALES / 100 MALES
48.5
MEDIAN AGE
2.4
AVG FAMILY SIZE
2.3
AVG HOUSEHOLD SIZE
47
LABOR FORCE [ PEOPLE ]
30.3%
PERCENT IN LABOR FORCE
Marcus Zip Codes
Marcus Area Codes
Income in Marcus
Income Overview in Marcus
Per Capita Income in Marcus is $18,975, while median incomes of families and households are $50,500 and $48,125 respectively.
| Characteristic | Number | Measure |
| Per Capita Income | 182 | $18,975 |
| Median Family Income | 56 | $50,500 |
| Mean Family Income | 56 | $47,538 |
| Median Household Income | 79 | $48,125 |
| Mean Household Income | 79 | $45,209 |
| Income Deficit | 56 | $13,730 |
| Wage / Income Gap (%) | 182 | 50.53% |
| Wage / Income Gap ($) | 182 | 49.47¢ per $1 |
| Gini / Inequality Index | 182 | 0.30 |
Earnings by Sex in Marcus
Average Earnings in Marcus are $28,750, $31,167 for men and $15,417 for women, a difference of 50.5%.
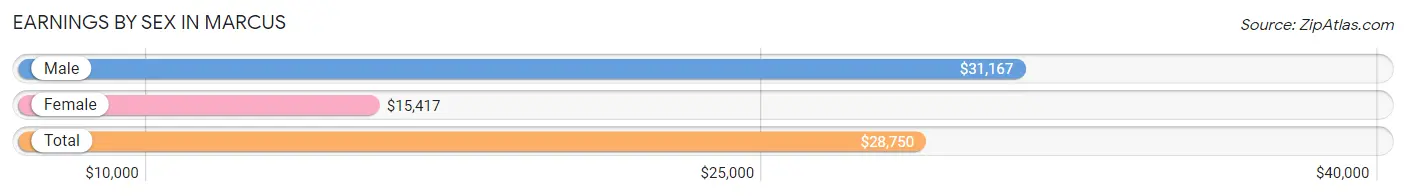
| Sex | Number | Average Earnings |
| Male | 44 (66.7%) | $31,167 |
| Female | 22 (33.3%) | $15,417 |
| Total | 66 (100.0%) | $28,750 |
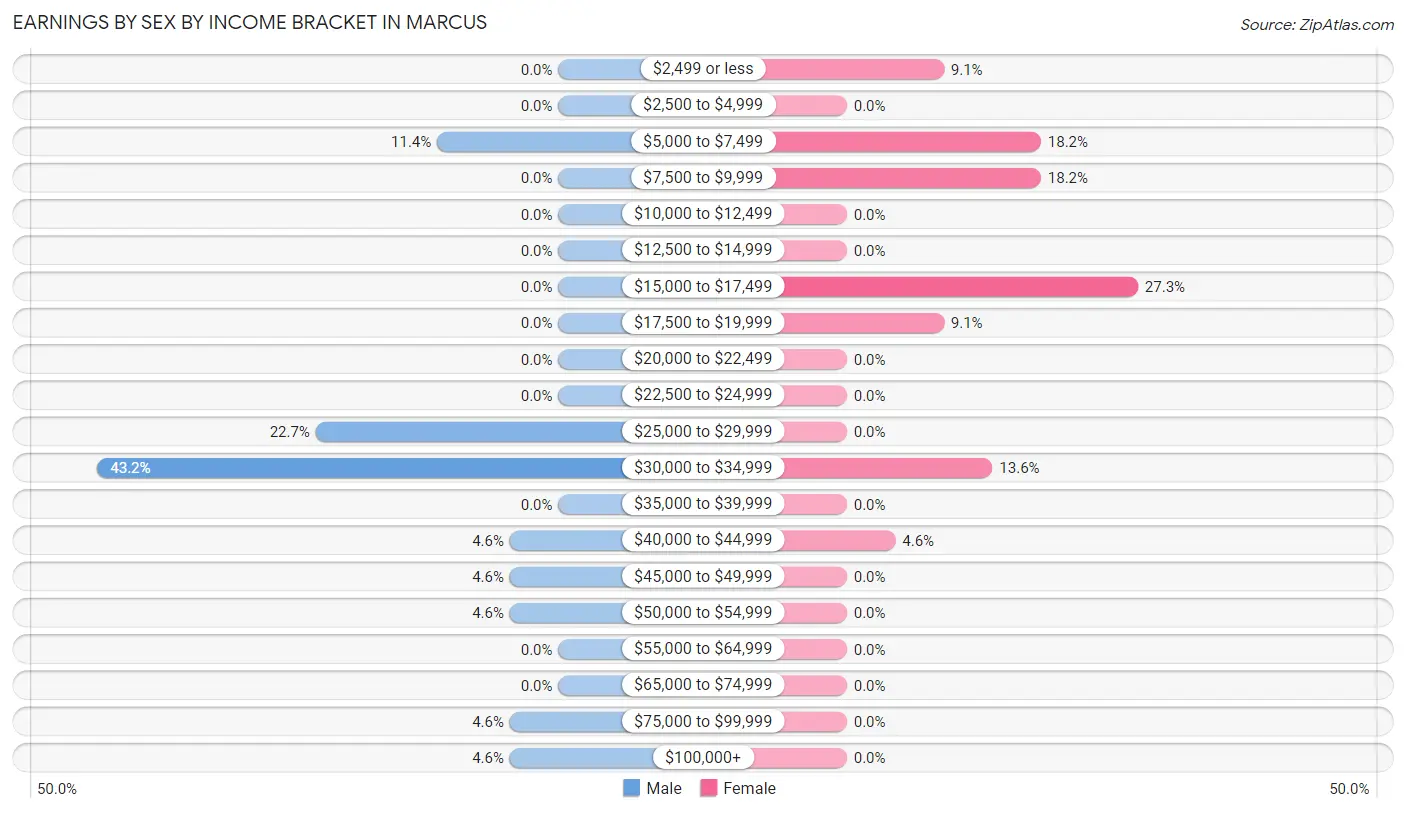
Earnings by Sex by Income Bracket in Marcus
The most common earnings brackets in Marcus are $30,000 to $34,999 for men (19 | 43.2%) and $15,000 to $17,499 for women (6 | 27.3%).
| Income | Male | Female |
| $2,499 or less | 0 (0.0%) | 2 (9.1%) |
| $2,500 to $4,999 | 0 (0.0%) | 0 (0.0%) |
| $5,000 to $7,499 | 5 (11.4%) | 4 (18.2%) |
| $7,500 to $9,999 | 0 (0.0%) | 4 (18.2%) |
| $10,000 to $12,499 | 0 (0.0%) | 0 (0.0%) |
| $12,500 to $14,999 | 0 (0.0%) | 0 (0.0%) |
| $15,000 to $17,499 | 0 (0.0%) | 6 (27.3%) |
| $17,500 to $19,999 | 0 (0.0%) | 2 (9.1%) |
| $20,000 to $22,499 | 0 (0.0%) | 0 (0.0%) |
| $22,500 to $24,999 | 0 (0.0%) | 0 (0.0%) |
| $25,000 to $29,999 | 10 (22.7%) | 0 (0.0%) |
| $30,000 to $34,999 | 19 (43.2%) | 3 (13.6%) |
| $35,000 to $39,999 | 0 (0.0%) | 0 (0.0%) |
| $40,000 to $44,999 | 2 (4.5%) | 1 (4.5%) |
| $45,000 to $49,999 | 2 (4.5%) | 0 (0.0%) |
| $50,000 to $54,999 | 2 (4.5%) | 0 (0.0%) |
| $55,000 to $64,999 | 0 (0.0%) | 0 (0.0%) |
| $65,000 to $74,999 | 0 (0.0%) | 0 (0.0%) |
| $75,000 to $99,999 | 2 (4.5%) | 0 (0.0%) |
| $100,000+ | 2 (4.5%) | 0 (0.0%) |
| Total | 44 (100.0%) | 22 (100.0%) |
Earnings by Sex by Educational Attainment in Marcus
| Educational Attainment | Male Income | Female Income |
| Less than High School | - | - |
| High School Diploma | - | - |
| College or Associate's Degree | - | - |
| Bachelor's Degree | - | - |
| Graduate Degree | - | - |
| Total | $30,917 | $15,417 |
Family Income in Marcus
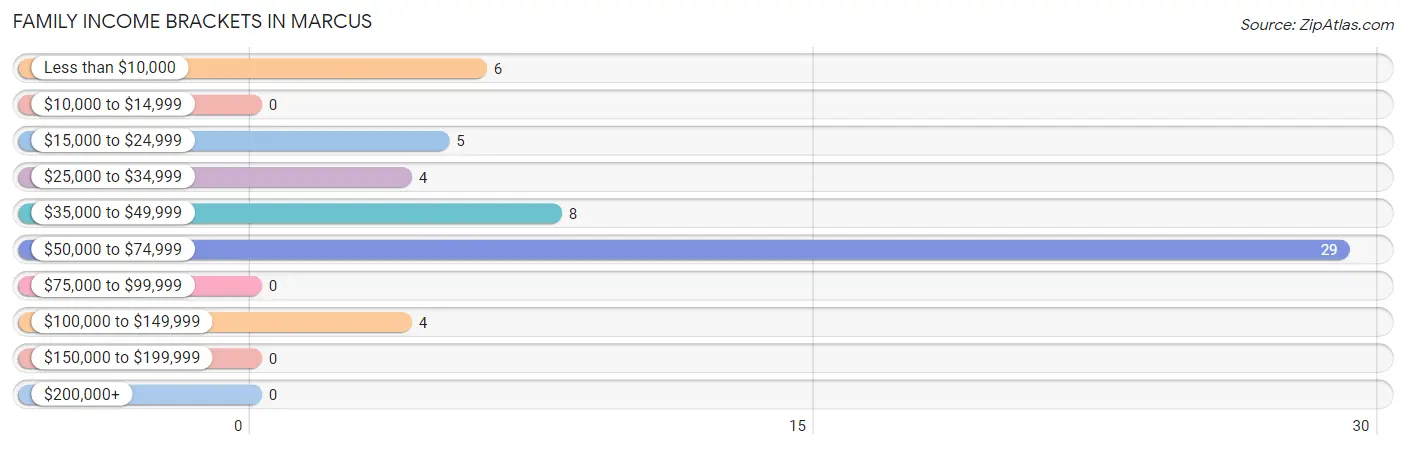
Family Income Brackets in Marcus
According to the Marcus family income data, there are 29 families falling into the $50,000 to $74,999 income range, which is the most common income bracket and makes up 51.8% of all families.
| Income Bracket | # Families | % Families |
| Less than $10,000 | 6 | 10.7% |
| $10,000 to $14,999 | 0 | 0.0% |
| $15,000 to $24,999 | 5 | 8.9% |
| $25,000 to $34,999 | 4 | 7.1% |
| $35,000 to $49,999 | 8 | 14.3% |
| $50,000 to $74,999 | 29 | 51.8% |
| $75,000 to $99,999 | 0 | 0.0% |
| $100,000 to $149,999 | 4 | 7.1% |
| $150,000 to $199,999 | 0 | 0.0% |
| $200,000+ | 0 | 0.0% |
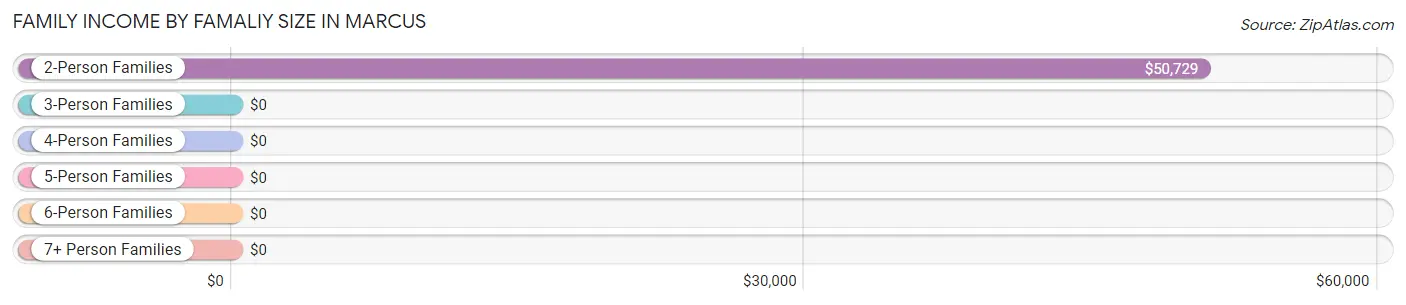
Family Income by Famaliy Size in Marcus
2-person families (42 | 75.0%) account for the highest median family income in Marcus with $50,729 per family, while 2-person families (42 | 75.0%) have the highest median income of $25,364 per family member.
| Income Bracket | # Families | Median Income |
| 2-Person Families | 42 (75.0%) | $50,729 |
| 3-Person Families | 6 (10.7%) | $0 |
| 4-Person Families | 6 (10.7%) | $0 |
| 5-Person Families | 2 (3.6%) | $0 |
| 6-Person Families | 0 (0.0%) | $0 |
| 7+ Person Families | 0 (0.0%) | $0 |
| Total | 56 (100.0%) | $50,500 |
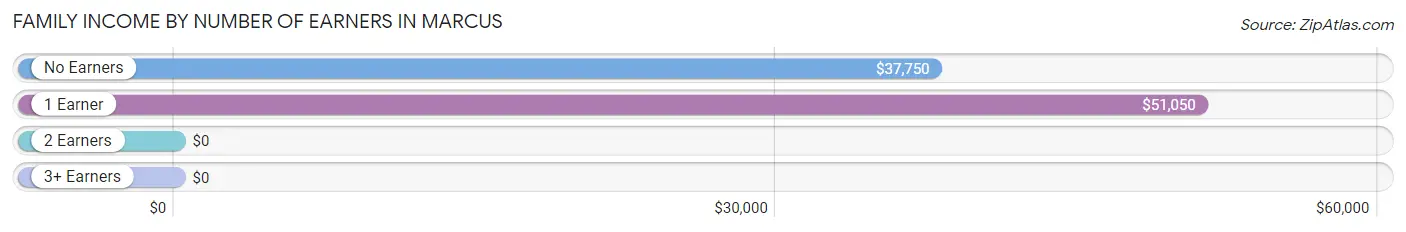
Family Income by Number of Earners in Marcus
| Number of Earners | # Families | Median Income |
| No Earners | 13 (23.2%) | $37,750 |
| 1 Earner | 33 (58.9%) | $51,050 |
| 2 Earners | 10 (17.9%) | $0 |
| 3+ Earners | 0 (0.0%) | $0 |
| Total | 56 (100.0%) | $50,500 |
Household Income in Marcus
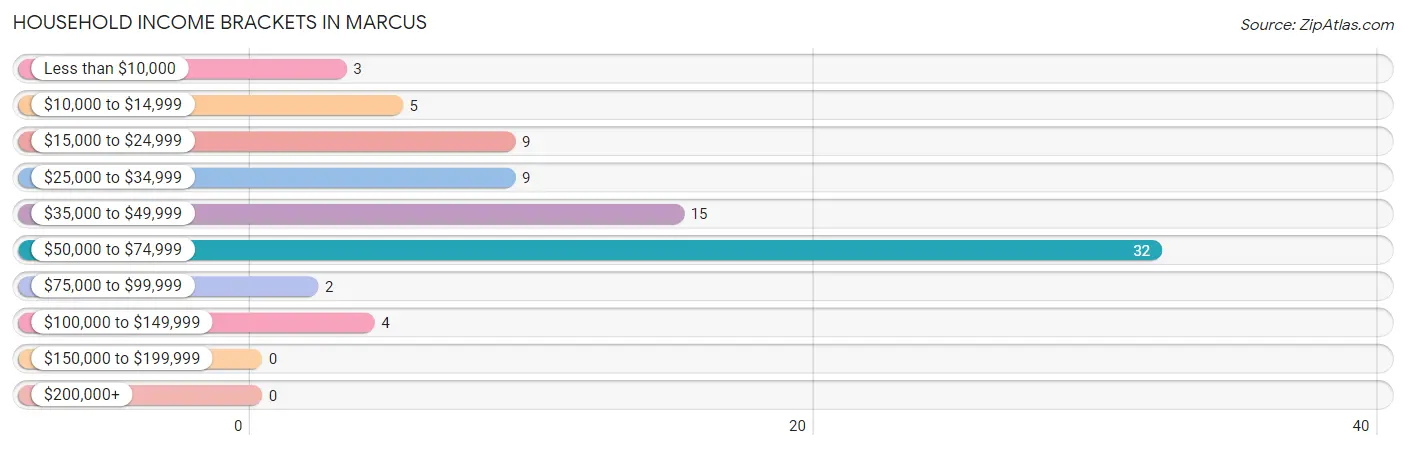
Household Income Brackets in Marcus
With 32 households falling in the category, the $50,000 to $74,999 income range is the most frequent in Marcus, accounting for 40.5% of all households.
| Income Bracket | # Households | % Households |
| Less than $10,000 | 3 | 3.8% |
| $10,000 to $14,999 | 5 | 6.3% |
| $15,000 to $24,999 | 9 | 11.4% |
| $25,000 to $34,999 | 9 | 11.4% |
| $35,000 to $49,999 | 15 | 19.0% |
| $50,000 to $74,999 | 32 | 40.5% |
| $75,000 to $99,999 | 2 | 2.5% |
| $100,000 to $149,999 | 4 | 5.1% |
| $150,000 to $199,999 | 0 | 0.0% |
| $200,000+ | 0 | 0.0% |
Household Income by Householder Age in Marcus
The median household income in Marcus is $48,125, with the highest median household income of $50,781 found in the 65+ years age bracket for the primary householder. A total of 41 households (51.9%) fall into this category. Meanwhile, the 15 to 24 years age bracket for the primary householder has the lowest median household income of $0, with 2 households (2.5%) in this group.
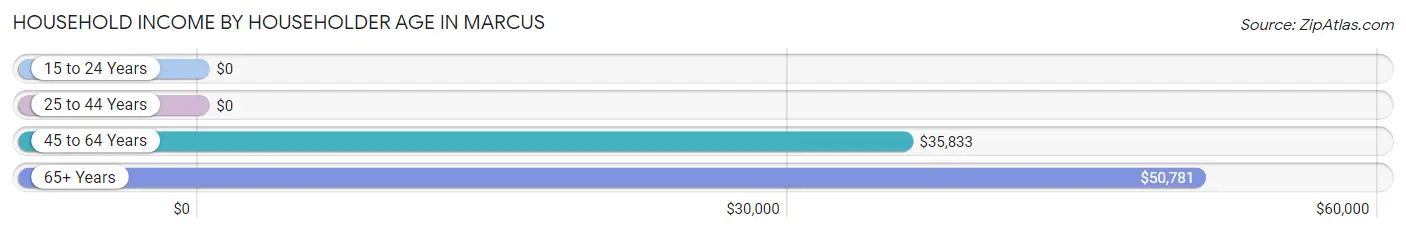
| Income Bracket | # Households | Median Income |
| 15 to 24 Years | 2 (2.5%) | $0 |
| 25 to 44 Years | 10 (12.7%) | $0 |
| 45 to 64 Years | 26 (32.9%) | $35,833 |
| 65+ Years | 41 (51.9%) | $50,781 |
| Total | 79 (100.0%) | $48,125 |
Poverty in Marcus
Income Below Poverty by Sex and Age in Marcus
With 27.2% poverty level for males and 37.8% for females among the residents of Marcus, 16 and 17 year old males and 25 to 34 year old females are the most vulnerable to poverty, with 6 males (100.0%) and 7 females (100.0%) in their respective age groups living below the poverty level.
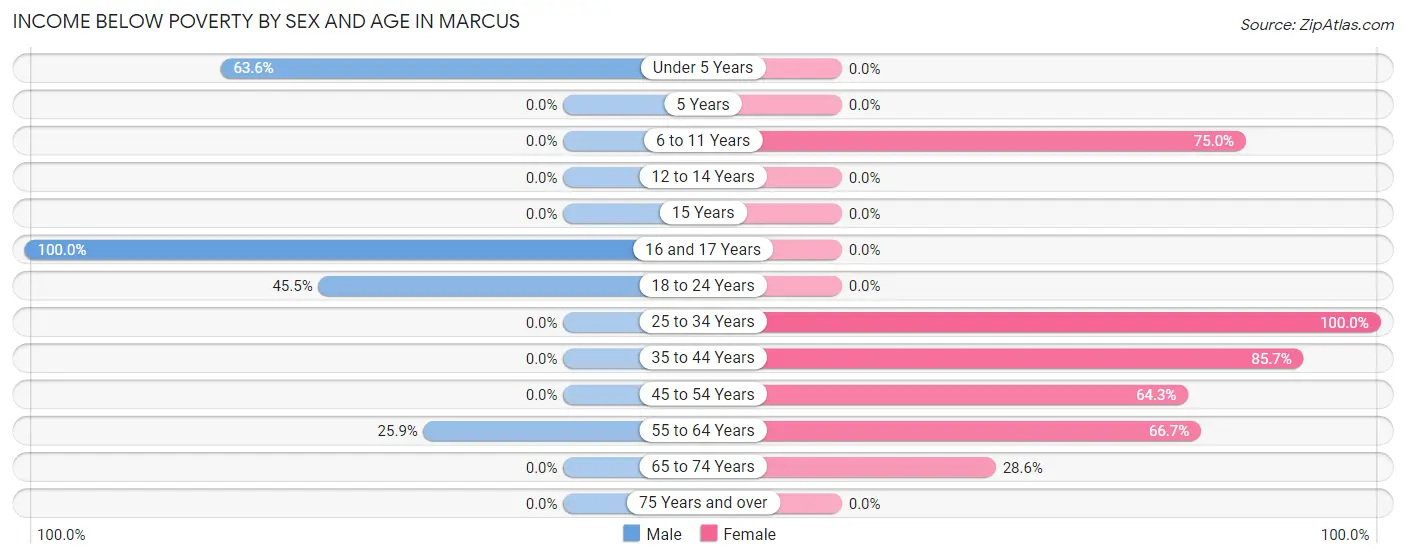
| Age Bracket | Male | Female |
| Under 5 Years | 7 (63.6%) | 0 (0.0%) |
| 5 Years | 0 (0.0%) | 0 (0.0%) |
| 6 to 11 Years | 0 (0.0%) | 6 (75.0%) |
| 12 to 14 Years | 0 (0.0%) | 0 (0.0%) |
| 15 Years | 0 (0.0%) | 0 (0.0%) |
| 16 and 17 Years | 6 (100.0%) | 0 (0.0%) |
| 18 to 24 Years | 5 (45.5%) | 0 (0.0%) |
| 25 to 34 Years | 0 (0.0%) | 7 (100.0%) |
| 35 to 44 Years | 0 (0.0%) | 6 (85.7%) |
| 45 to 54 Years | 0 (0.0%) | 9 (64.3%) |
| 55 to 64 Years | 7 (25.9%) | 4 (66.7%) |
| 65 to 74 Years | 0 (0.0%) | 2 (28.6%) |
| 75 Years and over | 0 (0.0%) | 0 (0.0%) |
| Total | 25 (27.2%) | 34 (37.8%) |
Income Above Poverty by Sex and Age in Marcus
According to the poverty statistics in Marcus, males aged 5 years and females aged under 5 years are the age groups that are most secure financially, with 100.0% of males and 100.0% of females in these age groups living above the poverty line.
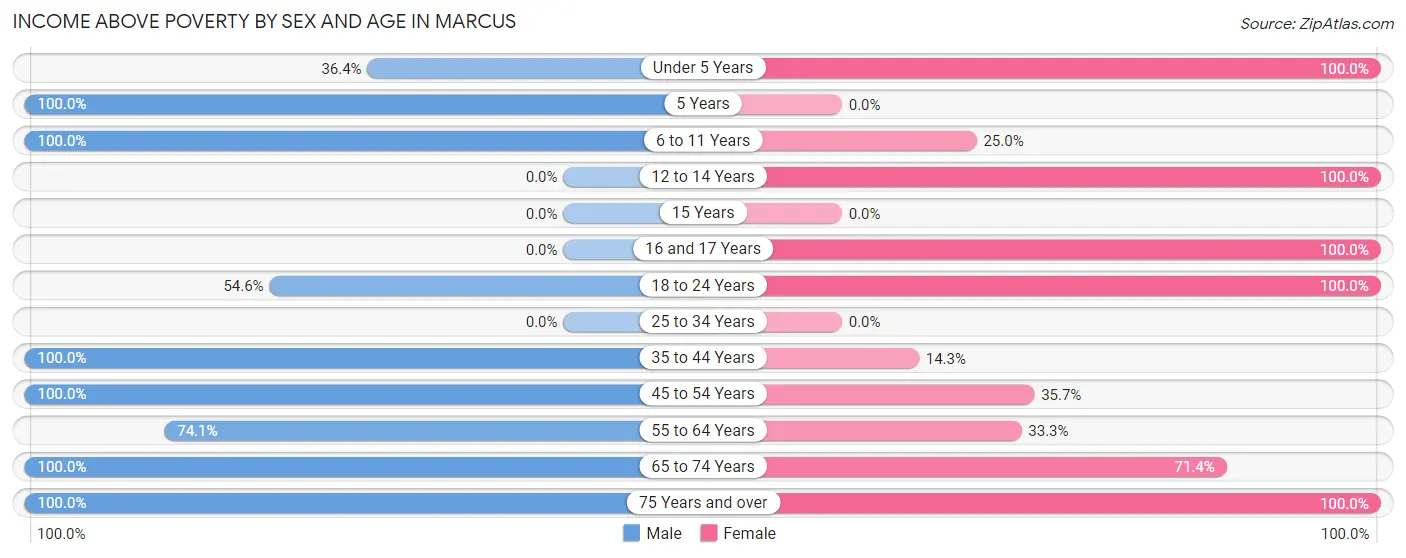
| Age Bracket | Male | Female |
| Under 5 Years | 4 (36.4%) | 3 (100.0%) |
| 5 Years | 1 (100.0%) | 0 (0.0%) |
| 6 to 11 Years | 2 (100.0%) | 2 (25.0%) |
| 12 to 14 Years | 0 (0.0%) | 2 (100.0%) |
| 15 Years | 0 (0.0%) | 0 (0.0%) |
| 16 and 17 Years | 0 (0.0%) | 3 (100.0%) |
| 18 to 24 Years | 6 (54.5%) | 4 (100.0%) |
| 25 to 34 Years | 0 (0.0%) | 0 (0.0%) |
| 35 to 44 Years | 14 (100.0%) | 1 (14.3%) |
| 45 to 54 Years | 6 (100.0%) | 5 (35.7%) |
| 55 to 64 Years | 20 (74.1%) | 2 (33.3%) |
| 65 to 74 Years | 9 (100.0%) | 5 (71.4%) |
| 75 Years and over | 5 (100.0%) | 29 (100.0%) |
| Total | 67 (72.8%) | 56 (62.2%) |
Income Below Poverty Among Married-Couple Families in Marcus
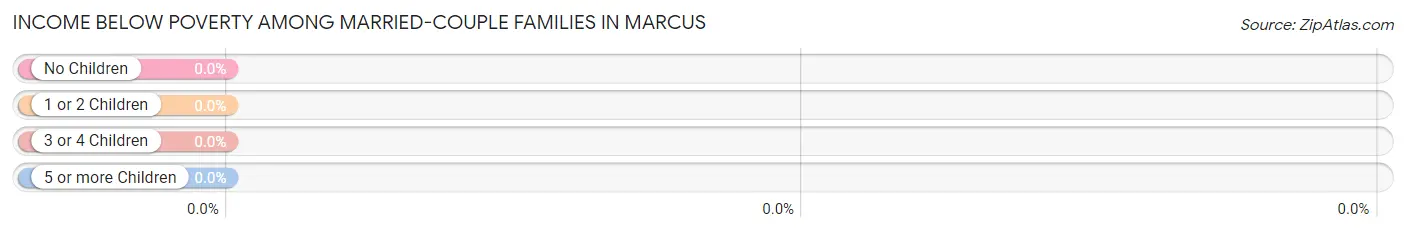
| Children | Above Poverty | Below Poverty |
| No Children | 14 (100.0%) | 0 (0.0%) |
| 1 or 2 Children | 3 (100.0%) | 0 (0.0%) |
| 3 or 4 Children | 2 (100.0%) | 0 (0.0%) |
| 5 or more Children | 0 (0.0%) | 0 (0.0%) |
| Total | 19 (100.0%) | 0 (0.0%) |
Income Below Poverty Among Single-Parent Households in Marcus
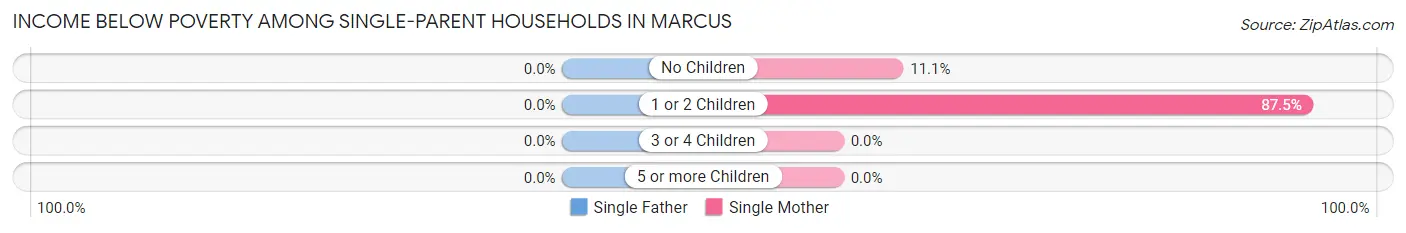
| Children | Single Father | Single Mother |
| No Children | 0 (0.0%) | 3 (11.1%) |
| 1 or 2 Children | 0 (0.0%) | 7 (87.5%) |
| 3 or 4 Children | 0 (0.0%) | 0 (0.0%) |
| 5 or more Children | 0 (0.0%) | 0 (0.0%) |
| Total | 0 (0.0%) | 10 (28.6%) |
Income Below Poverty Among Married-Couple vs Single-Parent Households in Marcus
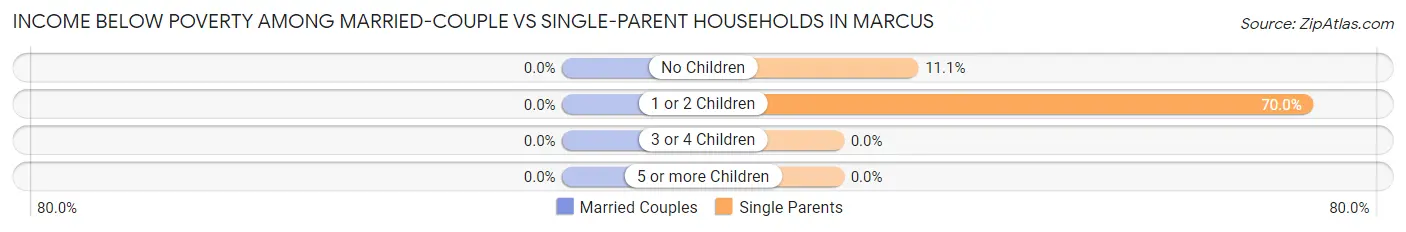
| Children | Married-Couple Families | Single-Parent Households |
| No Children | 0 (0.0%) | 3 (11.1%) |
| 1 or 2 Children | 0 (0.0%) | 7 (70.0%) |
| 3 or 4 Children | 0 (0.0%) | 0 (0.0%) |
| 5 or more Children | 0 (0.0%) | 0 (0.0%) |
| Total | 0 (0.0%) | 10 (27.0%) |
Race in Marcus
The most populous races in Marcus are White / Caucasian (142 | 78.0%), Native / Alaskan (17 | 9.3%), and Some other Race (15 | 8.2%).
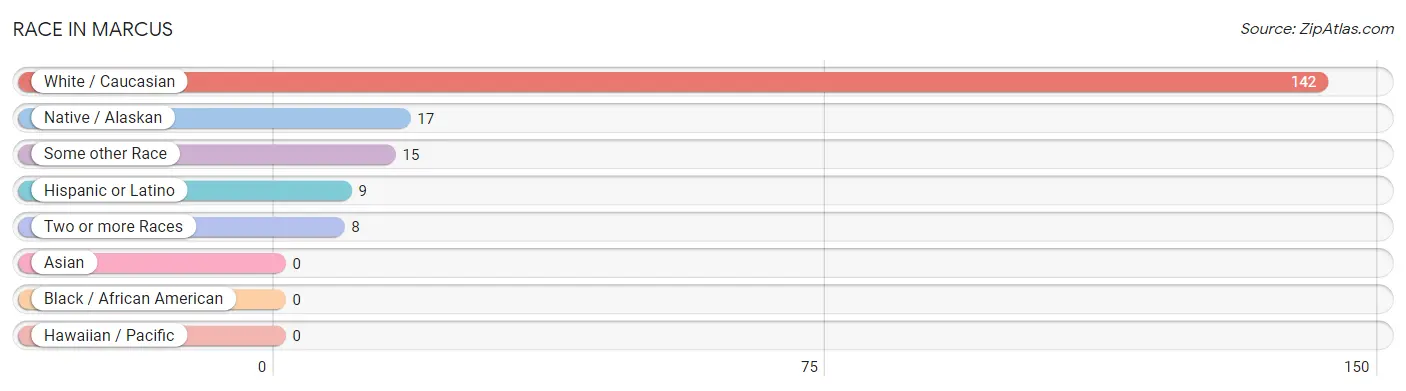
| Race | # Population | % Population |
| Asian | 0 | 0.0% |
| Black / African American | 0 | 0.0% |
| Hawaiian / Pacific | 0 | 0.0% |
| Hispanic or Latino | 9 | 5.0% |
| Native / Alaskan | 17 | 9.3% |
| White / Caucasian | 142 | 78.0% |
| Two or more Races | 8 | 4.4% |
| Some other Race | 15 | 8.2% |
| Total | 182 | 100.0% |
Ancestry in Marcus
The most populous ancestries reported in Marcus are German (59 | 32.4%), Irish (43 | 23.6%), English (34 | 18.7%), American (22 | 12.1%), and Swedish (22 | 12.1%), together accounting for 98.9% of all Marcus residents.
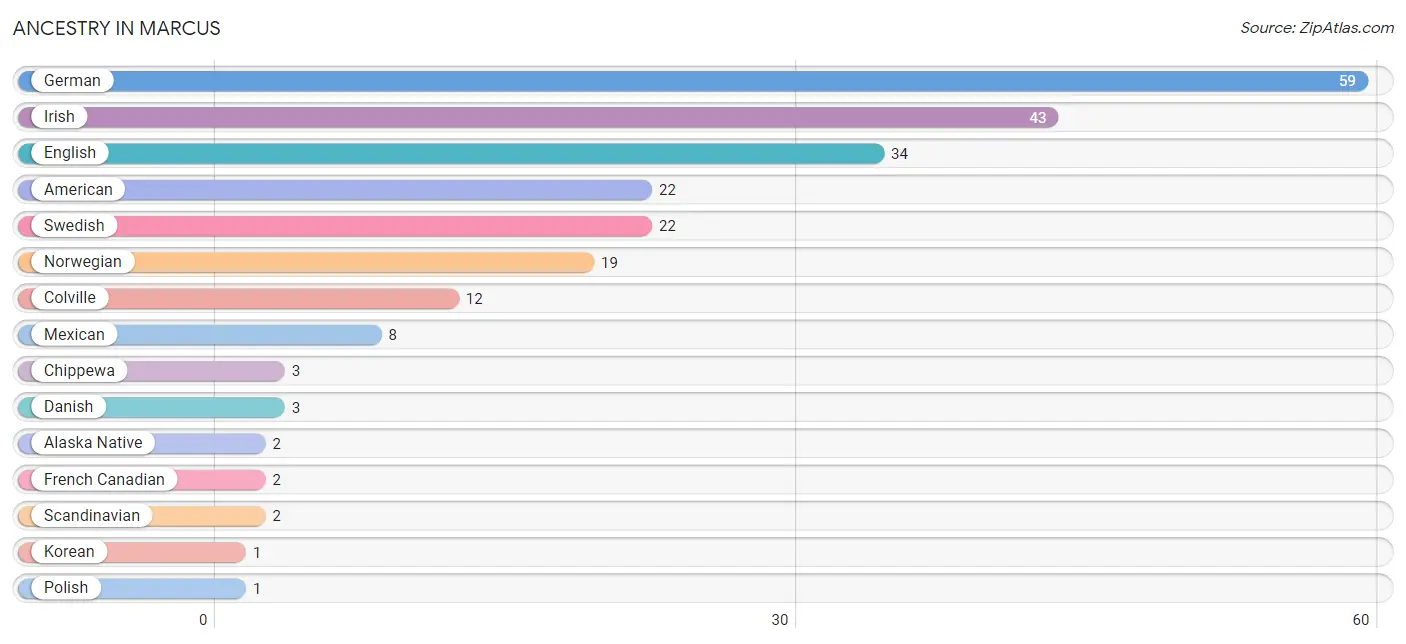
| Ancestry | # Population | % Population |
| Alaska Native | 2 | 1.1% |
| American | 22 | 12.1% |
| Chippewa | 3 | 1.7% |
| Colville | 12 | 6.6% |
| Danish | 3 | 1.7% |
| English | 34 | 18.7% |
| French Canadian | 2 | 1.1% |
| German | 59 | 32.4% |
| Irish | 43 | 23.6% |
| Korean | 1 | 0.5% |
| Mexican | 8 | 4.4% |
| Norwegian | 19 | 10.4% |
| Polish | 1 | 0.5% |
| Scandinavian | 2 | 1.1% |
| Scottish | 1 | 0.5% |
| Spanish | 1 | 0.5% |
| Swedish | 22 | 12.1% |
| Ukrainian | 1 | 0.5% | View All 18 Rows |
Immigrants in Marcus

| Immigration Origin | # Population | % Population | View All 0 Rows |
Sex and Age in Marcus
Sex and Age in Marcus
The most populous age groups in Marcus are 60 to 64 Years (25 | 27.2%) for men and 85 Years and over (24 | 26.7%) for women.
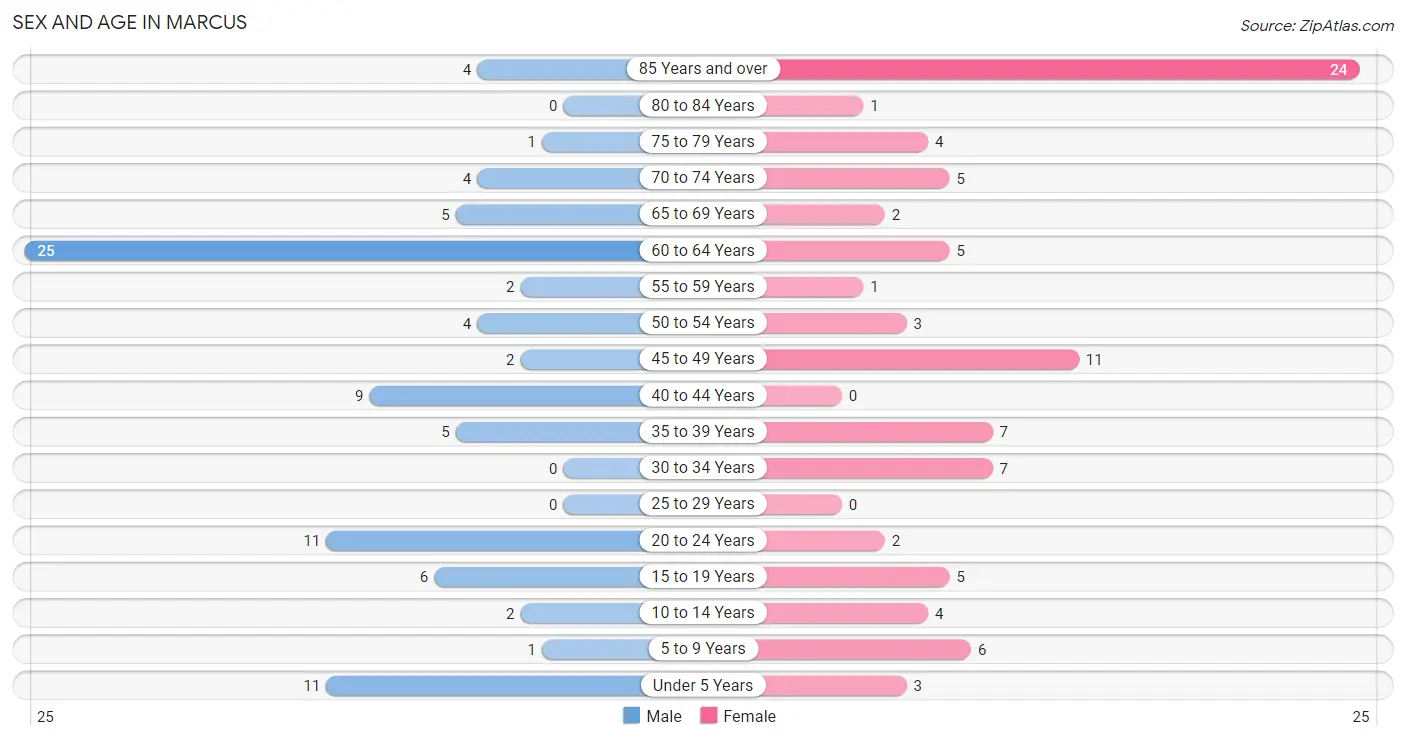
| Age Bracket | Male | Female |
| Under 5 Years | 11 (12.0%) | 3 (3.3%) |
| 5 to 9 Years | 1 (1.1%) | 6 (6.7%) |
| 10 to 14 Years | 2 (2.2%) | 4 (4.4%) |
| 15 to 19 Years | 6 (6.5%) | 5 (5.6%) |
| 20 to 24 Years | 11 (12.0%) | 2 (2.2%) |
| 25 to 29 Years | 0 (0.0%) | 0 (0.0%) |
| 30 to 34 Years | 0 (0.0%) | 7 (7.8%) |
| 35 to 39 Years | 5 (5.4%) | 7 (7.8%) |
| 40 to 44 Years | 9 (9.8%) | 0 (0.0%) |
| 45 to 49 Years | 2 (2.2%) | 11 (12.2%) |
| 50 to 54 Years | 4 (4.3%) | 3 (3.3%) |
| 55 to 59 Years | 2 (2.2%) | 1 (1.1%) |
| 60 to 64 Years | 25 (27.2%) | 5 (5.6%) |
| 65 to 69 Years | 5 (5.4%) | 2 (2.2%) |
| 70 to 74 Years | 4 (4.3%) | 5 (5.6%) |
| 75 to 79 Years | 1 (1.1%) | 4 (4.4%) |
| 80 to 84 Years | 0 (0.0%) | 1 (1.1%) |
| 85 Years and over | 4 (4.3%) | 24 (26.7%) |
| Total | 92 (100.0%) | 90 (100.0%) |
Families and Households in Marcus
Median Family Size in Marcus
The median family size in Marcus is 2.41 persons per family, with single male/father families (2 | 3.6%) accounting for the largest median family size of 3.5 persons per family. On the other hand, single female/mother families (35 | 62.5%) represent the smallest median family size with 2.34 persons per family.
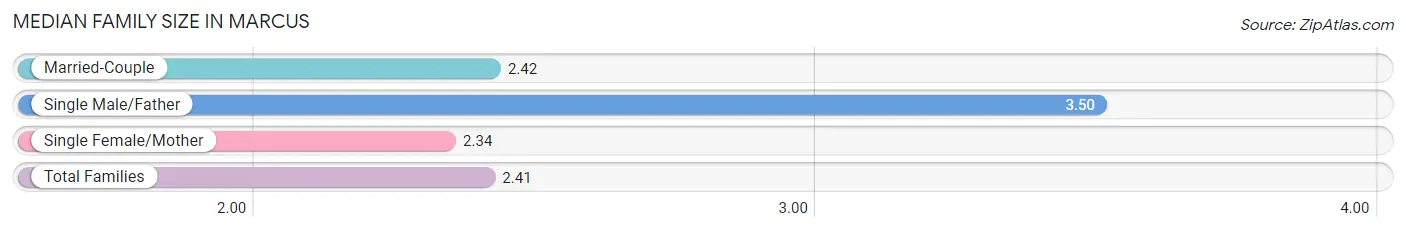
| Family Type | # Families | Family Size |
| Married-Couple | 19 (33.9%) | 2.42 |
| Single Male/Father | 2 (3.6%) | 3.50 |
| Single Female/Mother | 35 (62.5%) | 2.34 |
| Total Families | 56 (100.0%) | 2.41 |
Median Household Size in Marcus
The median household size in Marcus is 2.30 persons per household, with single male/father households (2 | 2.5%) accounting for the largest median household size of 5.5 persons per household. non-family households (23 | 29.1%) represent the smallest median household size with 1.57 persons per household.
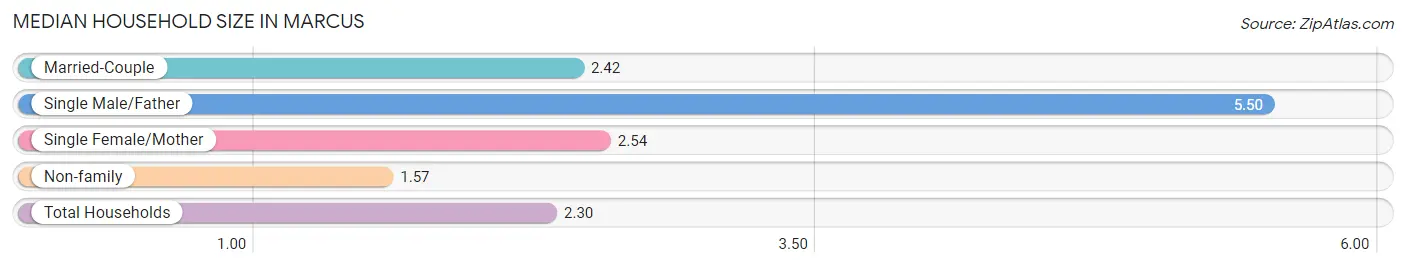
| Household Type | # Households | Household Size |
| Married-Couple | 19 (24.0%) | 2.42 |
| Single Male/Father | 2 (2.5%) | 5.50 |
| Single Female/Mother | 35 (44.3%) | 2.54 |
| Non-family | 23 (29.1%) | 1.57 |
| Total Households | 79 (100.0%) | 2.30 |
Household Size by Marriage Status in Marcus
Out of a total of 79 households in Marcus, 56 (70.9%) are family households, while 23 (29.1%) are nonfamily households. The most numerous type of family households are 2-person households, comprising 38, and the most common type of nonfamily households are 2-person households, comprising 14.
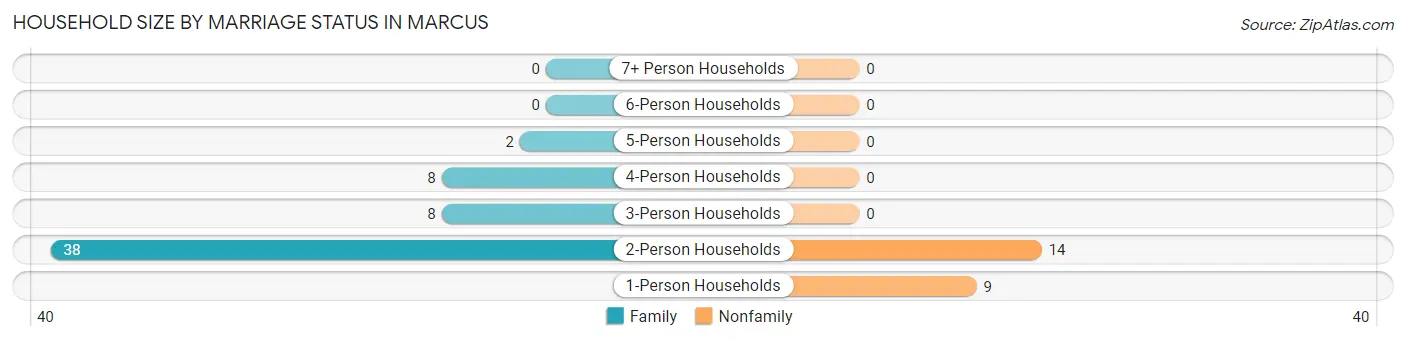
| Household Size | Family Households | Nonfamily Households |
| 1-Person Households | - | 9 (11.4%) |
| 2-Person Households | 38 (48.1%) | 14 (17.7%) |
| 3-Person Households | 8 (10.1%) | 0 (0.0%) |
| 4-Person Households | 8 (10.1%) | 0 (0.0%) |
| 5-Person Households | 2 (2.5%) | 0 (0.0%) |
| 6-Person Households | 0 (0.0%) | 0 (0.0%) |
| 7+ Person Households | 0 (0.0%) | 0 (0.0%) |
| Total | 56 (70.9%) | 23 (29.1%) |
Female Fertility in Marcus
Fertility by Age in Marcus
| Age Bracket | Women with Births | Births / 1,000 Women |
| 15 to 19 years | 0 (0.0%) | 0.0 |
| 20 to 34 years | 0 (0.0%) | 0.0 |
| 35 to 50 years | 0 (0.0%) | 0.0 |
| Total | 0 (0.0%) | 0.0 |
Fertility by Age by Marriage Status in Marcus
| Age Bracket | Married | Unmarried |
| 15 to 19 years | 0 (0.0%) | 0 (0.0%) |
| 20 to 34 years | 0 (0.0%) | 0 (0.0%) |
| 35 to 50 years | 0 (0.0%) | 0 (0.0%) |
| Total | 0 (0.0%) | 0 (0.0%) |
Fertility by Education in Marcus
| Educational Attainment | Women with Births | Births / 1,000 Women |
| Less than High School | 0 (0.0%) | 0.0 |
| High School Diploma | 0 (0.0%) | 0.0 |
| College or Associate's Degree | 0 (0.0%) | 0.0 |
| Bachelor's Degree | 0 (0.0%) | 0.0 |
| Graduate Degree | 0 (0.0%) | 0.0 |
| Total | 0 (0.0%) | 0.0 |
Fertility by Education by Marriage Status in Marcus
| Educational Attainment | Married | Unmarried |
| Less than High School | 0 (0.0%) | 0 (0.0%) |
| High School Diploma | 0 (0.0%) | 0 (0.0%) |
| College or Associate's Degree | 0 (0.0%) | 0 (0.0%) |
| Bachelor's Degree | 0 (0.0%) | 0 (0.0%) |
| Graduate Degree | 0 (0.0%) | 0 (0.0%) |
| Total | 0 (0.0%) | 0 (0.0%) |
Employment Characteristics in Marcus
Employment by Class of Employer in Marcus
Among the 40 employed individuals in Marcus, private company employees (36 | 90.0%), self-employed (not incorporated) (2 | 5.0%), and federal government employees (2 | 5.0%) make up the most common classes of employment.
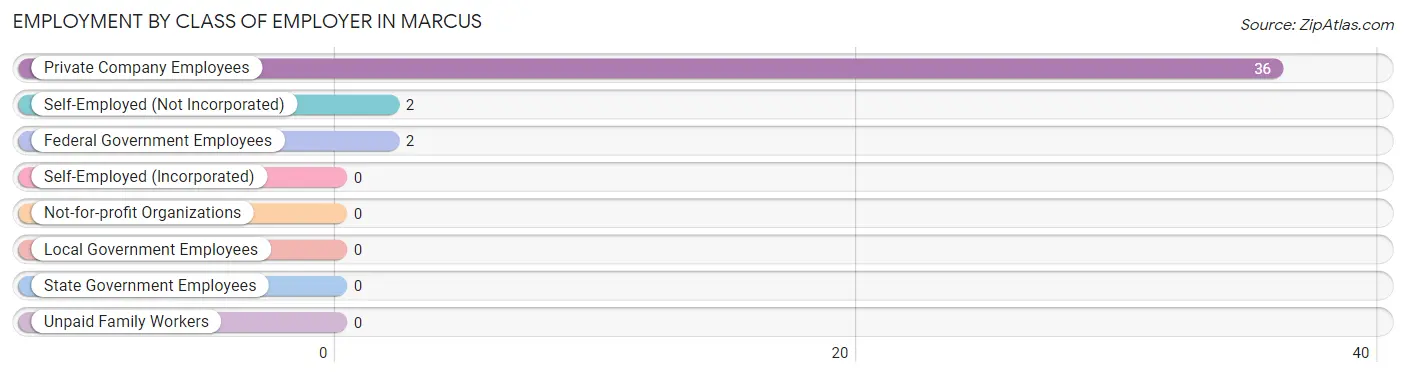
| Employer Class | # Employees | % Employees |
| Private Company Employees | 36 | 90.0% |
| Self-Employed (Incorporated) | 0 | 0.0% |
| Self-Employed (Not Incorporated) | 2 | 5.0% |
| Not-for-profit Organizations | 0 | 0.0% |
| Local Government Employees | 0 | 0.0% |
| State Government Employees | 0 | 0.0% |
| Federal Government Employees | 2 | 5.0% |
| Unpaid Family Workers | 0 | 0.0% |
| Total | 40 | 100.0% |
Employment Status by Age in Marcus
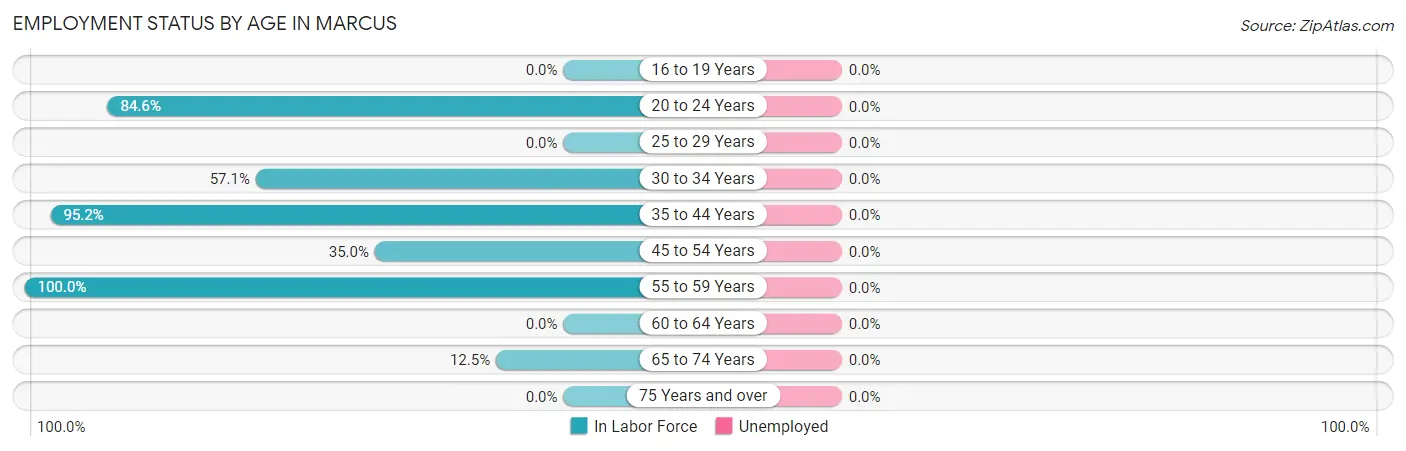
| Age Bracket | In Labor Force | Unemployed |
| 16 to 19 Years | 0 (0.0%) | 0 (0.0%) |
| 20 to 24 Years | 11 (84.6%) | 0 (0.0%) |
| 25 to 29 Years | 0 (0.0%) | 0 (0.0%) |
| 30 to 34 Years | 4 (57.1%) | 0 (0.0%) |
| 35 to 44 Years | 20 (95.2%) | 0 (0.0%) |
| 45 to 54 Years | 7 (35.0%) | 0 (0.0%) |
| 55 to 59 Years | 3 (100.0%) | 0 (0.0%) |
| 60 to 64 Years | 0 (0.0%) | 0 (0.0%) |
| 65 to 74 Years | 2 (12.5%) | 0 (0.0%) |
| 75 Years and over | 0 (0.0%) | 0 (0.0%) |
| Total | 47 (30.3%) | 0 (0.0%) |
Employment Status by Educational Attainment in Marcus
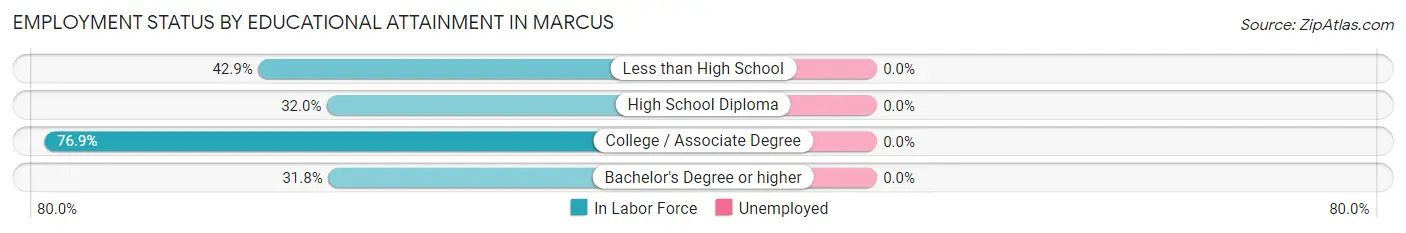
| Educational Attainment | In Labor Force | Unemployed |
| Less than High School | 9 (42.9%) | 0 (0.0%) |
| High School Diploma | 8 (32.0%) | 0 (0.0%) |
| College / Associate Degree | 10 (76.9%) | 0 (0.0%) |
| Bachelor's Degree or higher | 7 (31.8%) | 0 (0.0%) |
| Total | 34 (42.0%) | 0 (0.0%) |
Employment Occupations by Sex in Marcus
Management, Business, Science and Arts Occupations
The most common Management, Business, Science and Arts occupations in Marcus are Business & Financial (2 | 4.3%), and Health Diagnosing & Treating (1 | 2.1%).
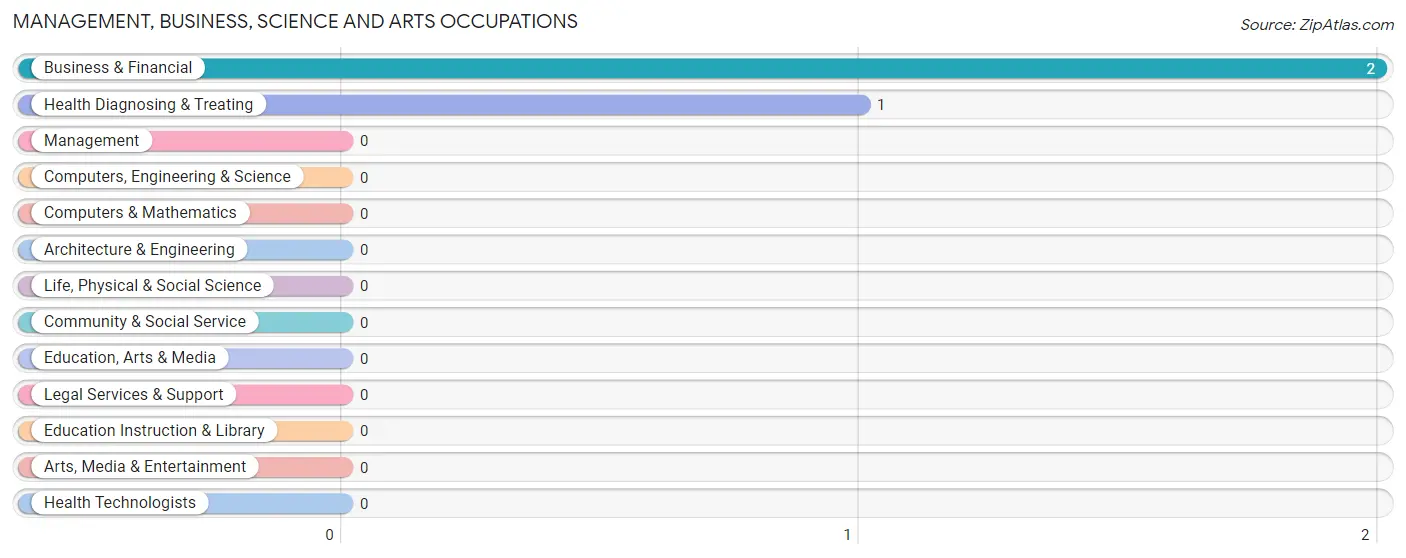
Management, Business, Science and Arts Occupations by Sex
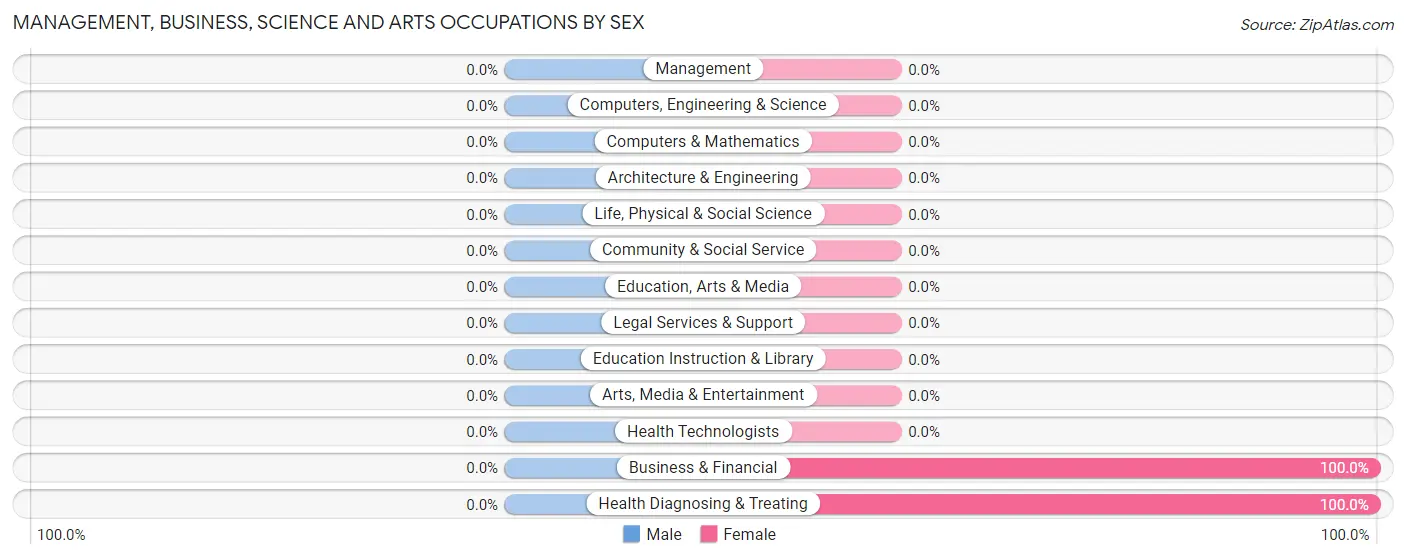
| Occupation | Male | Female |
| Management | 0 (0.0%) | 0 (0.0%) |
| Business & Financial | 0 (0.0%) | 2 (100.0%) |
| Computers, Engineering & Science | 0 (0.0%) | 0 (0.0%) |
| Computers & Mathematics | 0 (0.0%) | 0 (0.0%) |
| Architecture & Engineering | 0 (0.0%) | 0 (0.0%) |
| Life, Physical & Social Science | 0 (0.0%) | 0 (0.0%) |
| Community & Social Service | 0 (0.0%) | 0 (0.0%) |
| Education, Arts & Media | 0 (0.0%) | 0 (0.0%) |
| Legal Services & Support | 0 (0.0%) | 0 (0.0%) |
| Education Instruction & Library | 0 (0.0%) | 0 (0.0%) |
| Arts, Media & Entertainment | 0 (0.0%) | 0 (0.0%) |
| Health Diagnosing & Treating | 0 (0.0%) | 1 (100.0%) |
| Health Technologists | 0 (0.0%) | 0 (0.0%) |
| Total (Category) | 0 (0.0%) | 3 (100.0%) |
| Total (Overall) | 27 (57.5%) | 20 (42.5%) |
Services Occupations
The most common Services occupations in Marcus are Cleaning & Maintenance (4 | 8.5%), and Healthcare Support (1 | 2.1%).
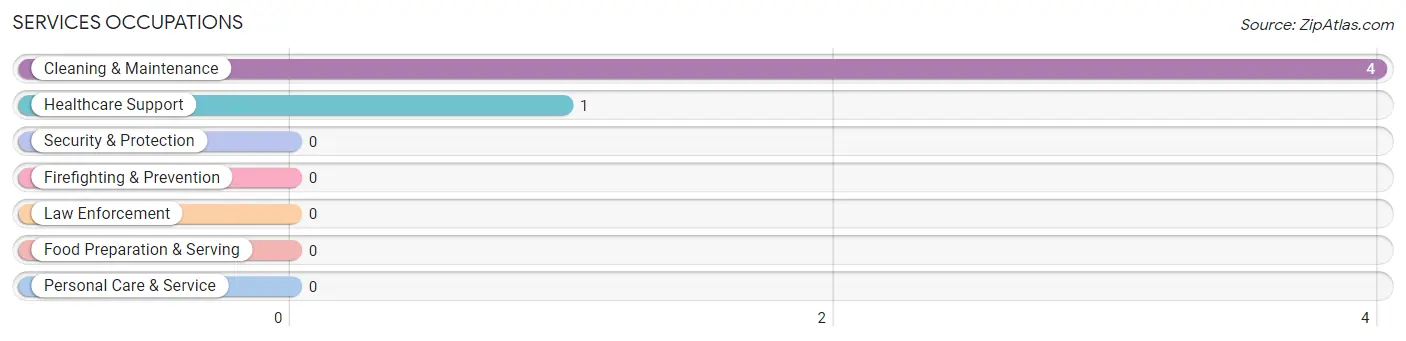
Services Occupations by Sex
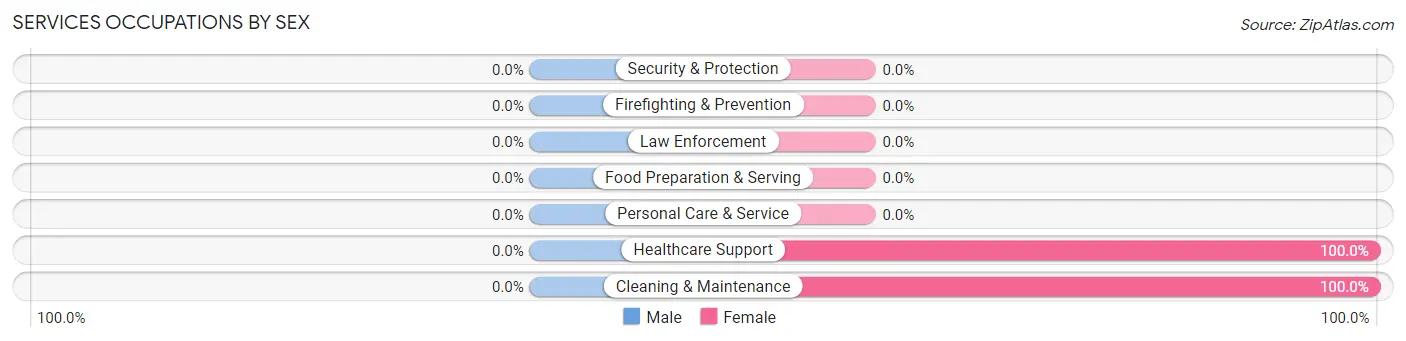
| Occupation | Male | Female |
| Healthcare Support | 0 (0.0%) | 1 (100.0%) |
| Security & Protection | 0 (0.0%) | 0 (0.0%) |
| Firefighting & Prevention | 0 (0.0%) | 0 (0.0%) |
| Law Enforcement | 0 (0.0%) | 0 (0.0%) |
| Food Preparation & Serving | 0 (0.0%) | 0 (0.0%) |
| Cleaning & Maintenance | 0 (0.0%) | 4 (100.0%) |
| Personal Care & Service | 0 (0.0%) | 0 (0.0%) |
| Total (Category) | 0 (0.0%) | 5 (100.0%) |
| Total (Overall) | 27 (57.5%) | 20 (42.5%) |
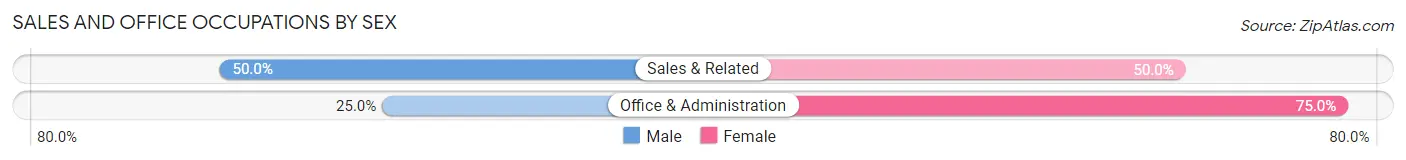
Sales and Office Occupations
The most common Sales and Office occupations in Marcus are Office & Administration (8 | 17.0%), and Sales & Related (4 | 8.5%).
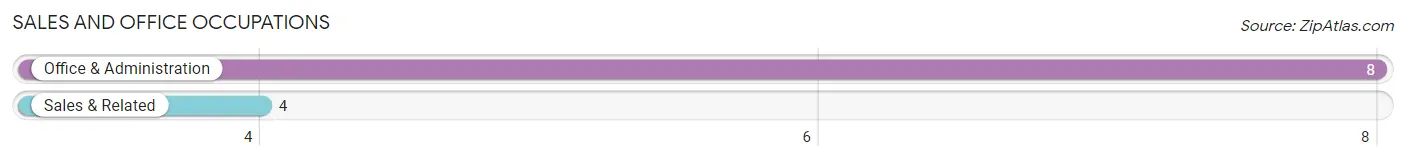
Sales and Office Occupations by Sex
| Occupation | Male | Female |
| Sales & Related | 2 (50.0%) | 2 (50.0%) |
| Office & Administration | 2 (25.0%) | 6 (75.0%) |
| Total (Category) | 4 (33.3%) | 8 (66.7%) |
| Total (Overall) | 27 (57.5%) | 20 (42.5%) |
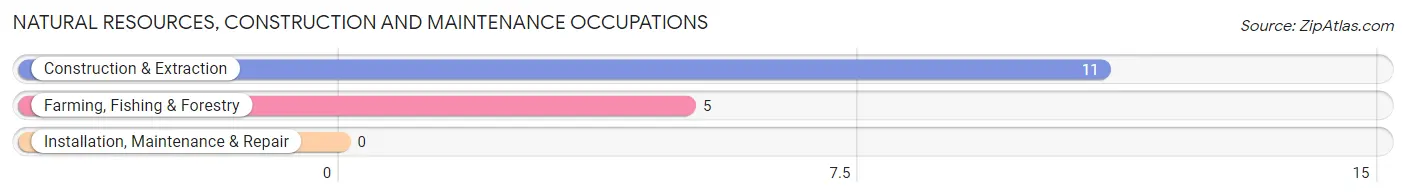
Natural Resources, Construction and Maintenance Occupations
The most common Natural Resources, Construction and Maintenance occupations in Marcus are Construction & Extraction (11 | 23.4%), and Farming, Fishing & Forestry (5 | 10.6%).
Natural Resources, Construction and Maintenance Occupations by Sex
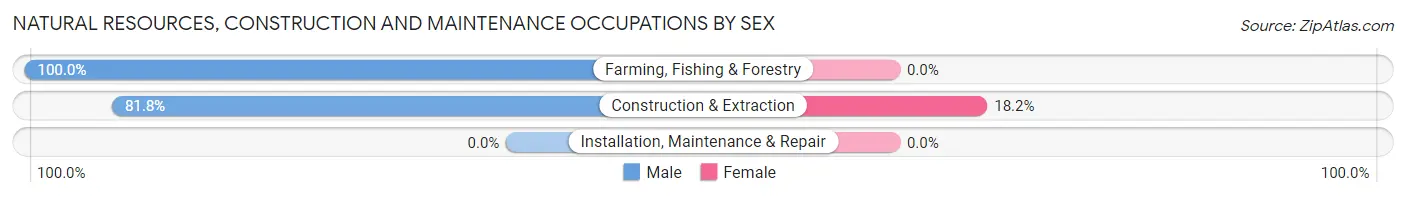
| Occupation | Male | Female |
| Farming, Fishing & Forestry | 5 (100.0%) | 0 (0.0%) |
| Construction & Extraction | 9 (81.8%) | 2 (18.2%) |
| Installation, Maintenance & Repair | 0 (0.0%) | 0 (0.0%) |
| Total (Category) | 14 (87.5%) | 2 (12.5%) |
| Total (Overall) | 27 (57.5%) | 20 (42.5%) |
Production, Transportation and Moving Occupations
The most common Production, Transportation and Moving occupations in Marcus are Production (7 | 14.9%), Transportation (2 | 4.3%), and Material Moving (2 | 4.3%).
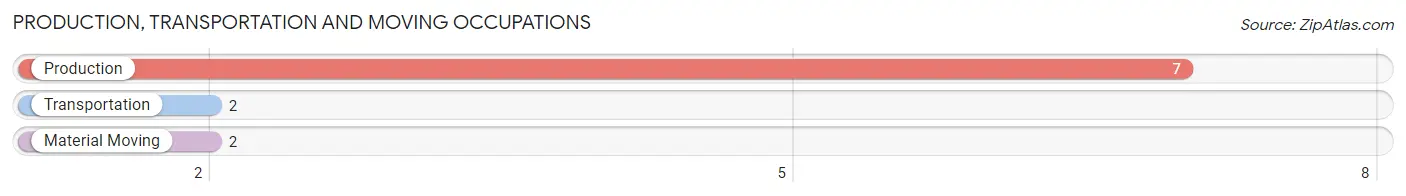
Production, Transportation and Moving Occupations by Sex
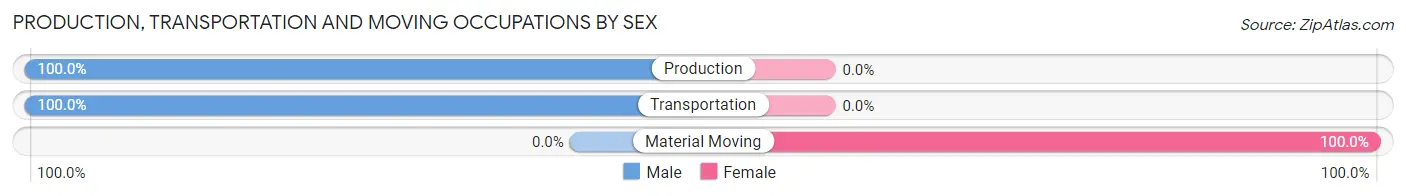
| Occupation | Male | Female |
| Production | 7 (100.0%) | 0 (0.0%) |
| Transportation | 2 (100.0%) | 0 (0.0%) |
| Material Moving | 0 (0.0%) | 2 (100.0%) |
| Total (Category) | 9 (81.8%) | 2 (18.2%) |
| Total (Overall) | 27 (57.5%) | 20 (42.5%) |
Employment Industries by Sex in Marcus
Employment Industries in Marcus
The major employment industries in Marcus include Retail Trade (11 | 23.4%), Construction (9 | 19.2%), Transportation & Warehousing (8 | 17.0%), Agriculture, Fishing & Hunting (7 | 14.9%), and Administrative & Support (6 | 12.8%).
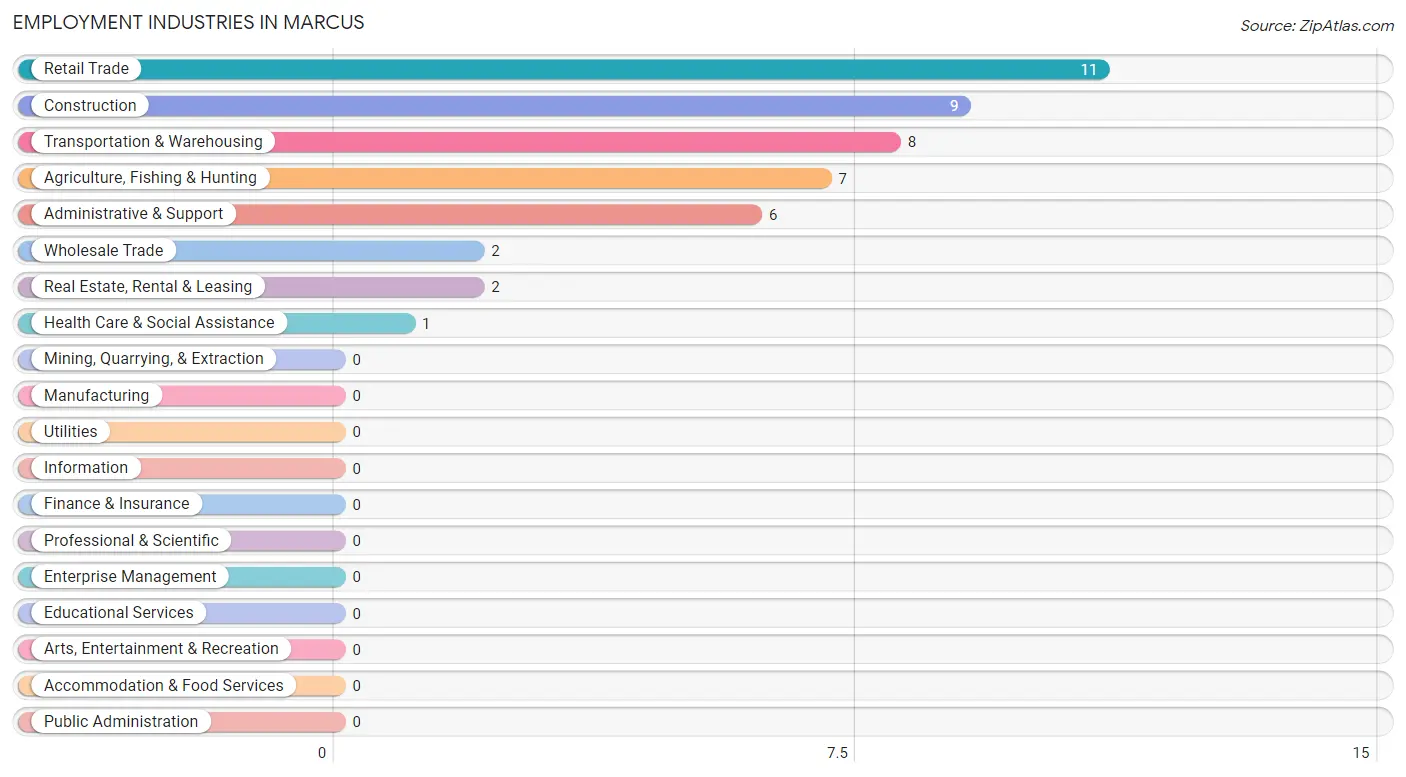
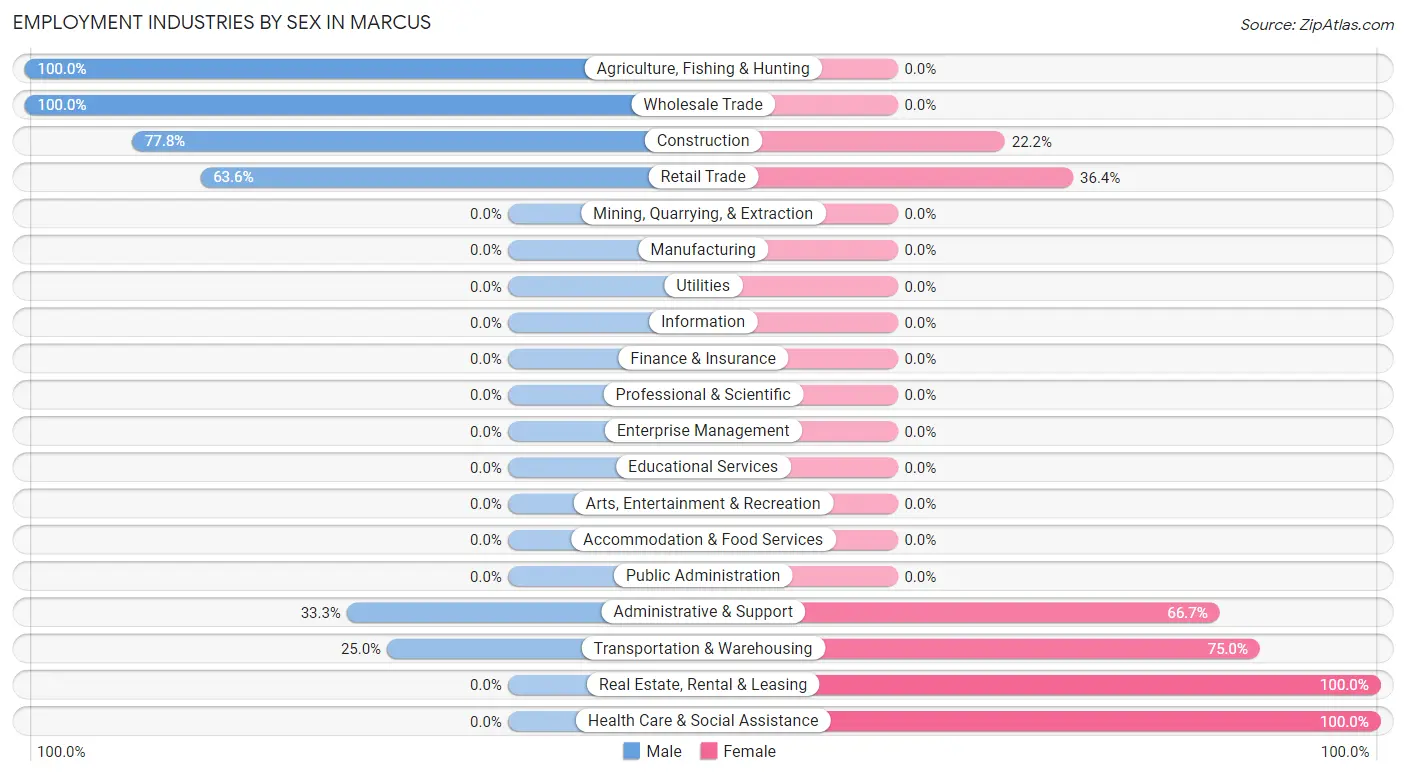
Employment Industries by Sex in Marcus
The Marcus industries that see more men than women are Agriculture, Fishing & Hunting (100.0%), Wholesale Trade (100.0%), and Construction (77.8%), whereas the industries that tend to have a higher number of women are Real Estate, Rental & Leasing (100.0%), Health Care & Social Assistance (100.0%), and Transportation & Warehousing (75.0%).
| Industry | Male | Female |
| Agriculture, Fishing & Hunting | 7 (100.0%) | 0 (0.0%) |
| Mining, Quarrying, & Extraction | 0 (0.0%) | 0 (0.0%) |
| Construction | 7 (77.8%) | 2 (22.2%) |
| Manufacturing | 0 (0.0%) | 0 (0.0%) |
| Wholesale Trade | 2 (100.0%) | 0 (0.0%) |
| Retail Trade | 7 (63.6%) | 4 (36.4%) |
| Transportation & Warehousing | 2 (25.0%) | 6 (75.0%) |
| Utilities | 0 (0.0%) | 0 (0.0%) |
| Information | 0 (0.0%) | 0 (0.0%) |
| Finance & Insurance | 0 (0.0%) | 0 (0.0%) |
| Real Estate, Rental & Leasing | 0 (0.0%) | 2 (100.0%) |
| Professional & Scientific | 0 (0.0%) | 0 (0.0%) |
| Enterprise Management | 0 (0.0%) | 0 (0.0%) |
| Administrative & Support | 2 (33.3%) | 4 (66.7%) |
| Educational Services | 0 (0.0%) | 0 (0.0%) |
| Health Care & Social Assistance | 0 (0.0%) | 1 (100.0%) |
| Arts, Entertainment & Recreation | 0 (0.0%) | 0 (0.0%) |
| Accommodation & Food Services | 0 (0.0%) | 0 (0.0%) |
| Public Administration | 0 (0.0%) | 0 (0.0%) |
| Total | 27 (57.5%) | 20 (42.5%) |
Education in Marcus
School Enrollment in Marcus
The most common levels of schooling among the 28 students in Marcus are elementary school (8 | 28.6%), high school (8 | 28.6%), and nursery / preschool (6 | 21.4%).
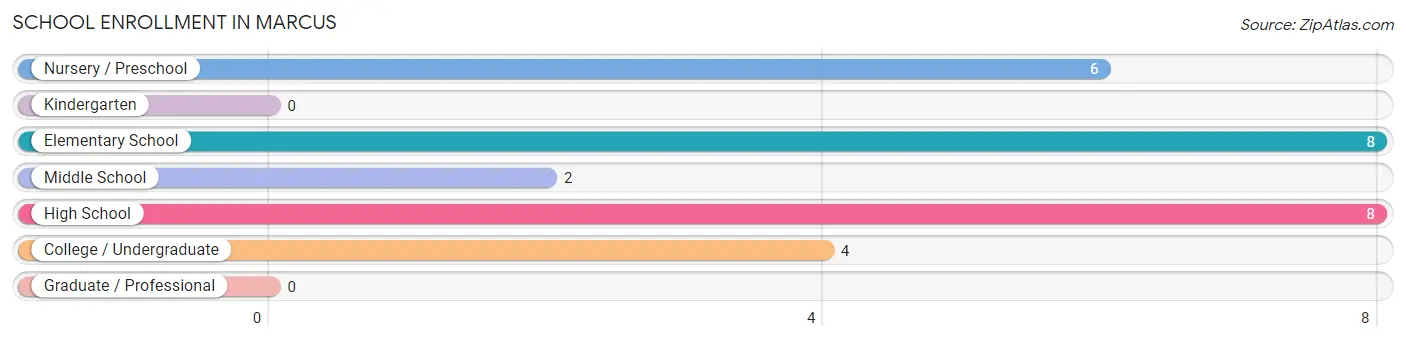
| School Level | # Students | % Students |
| Nursery / Preschool | 6 | 21.4% |
| Kindergarten | 0 | 0.0% |
| Elementary School | 8 | 28.6% |
| Middle School | 2 | 7.1% |
| High School | 8 | 28.6% |
| College / Undergraduate | 4 | 14.3% |
| Graduate / Professional | 0 | 0.0% |
| Total | 28 | 100.0% |
School Enrollment by Age by Funding Source in Marcus
Out of a total of 28 students who are enrolled in schools in Marcus, 9 (32.1%) attend a private institution, while the remaining 19 (67.9%) are enrolled in public schools. The age group of 20 to 24 year olds has the highest likelihood of being enrolled in private schools, with 2 (100.0% in the age bracket) enrolled. Conversely, the age group of 15 to 17 year olds has the lowest likelihood of being enrolled in a private school, with 3 (100.0% in the age bracket) attending a public institution.
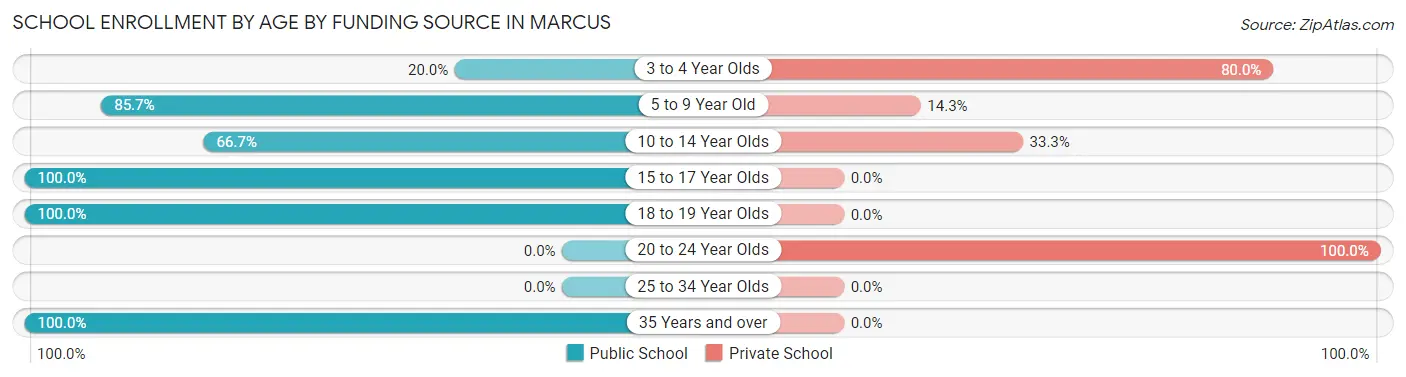
| Age Bracket | Public School | Private School |
| 3 to 4 Year Olds | 1 (20.0%) | 4 (80.0%) |
| 5 to 9 Year Old | 6 (85.7%) | 1 (14.3%) |
| 10 to 14 Year Olds | 4 (66.7%) | 2 (33.3%) |
| 15 to 17 Year Olds | 3 (100.0%) | 0 (0.0%) |
| 18 to 19 Year Olds | 2 (100.0%) | 0 (0.0%) |
| 20 to 24 Year Olds | 0 (0.0%) | 2 (100.0%) |
| 25 to 34 Year Olds | 0 (0.0%) | 0 (0.0%) |
| 35 Years and over | 3 (100.0%) | 0 (0.0%) |
| Total | 19 (67.9%) | 9 (32.1%) |
Educational Attainment by Field of Study in Marcus
Engineering (15 | 57.7%), literature & languages (5 | 19.2%), science & technology (2 | 7.7%), business (2 | 7.7%), and visual & performing arts (2 | 7.7%) are the most common fields of study among 26 individuals in Marcus who have obtained a bachelor's degree or higher.
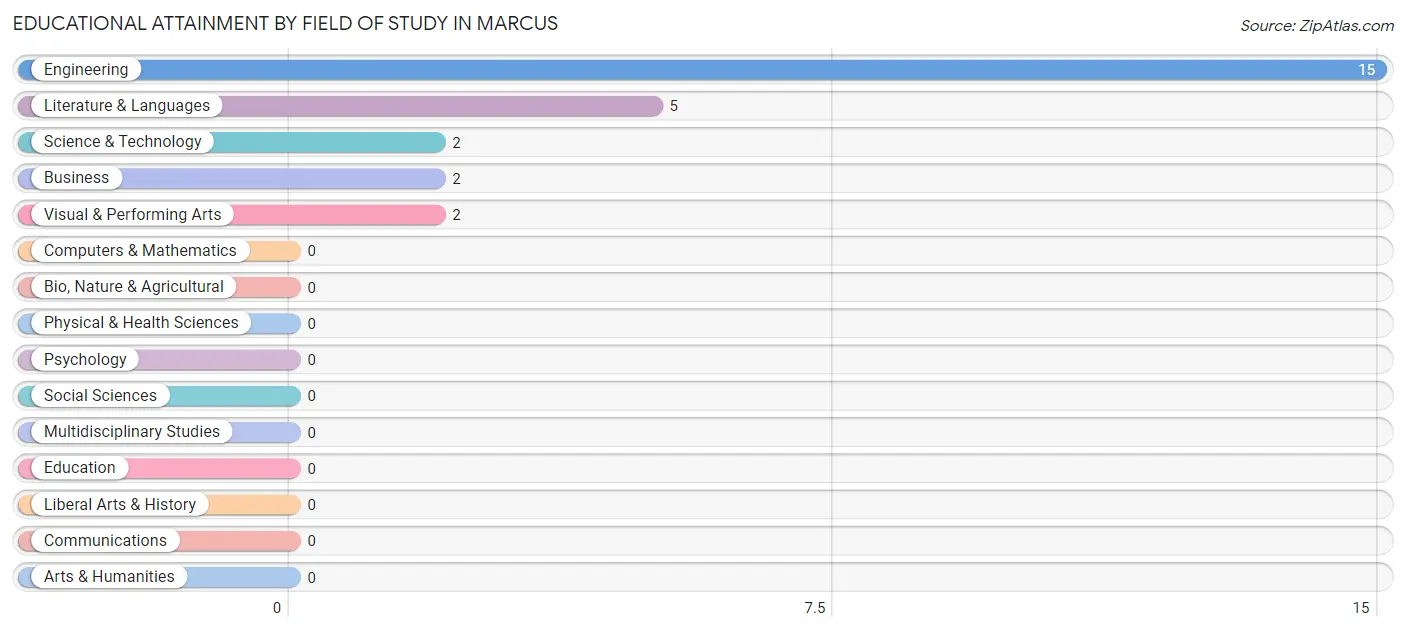
| Field of Study | # Graduates | % Graduates |
| Computers & Mathematics | 0 | 0.0% |
| Bio, Nature & Agricultural | 0 | 0.0% |
| Physical & Health Sciences | 0 | 0.0% |
| Psychology | 0 | 0.0% |
| Social Sciences | 0 | 0.0% |
| Engineering | 15 | 57.7% |
| Multidisciplinary Studies | 0 | 0.0% |
| Science & Technology | 2 | 7.7% |
| Business | 2 | 7.7% |
| Education | 0 | 0.0% |
| Literature & Languages | 5 | 19.2% |
| Liberal Arts & History | 0 | 0.0% |
| Visual & Performing Arts | 2 | 7.7% |
| Communications | 0 | 0.0% |
| Arts & Humanities | 0 | 0.0% |
| Total | 26 | 100.0% |
Transportation & Commute in Marcus
Vehicle Availability by Sex in Marcus
The most prevalent vehicle ownership categories in Marcus are males with 3 vehicles (20, accounting for 80.0%) and females with 3 vehicles (4, making up 133.3%).
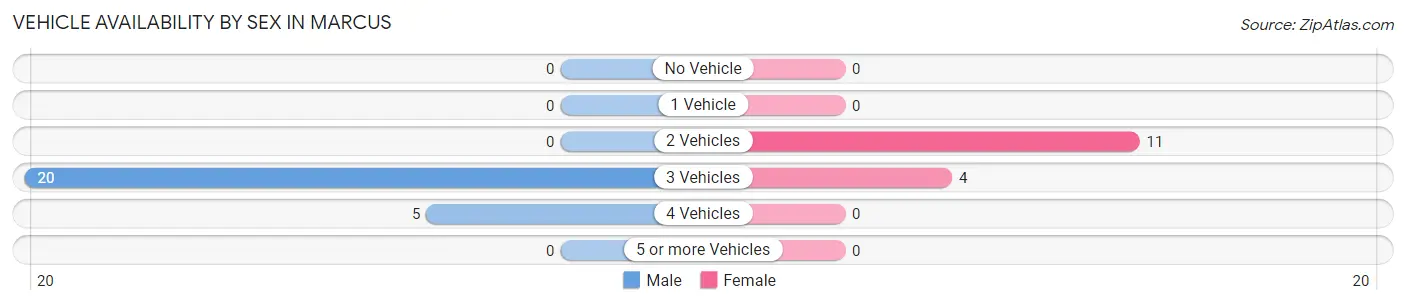
| Vehicles Available | Male | Female |
| No Vehicle | 0 (0.0%) | 0 (0.0%) |
| 1 Vehicle | 0 (0.0%) | 0 (0.0%) |
| 2 Vehicles | 0 (0.0%) | 11 (73.3%) |
| 3 Vehicles | 20 (80.0%) | 4 (26.7%) |
| 4 Vehicles | 5 (20.0%) | 0 (0.0%) |
| 5 or more Vehicles | 0 (0.0%) | 0 (0.0%) |
| Total | 25 (100.0%) | 15 (100.0%) |
Commute Time in Marcus
The most frequently occuring commute durations in Marcus are 15 to 19 minutes (15 commuters, 39.5%), 30 to 34 minutes (13 commuters, 34.2%), and 10 to 14 minutes (7 commuters, 18.4%).
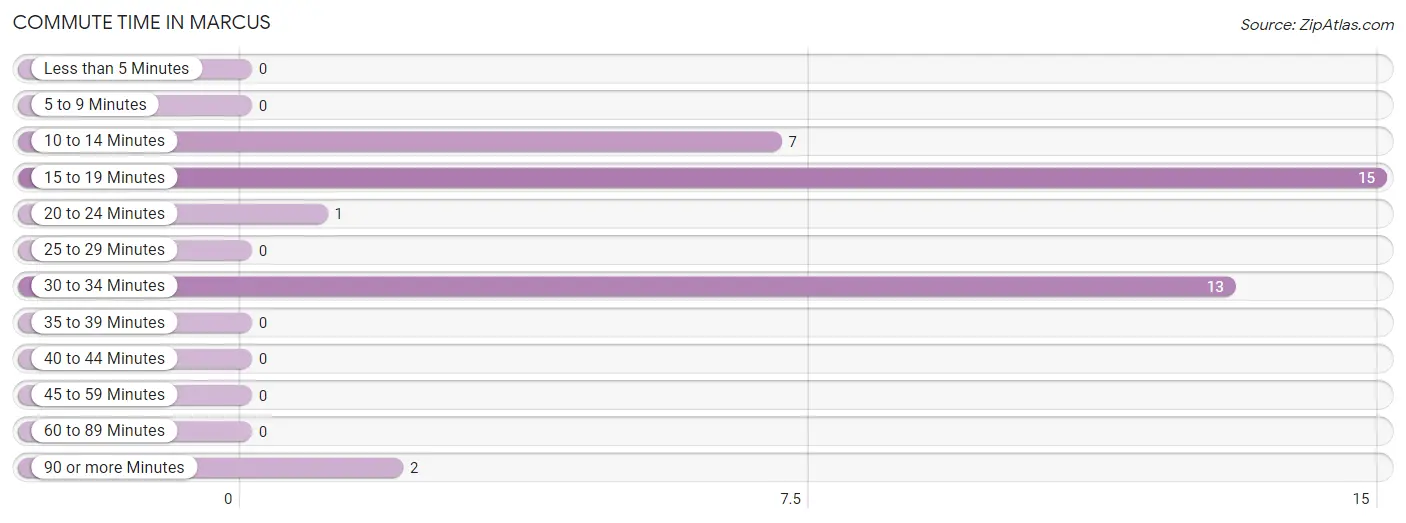
| Commute Time | # Commuters | % Commuters |
| Less than 5 Minutes | 0 | 0.0% |
| 5 to 9 Minutes | 0 | 0.0% |
| 10 to 14 Minutes | 7 | 18.4% |
| 15 to 19 Minutes | 15 | 39.5% |
| 20 to 24 Minutes | 1 | 2.6% |
| 25 to 29 Minutes | 0 | 0.0% |
| 30 to 34 Minutes | 13 | 34.2% |
| 35 to 39 Minutes | 0 | 0.0% |
| 40 to 44 Minutes | 0 | 0.0% |
| 45 to 59 Minutes | 0 | 0.0% |
| 60 to 89 Minutes | 0 | 0.0% |
| 90 or more Minutes | 2 | 5.3% |
Commute Time by Sex in Marcus
The most common commute times in Marcus are 15 to 19 minutes (9 commuters, 36.0%) for males and 15 to 19 minutes (6 commuters, 46.2%) for females.
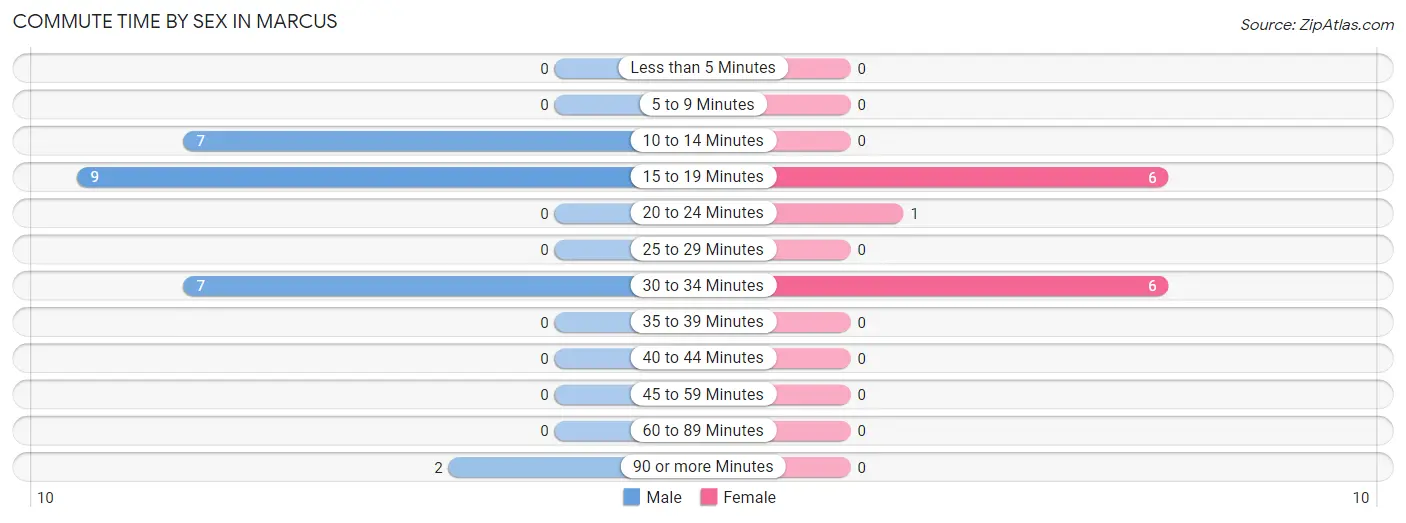
| Commute Time | Male | Female |
| Less than 5 Minutes | 0 (0.0%) | 0 (0.0%) |
| 5 to 9 Minutes | 0 (0.0%) | 0 (0.0%) |
| 10 to 14 Minutes | 7 (28.0%) | 0 (0.0%) |
| 15 to 19 Minutes | 9 (36.0%) | 6 (46.2%) |
| 20 to 24 Minutes | 0 (0.0%) | 1 (7.7%) |
| 25 to 29 Minutes | 0 (0.0%) | 0 (0.0%) |
| 30 to 34 Minutes | 7 (28.0%) | 6 (46.2%) |
| 35 to 39 Minutes | 0 (0.0%) | 0 (0.0%) |
| 40 to 44 Minutes | 0 (0.0%) | 0 (0.0%) |
| 45 to 59 Minutes | 0 (0.0%) | 0 (0.0%) |
| 60 to 89 Minutes | 0 (0.0%) | 0 (0.0%) |
| 90 or more Minutes | 2 (8.0%) | 0 (0.0%) |
Time of Departure to Work by Sex in Marcus
The most frequent times of departure to work in Marcus are 6:30 AM to 6:59 AM (12, 48.0%) for males and 6:30 AM to 6:59 AM (6, 46.2%) for females.
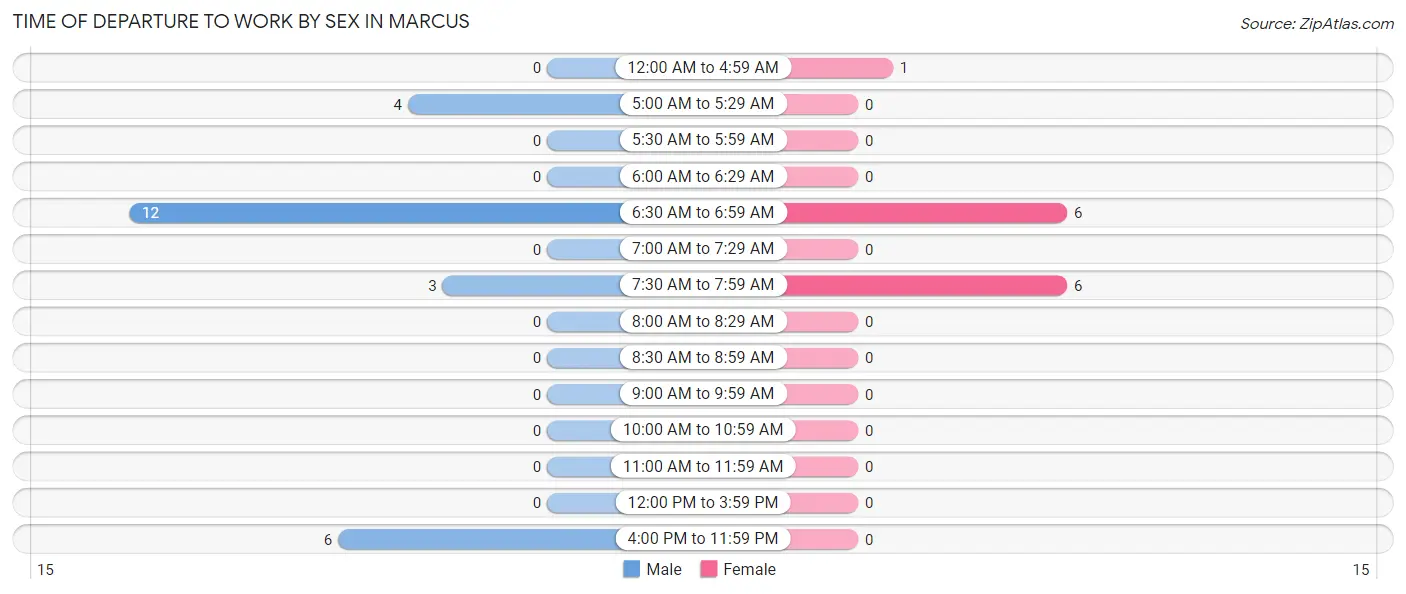
| Time of Departure | Male | Female |
| 12:00 AM to 4:59 AM | 0 (0.0%) | 1 (7.7%) |
| 5:00 AM to 5:29 AM | 4 (16.0%) | 0 (0.0%) |
| 5:30 AM to 5:59 AM | 0 (0.0%) | 0 (0.0%) |
| 6:00 AM to 6:29 AM | 0 (0.0%) | 0 (0.0%) |
| 6:30 AM to 6:59 AM | 12 (48.0%) | 6 (46.2%) |
| 7:00 AM to 7:29 AM | 0 (0.0%) | 0 (0.0%) |
| 7:30 AM to 7:59 AM | 3 (12.0%) | 6 (46.2%) |
| 8:00 AM to 8:29 AM | 0 (0.0%) | 0 (0.0%) |
| 8:30 AM to 8:59 AM | 0 (0.0%) | 0 (0.0%) |
| 9:00 AM to 9:59 AM | 0 (0.0%) | 0 (0.0%) |
| 10:00 AM to 10:59 AM | 0 (0.0%) | 0 (0.0%) |
| 11:00 AM to 11:59 AM | 0 (0.0%) | 0 (0.0%) |
| 12:00 PM to 3:59 PM | 0 (0.0%) | 0 (0.0%) |
| 4:00 PM to 11:59 PM | 6 (24.0%) | 0 (0.0%) |
| Total | 25 (100.0%) | 13 (100.0%) |
Housing Occupancy in Marcus
Occupancy by Ownership in Marcus
Of the total 79 dwellings in Marcus, owner-occupied units account for 71 (89.9%), while renter-occupied units make up 8 (10.1%).
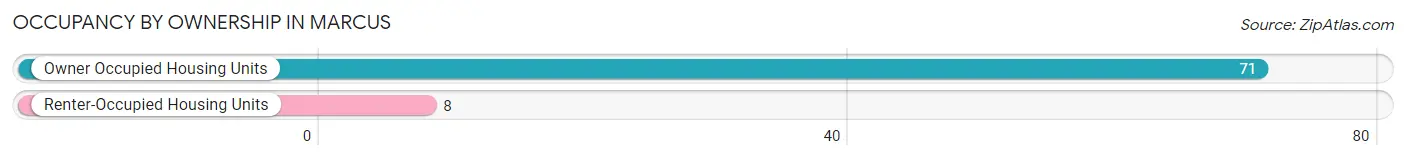
| Occupancy | # Housing Units | % Housing Units |
| Owner Occupied Housing Units | 71 | 89.9% |
| Renter-Occupied Housing Units | 8 | 10.1% |
| Total Occupied Housing Units | 79 | 100.0% |
Occupancy by Household Size in Marcus
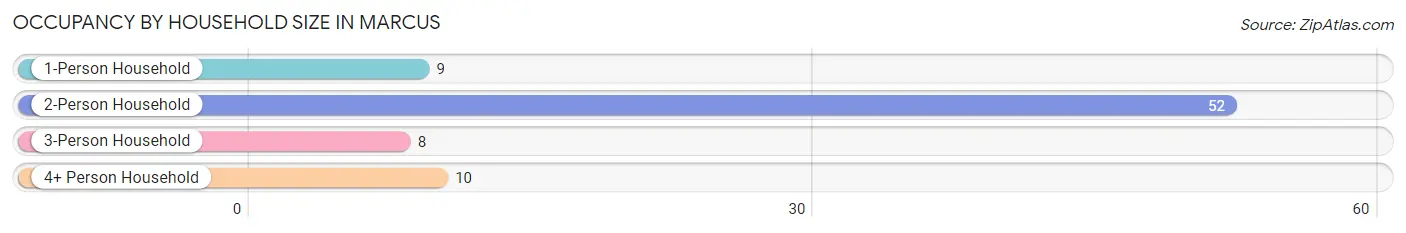
| Household Size | # Housing Units | % Housing Units |
| 1-Person Household | 9 | 11.4% |
| 2-Person Household | 52 | 65.8% |
| 3-Person Household | 8 | 10.1% |
| 4+ Person Household | 10 | 12.7% |
| Total Housing Units | 79 | 100.0% |
Occupancy by Ownership by Household Size in Marcus
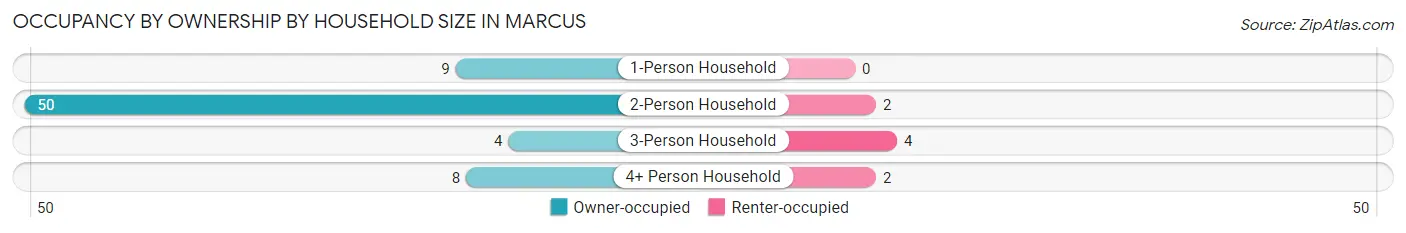
| Household Size | Owner-occupied | Renter-occupied |
| 1-Person Household | 9 (100.0%) | 0 (0.0%) |
| 2-Person Household | 50 (96.2%) | 2 (3.8%) |
| 3-Person Household | 4 (50.0%) | 4 (50.0%) |
| 4+ Person Household | 8 (80.0%) | 2 (20.0%) |
| Total Housing Units | 71 (89.9%) | 8 (10.1%) |
Occupancy by Educational Attainment in Marcus
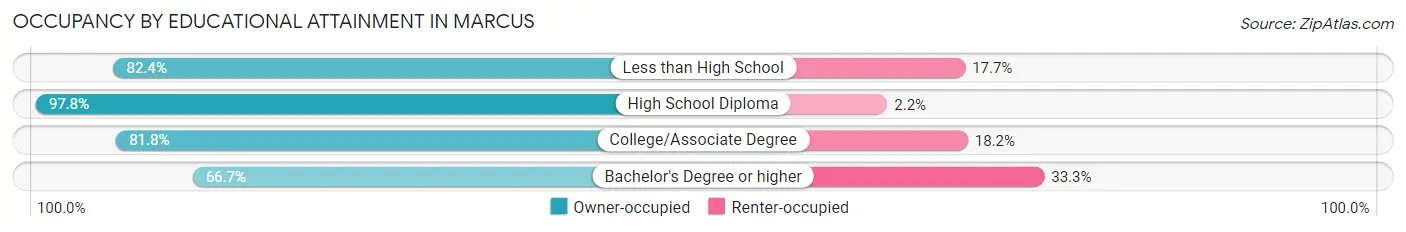
| Household Size | Owner-occupied | Renter-occupied |
| Less than High School | 14 (82.4%) | 3 (17.6%) |
| High School Diploma | 44 (97.8%) | 1 (2.2%) |
| College/Associate Degree | 9 (81.8%) | 2 (18.2%) |
| Bachelor's Degree or higher | 4 (66.7%) | 2 (33.3%) |
Occupancy by Age of Householder in Marcus
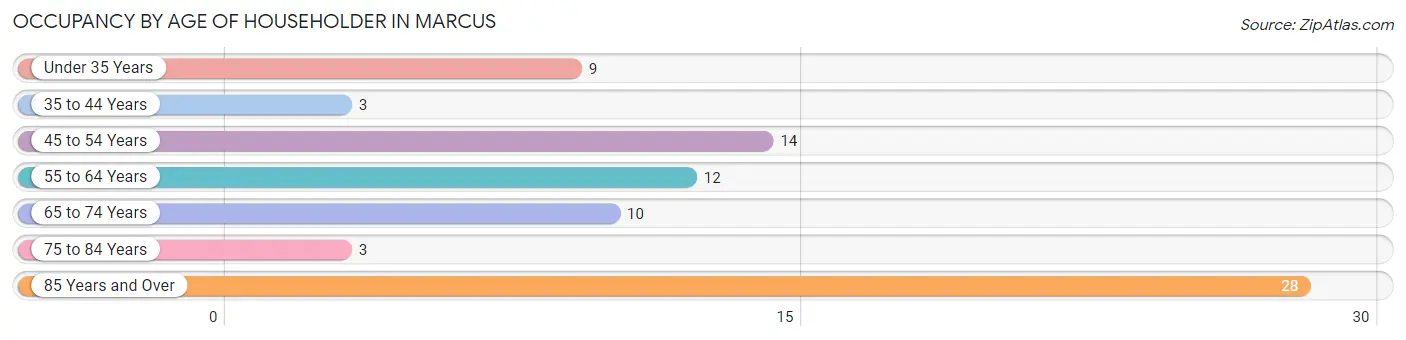
| Age Bracket | # Households | % Households |
| Under 35 Years | 9 | 11.4% |
| 35 to 44 Years | 3 | 3.8% |
| 45 to 54 Years | 14 | 17.7% |
| 55 to 64 Years | 12 | 15.2% |
| 65 to 74 Years | 10 | 12.7% |
| 75 to 84 Years | 3 | 3.8% |
| 85 Years and Over | 28 | 35.4% |
| Total | 79 | 100.0% |
Housing Finances in Marcus
Median Income by Occupancy in Marcus
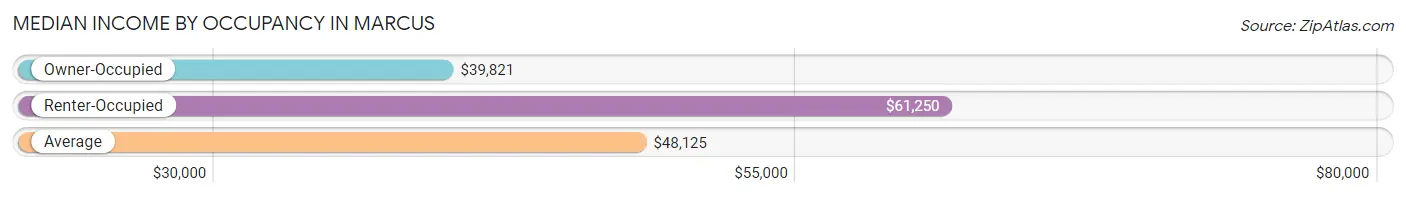
| Occupancy Type | # Households | Median Income |
| Owner-Occupied | 71 (89.9%) | $39,821 |
| Renter-Occupied | 8 (10.1%) | $61,250 |
| Average | 79 (100.0%) | $48,125 |
Occupancy by Householder Income Bracket in Marcus
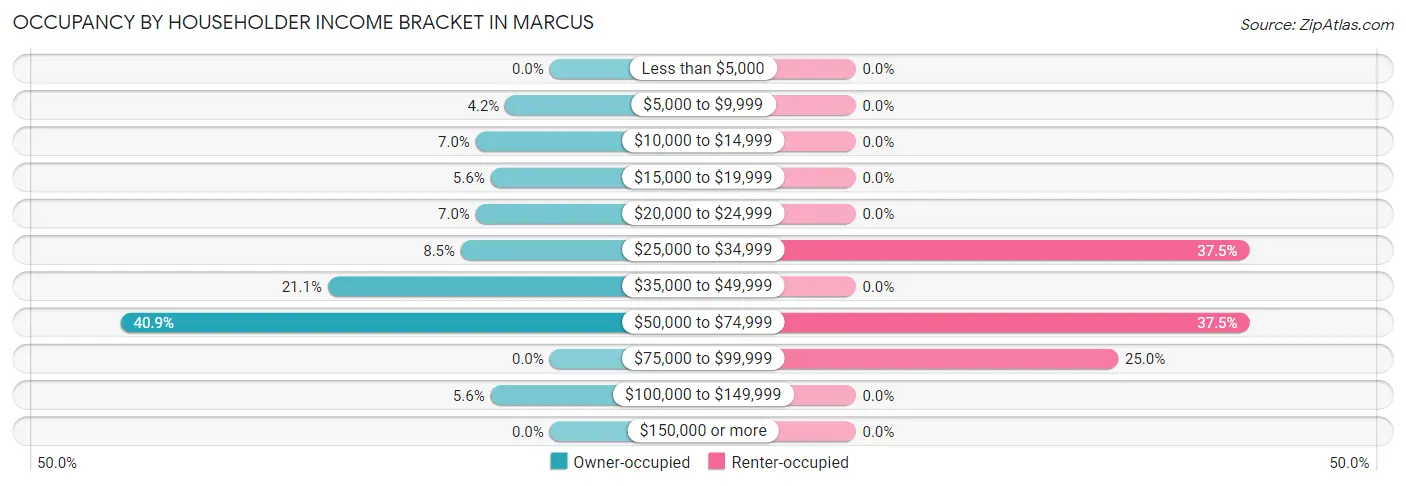
| Income Bracket | Owner-occupied | Renter-occupied |
| Less than $5,000 | 0 (0.0%) | 0 (0.0%) |
| $5,000 to $9,999 | 3 (4.2%) | 0 (0.0%) |
| $10,000 to $14,999 | 5 (7.0%) | 0 (0.0%) |
| $15,000 to $19,999 | 4 (5.6%) | 0 (0.0%) |
| $20,000 to $24,999 | 5 (7.0%) | 0 (0.0%) |
| $25,000 to $34,999 | 6 (8.5%) | 3 (37.5%) |
| $35,000 to $49,999 | 15 (21.1%) | 0 (0.0%) |
| $50,000 to $74,999 | 29 (40.8%) | 3 (37.5%) |
| $75,000 to $99,999 | 0 (0.0%) | 2 (25.0%) |
| $100,000 to $149,999 | 4 (5.6%) | 0 (0.0%) |
| $150,000 or more | 0 (0.0%) | 0 (0.0%) |
| Total | 71 (100.0%) | 8 (100.0%) |
Monthly Housing Cost Tiers in Marcus
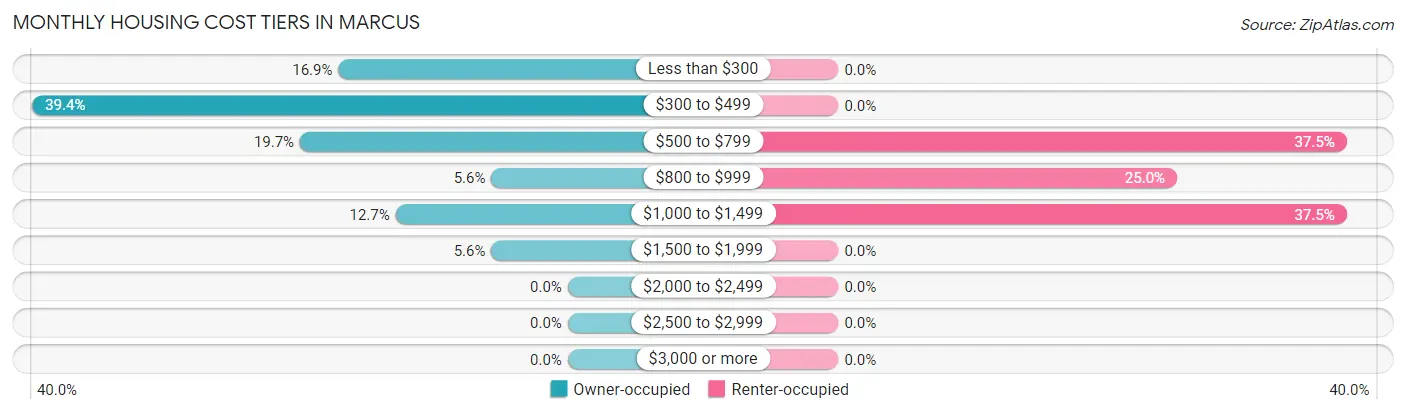
| Monthly Cost | Owner-occupied | Renter-occupied |
| Less than $300 | 12 (16.9%) | 0 (0.0%) |
| $300 to $499 | 28 (39.4%) | 0 (0.0%) |
| $500 to $799 | 14 (19.7%) | 3 (37.5%) |
| $800 to $999 | 4 (5.6%) | 2 (25.0%) |
| $1,000 to $1,499 | 9 (12.7%) | 3 (37.5%) |
| $1,500 to $1,999 | 4 (5.6%) | 0 (0.0%) |
| $2,000 to $2,499 | 0 (0.0%) | 0 (0.0%) |
| $2,500 to $2,999 | 0 (0.0%) | 0 (0.0%) |
| $3,000 or more | 0 (0.0%) | 0 (0.0%) |
| Total | 71 (100.0%) | 8 (100.0%) |
Physical Housing Characteristics in Marcus
Housing Structures in Marcus
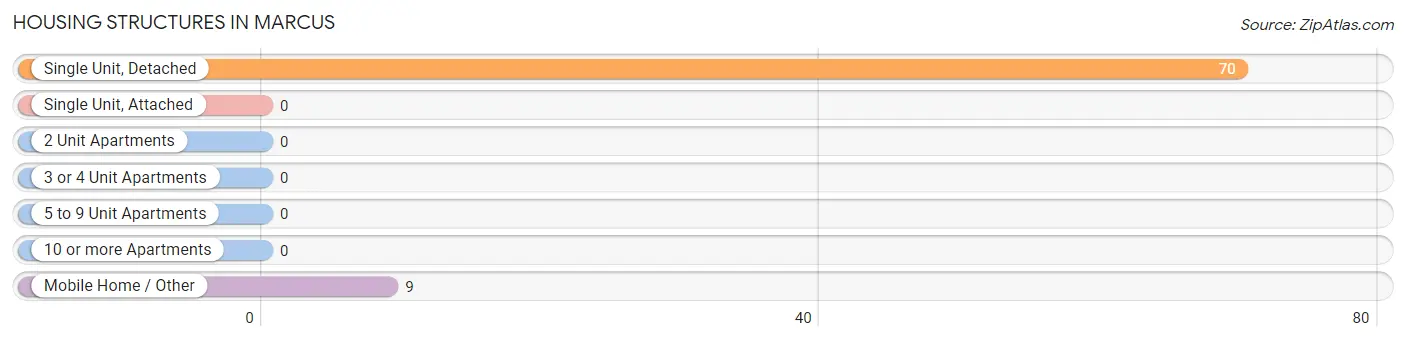
| Structure Type | # Housing Units | % Housing Units |
| Single Unit, Detached | 70 | 88.6% |
| Single Unit, Attached | 0 | 0.0% |
| 2 Unit Apartments | 0 | 0.0% |
| 3 or 4 Unit Apartments | 0 | 0.0% |
| 5 to 9 Unit Apartments | 0 | 0.0% |
| 10 or more Apartments | 0 | 0.0% |
| Mobile Home / Other | 9 | 11.4% |
| Total | 79 | 100.0% |
Housing Structures by Occupancy in Marcus
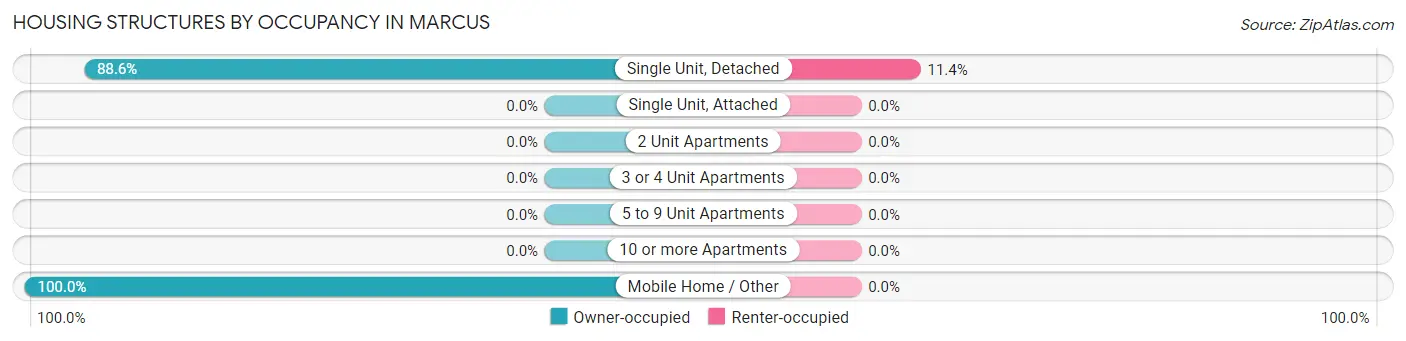
| Structure Type | Owner-occupied | Renter-occupied |
| Single Unit, Detached | 62 (88.6%) | 8 (11.4%) |
| Single Unit, Attached | 0 (0.0%) | 0 (0.0%) |
| 2 Unit Apartments | 0 (0.0%) | 0 (0.0%) |
| 3 or 4 Unit Apartments | 0 (0.0%) | 0 (0.0%) |
| 5 to 9 Unit Apartments | 0 (0.0%) | 0 (0.0%) |
| 10 or more Apartments | 0 (0.0%) | 0 (0.0%) |
| Mobile Home / Other | 9 (100.0%) | 0 (0.0%) |
| Total | 71 (89.9%) | 8 (10.1%) |
Housing Structures by Number of Rooms in Marcus
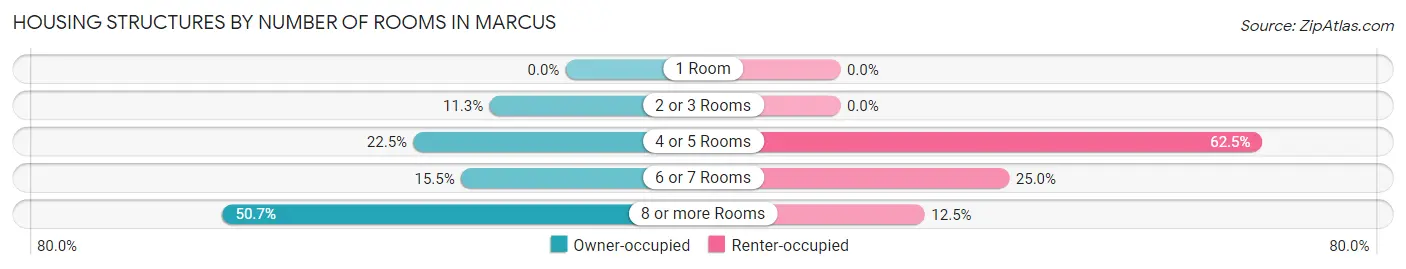
| Number of Rooms | Owner-occupied | Renter-occupied |
| 1 Room | 0 (0.0%) | 0 (0.0%) |
| 2 or 3 Rooms | 8 (11.3%) | 0 (0.0%) |
| 4 or 5 Rooms | 16 (22.5%) | 5 (62.5%) |
| 6 or 7 Rooms | 11 (15.5%) | 2 (25.0%) |
| 8 or more Rooms | 36 (50.7%) | 1 (12.5%) |
| Total | 71 (100.0%) | 8 (100.0%) |
Housing Structure by Heating Type in Marcus
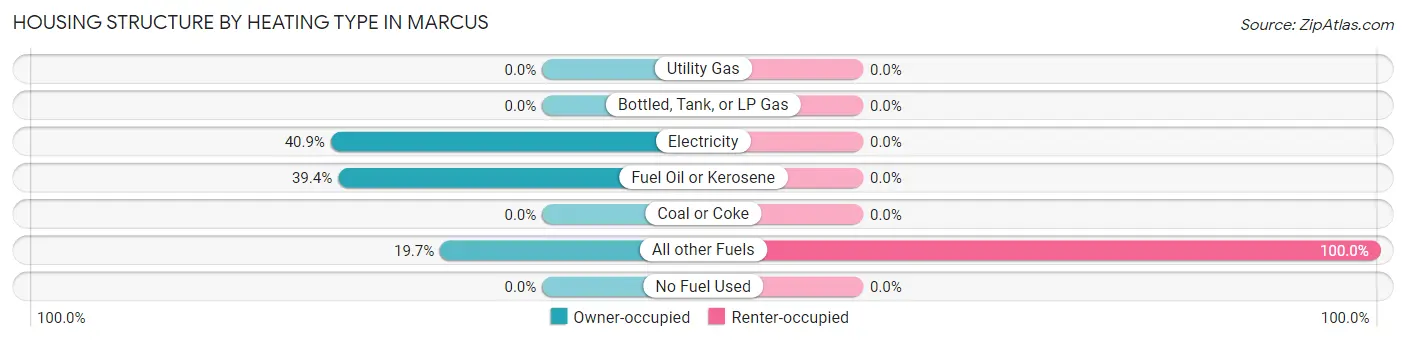
| Heating Type | Owner-occupied | Renter-occupied |
| Utility Gas | 0 (0.0%) | 0 (0.0%) |
| Bottled, Tank, or LP Gas | 0 (0.0%) | 0 (0.0%) |
| Electricity | 29 (40.8%) | 0 (0.0%) |
| Fuel Oil or Kerosene | 28 (39.4%) | 0 (0.0%) |
| Coal or Coke | 0 (0.0%) | 0 (0.0%) |
| All other Fuels | 14 (19.7%) | 8 (100.0%) |
| No Fuel Used | 0 (0.0%) | 0 (0.0%) |
| Total | 71 (100.0%) | 8 (100.0%) |
Household Vehicle Usage in Marcus
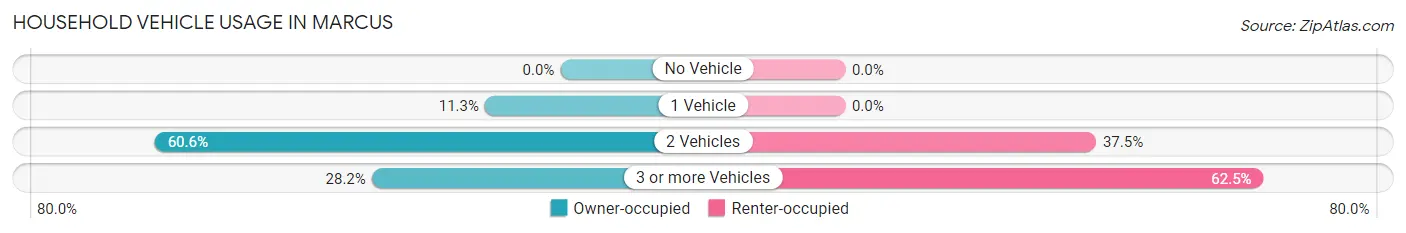
| Vehicles per Household | Owner-occupied | Renter-occupied |
| No Vehicle | 0 (0.0%) | 0 (0.0%) |
| 1 Vehicle | 8 (11.3%) | 0 (0.0%) |
| 2 Vehicles | 43 (60.6%) | 3 (37.5%) |
| 3 or more Vehicles | 20 (28.2%) | 5 (62.5%) |
| Total | 71 (100.0%) | 8 (100.0%) |
Real Estate & Mortgages in Marcus
Real Estate and Mortgage Overview in Marcus
| Characteristic | Without Mortgage | With Mortgage |
| Housing Units | 54 | 17 |
| Median Property Value | $156,300 | $205,000 |
| Median Household Income | $50,400 | $0 |
| Monthly Housing Costs | $446 | $0 |
| Real Estate Taxes | - | - |
Property Value by Mortgage Status in Marcus
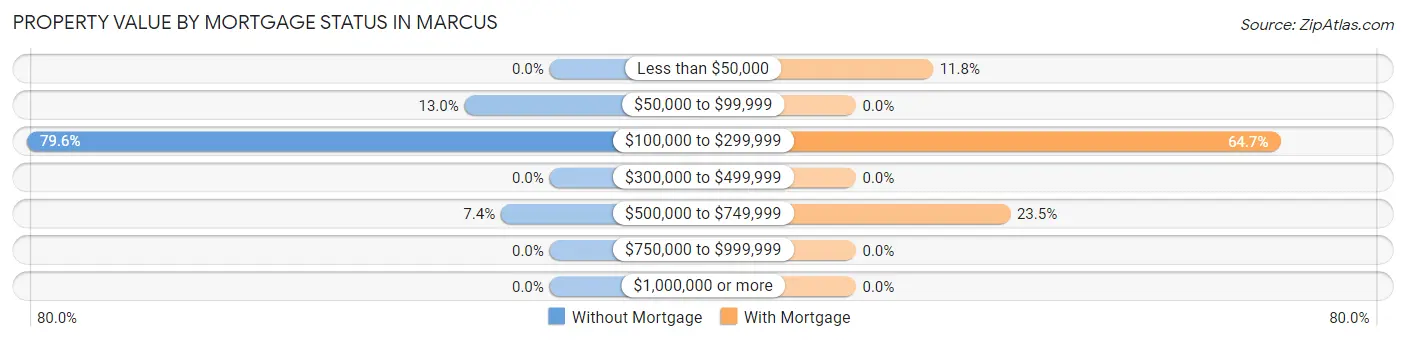
| Property Value | Without Mortgage | With Mortgage |
| Less than $50,000 | 0 (0.0%) | 2 (11.8%) |
| $50,000 to $99,999 | 7 (13.0%) | 0 (0.0%) |
| $100,000 to $299,999 | 43 (79.6%) | 11 (64.7%) |
| $300,000 to $499,999 | 0 (0.0%) | 0 (0.0%) |
| $500,000 to $749,999 | 4 (7.4%) | 4 (23.5%) |
| $750,000 to $999,999 | 0 (0.0%) | 0 (0.0%) |
| $1,000,000 or more | 0 (0.0%) | 0 (0.0%) |
| Total | 54 (100.0%) | 17 (100.0%) |
Household Income by Mortgage Status in Marcus
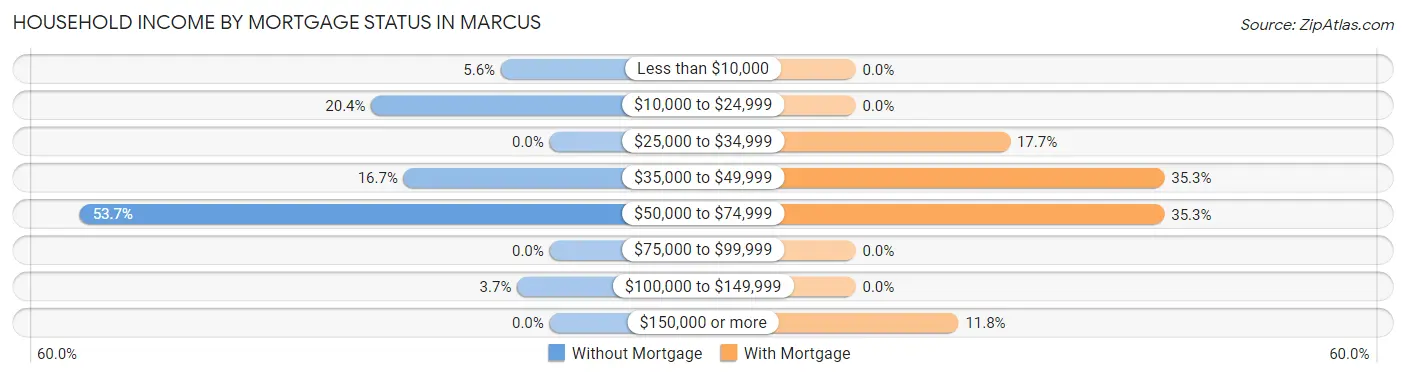
| Household Income | Without Mortgage | With Mortgage |
| Less than $10,000 | 3 (5.6%) | 0 (0.0%) |
| $10,000 to $24,999 | 11 (20.4%) | 0 (0.0%) |
| $25,000 to $34,999 | 0 (0.0%) | 3 (17.6%) |
| $35,000 to $49,999 | 9 (16.7%) | 6 (35.3%) |
| $50,000 to $74,999 | 29 (53.7%) | 6 (35.3%) |
| $75,000 to $99,999 | 0 (0.0%) | 0 (0.0%) |
| $100,000 to $149,999 | 2 (3.7%) | 0 (0.0%) |
| $150,000 or more | 0 (0.0%) | 2 (11.8%) |
| Total | 54 (100.0%) | 17 (100.0%) |
Property Value to Household Income Ratio in Marcus
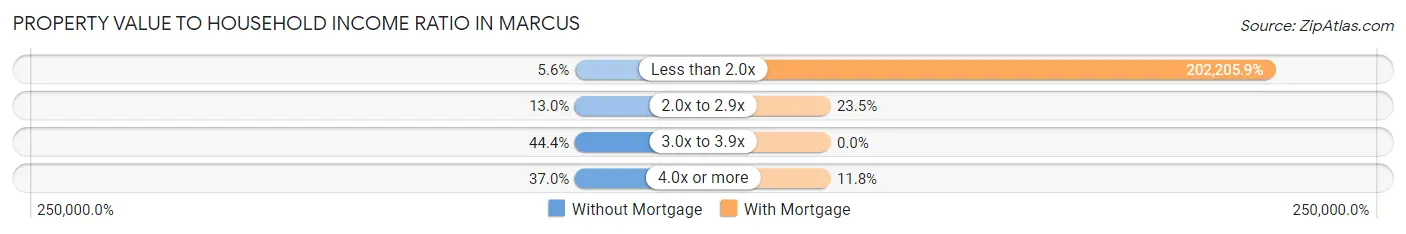
| Value-to-Income Ratio | Without Mortgage | With Mortgage |
| Less than 2.0x | 3 (5.6%) | 34,375 (202,205.9%) |
| 2.0x to 2.9x | 7 (13.0%) | 4 (23.5%) |
| 3.0x to 3.9x | 24 (44.4%) | 0 (0.0%) |
| 4.0x or more | 20 (37.0%) | 2 (11.8%) |
| Total | 54 (100.0%) | 17 (100.0%) |
Real Estate Taxes by Mortgage Status in Marcus
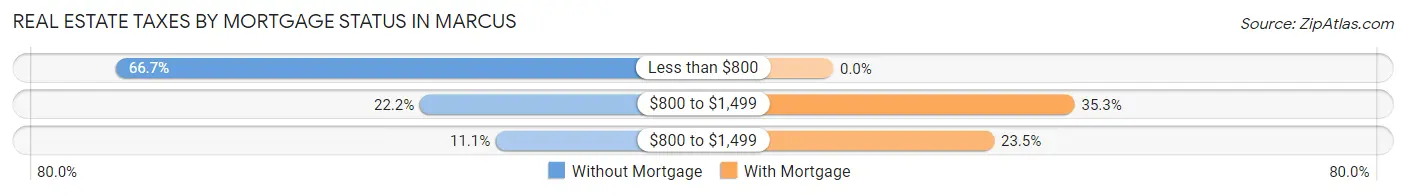
| Property Taxes | Without Mortgage | With Mortgage |
| Less than $800 | 36 (66.7%) | 0 (0.0%) |
| $800 to $1,499 | 12 (22.2%) | 6 (35.3%) |
| $800 to $1,499 | 6 (11.1%) | 4 (23.5%) |
| Total | 54 (100.0%) | 17 (100.0%) |
Health & Disability in Marcus
Health Insurance Coverage by Age in Marcus
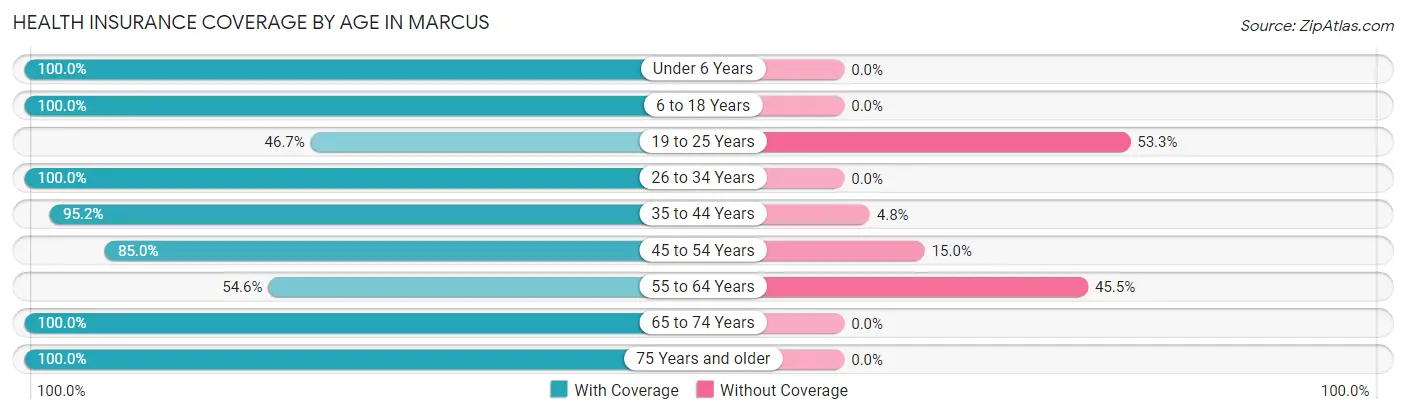
| Age Bracket | With Coverage | Without Coverage |
| Under 6 Years | 15 (100.0%) | 0 (0.0%) |
| 6 to 18 Years | 21 (100.0%) | 0 (0.0%) |
| 19 to 25 Years | 7 (46.7%) | 8 (53.3%) |
| 26 to 34 Years | 7 (100.0%) | 0 (0.0%) |
| 35 to 44 Years | 20 (95.2%) | 1 (4.8%) |
| 45 to 54 Years | 17 (85.0%) | 3 (15.0%) |
| 55 to 64 Years | 18 (54.5%) | 15 (45.5%) |
| 65 to 74 Years | 16 (100.0%) | 0 (0.0%) |
| 75 Years and older | 34 (100.0%) | 0 (0.0%) |
| Total | 155 (85.2%) | 27 (14.8%) |
Health Insurance Coverage by Citizenship Status in Marcus
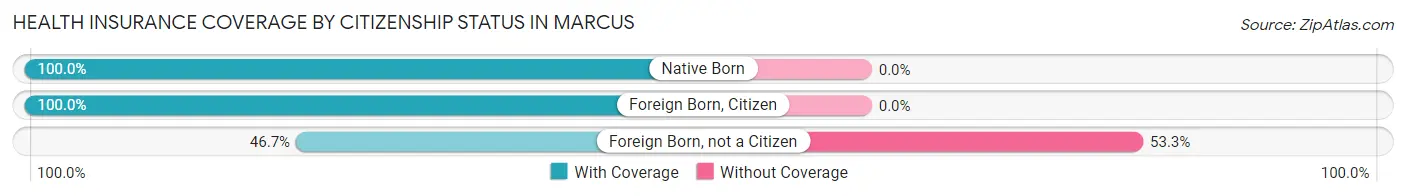
| Citizenship Status | With Coverage | Without Coverage |
| Native Born | 15 (100.0%) | 0 (0.0%) |
| Foreign Born, Citizen | 21 (100.0%) | 0 (0.0%) |
| Foreign Born, not a Citizen | 7 (46.7%) | 8 (53.3%) |
Health Insurance Coverage by Household Income in Marcus
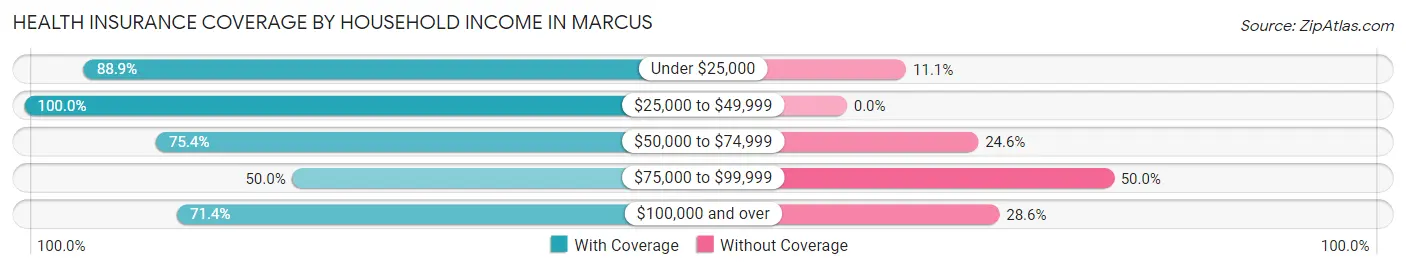
| Household Income | With Coverage | Without Coverage |
| Under $25,000 | 40 (88.9%) | 5 (11.1%) |
| $25,000 to $49,999 | 54 (100.0%) | 0 (0.0%) |
| $50,000 to $74,999 | 49 (75.4%) | 16 (24.6%) |
| $75,000 to $99,999 | 2 (50.0%) | 2 (50.0%) |
| $100,000 and over | 10 (71.4%) | 4 (28.6%) |
Public vs Private Health Insurance Coverage by Age in Marcus
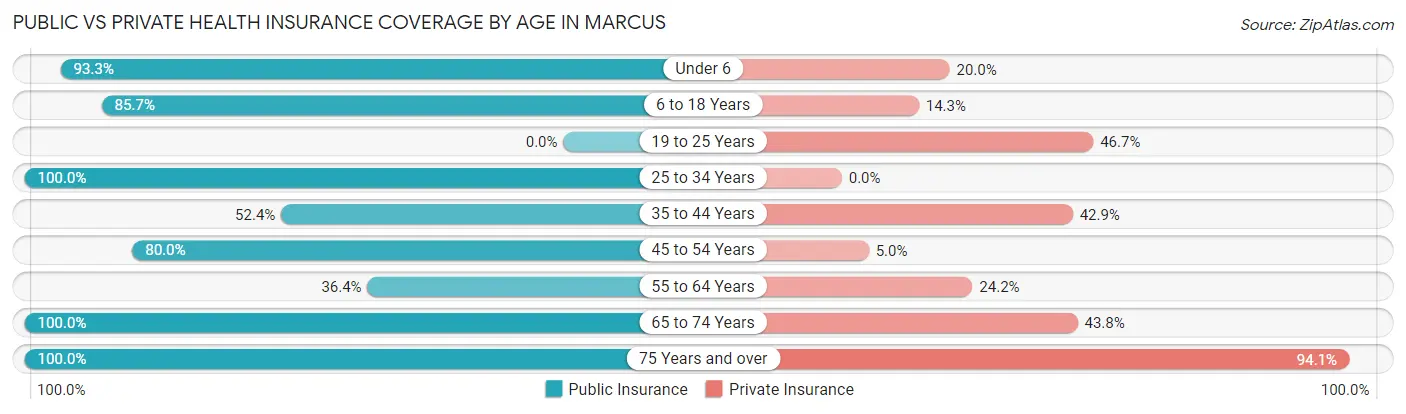
| Age Bracket | Public Insurance | Private Insurance |
| Under 6 | 14 (93.3%) | 3 (20.0%) |
| 6 to 18 Years | 18 (85.7%) | 3 (14.3%) |
| 19 to 25 Years | 0 (0.0%) | 7 (46.7%) |
| 25 to 34 Years | 7 (100.0%) | 0 (0.0%) |
| 35 to 44 Years | 11 (52.4%) | 9 (42.9%) |
| 45 to 54 Years | 16 (80.0%) | 1 (5.0%) |
| 55 to 64 Years | 12 (36.4%) | 8 (24.2%) |
| 65 to 74 Years | 16 (100.0%) | 7 (43.8%) |
| 75 Years and over | 34 (100.0%) | 32 (94.1%) |
| Total | 128 (70.3%) | 70 (38.5%) |
Disability Status by Sex by Age in Marcus
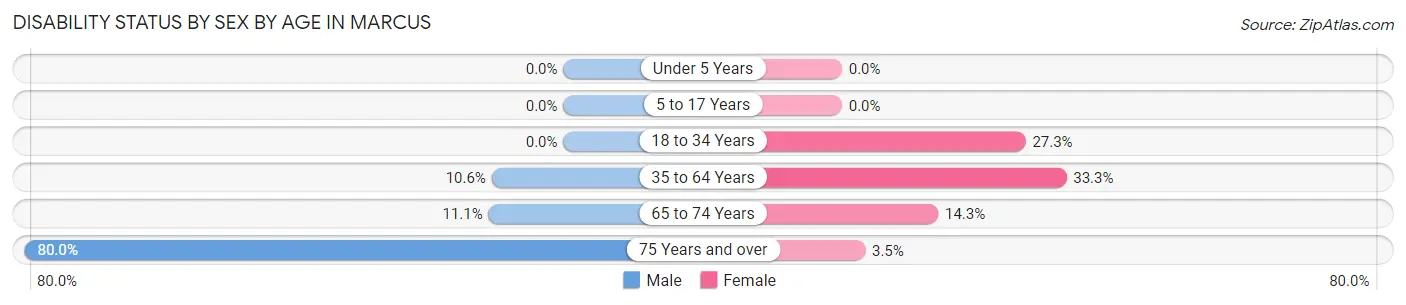
| Age Bracket | Male | Female |
| Under 5 Years | 0 (0.0%) | 0 (0.0%) |
| 5 to 17 Years | 0 (0.0%) | 0 (0.0%) |
| 18 to 34 Years | 0 (0.0%) | 3 (27.3%) |
| 35 to 64 Years | 5 (10.6%) | 9 (33.3%) |
| 65 to 74 Years | 1 (11.1%) | 1 (14.3%) |
| 75 Years and over | 4 (80.0%) | 1 (3.5%) |
Disability Class by Sex by Age in Marcus
Disability Class: Hearing Difficulty
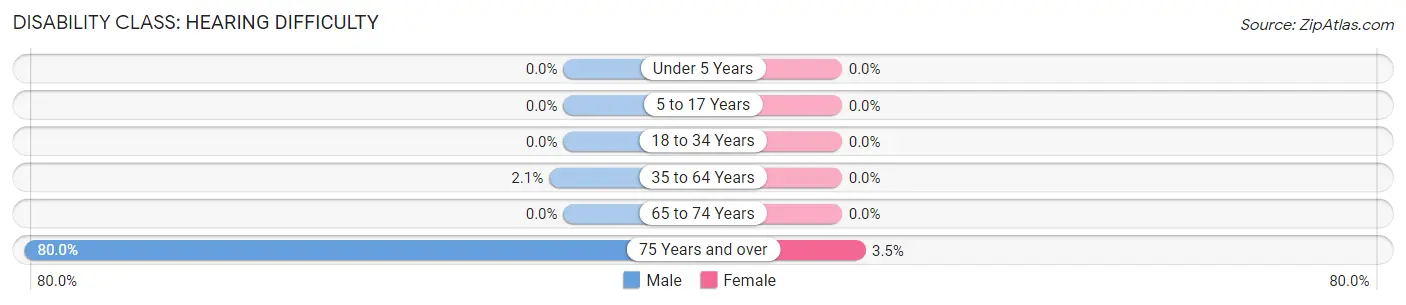
| Age Bracket | Male | Female |
| Under 5 Years | 0 (0.0%) | 0 (0.0%) |
| 5 to 17 Years | 0 (0.0%) | 0 (0.0%) |
| 18 to 34 Years | 0 (0.0%) | 0 (0.0%) |
| 35 to 64 Years | 1 (2.1%) | 0 (0.0%) |
| 65 to 74 Years | 0 (0.0%) | 0 (0.0%) |
| 75 Years and over | 4 (80.0%) | 1 (3.5%) |
Disability Class: Vision Difficulty
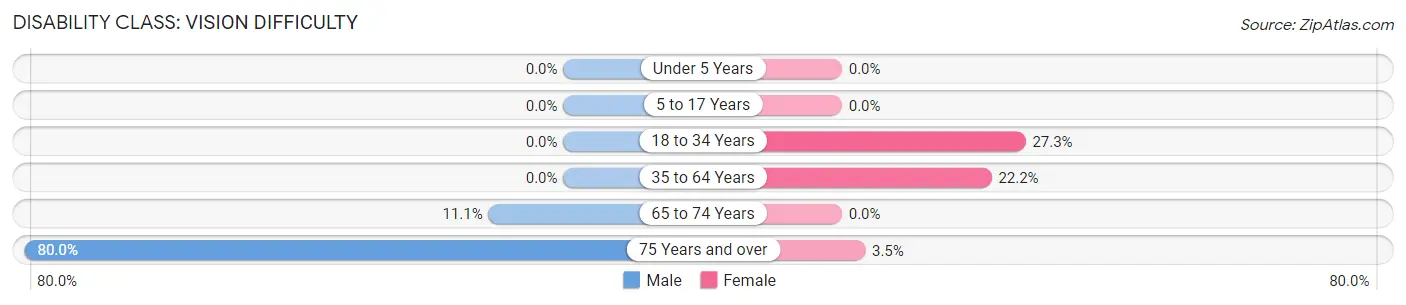
| Age Bracket | Male | Female |
| Under 5 Years | 0 (0.0%) | 0 (0.0%) |
| 5 to 17 Years | 0 (0.0%) | 0 (0.0%) |
| 18 to 34 Years | 0 (0.0%) | 3 (27.3%) |
| 35 to 64 Years | 0 (0.0%) | 6 (22.2%) |
| 65 to 74 Years | 1 (11.1%) | 0 (0.0%) |
| 75 Years and over | 4 (80.0%) | 1 (3.5%) |
Disability Class: Cognitive Difficulty
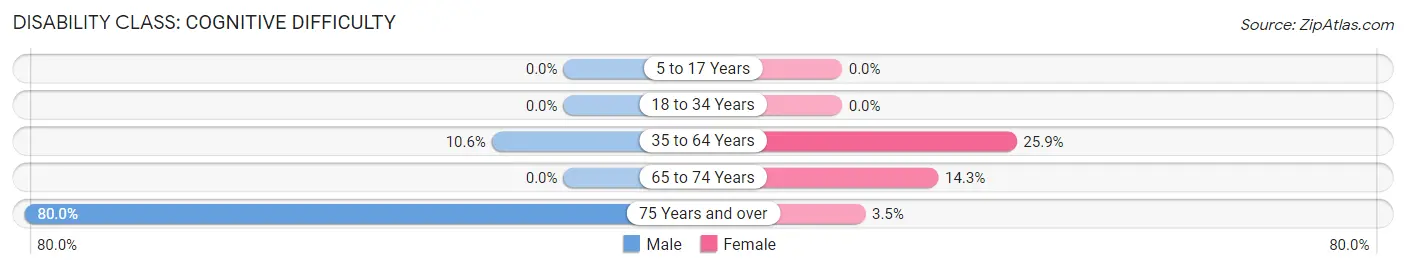
| Age Bracket | Male | Female |
| 5 to 17 Years | 0 (0.0%) | 0 (0.0%) |
| 18 to 34 Years | 0 (0.0%) | 0 (0.0%) |
| 35 to 64 Years | 5 (10.6%) | 7 (25.9%) |
| 65 to 74 Years | 0 (0.0%) | 1 (14.3%) |
| 75 Years and over | 4 (80.0%) | 1 (3.5%) |
Disability Class: Ambulatory Difficulty
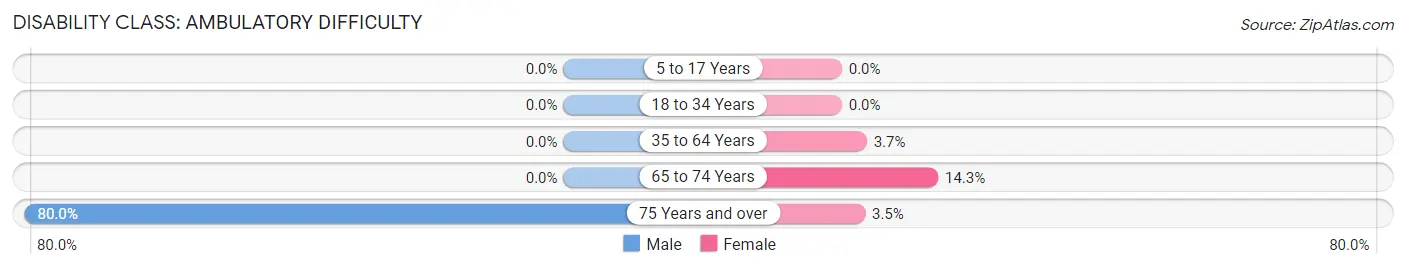
| Age Bracket | Male | Female |
| 5 to 17 Years | 0 (0.0%) | 0 (0.0%) |
| 18 to 34 Years | 0 (0.0%) | 0 (0.0%) |
| 35 to 64 Years | 0 (0.0%) | 1 (3.7%) |
| 65 to 74 Years | 0 (0.0%) | 1 (14.3%) |
| 75 Years and over | 4 (80.0%) | 1 (3.5%) |
Disability Class: Self-Care Difficulty
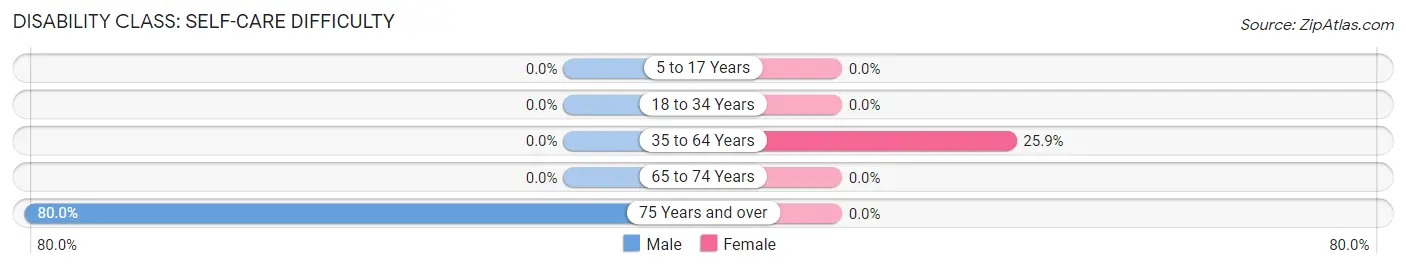
| Age Bracket | Male | Female |
| 5 to 17 Years | 0 (0.0%) | 0 (0.0%) |
| 18 to 34 Years | 0 (0.0%) | 0 (0.0%) |
| 35 to 64 Years | 0 (0.0%) | 7 (25.9%) |
| 65 to 74 Years | 0 (0.0%) | 0 (0.0%) |
| 75 Years and over | 4 (80.0%) | 0 (0.0%) |
Technology Access in Marcus
Computing Device Access in Marcus
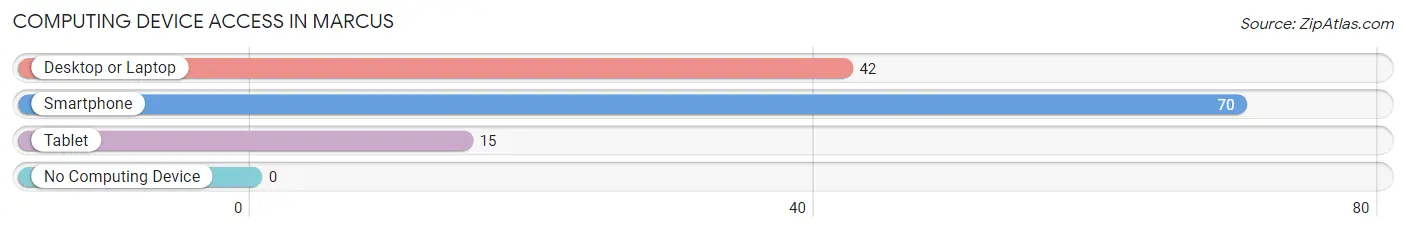
| Device Type | # Households | % Households |
| Desktop or Laptop | 42 | 53.2% |
| Smartphone | 70 | 88.6% |
| Tablet | 15 | 19.0% |
| No Computing Device | 0 | 0.0% |
| Total | 79 | 100.0% |
Internet Access in Marcus
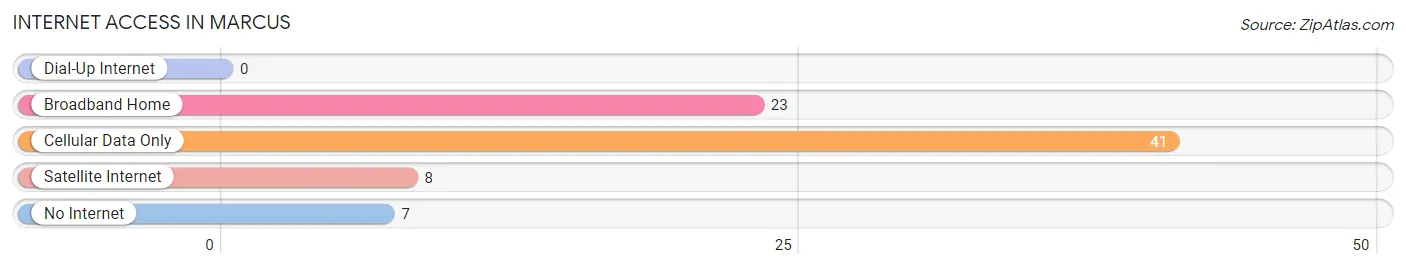
| Internet Type | # Households | % Households |
| Dial-Up Internet | 0 | 0.0% |
| Broadband Home | 23 | 29.1% |
| Cellular Data Only | 41 | 51.9% |
| Satellite Internet | 8 | 10.1% |
| No Internet | 7 | 8.9% |
| Total | 79 | 100.0% |
Marcus Summary
Washington is a state located in the Pacific Northwest region of the United States. It is bordered by Oregon to the south, Idaho to the east, and the Canadian province of British Columbia to the north. Washington is the 18th largest state in the United States, with an area of 71,362 square miles, and the 13th most populous state, with a population of 7.6 million as of 2019. The state capital is Olympia, and the largest city is Seattle.
History
The area that is now Washington was first inhabited by Native American tribes, including the Chinook, Nisqually, and Yakama. The first European to explore the area was British explorer George Vancouver in 1792. The area was part of the Oregon Country, a disputed region between the United States and Great Britain, until 1846 when the Oregon Treaty established the 49th parallel as the border between the two countries.
In 1853, Washington became a U.S. territory, and in 1889 it was admitted to the Union as the 42nd state. During the late 19th and early 20th centuries, Washington experienced a period of rapid growth and industrialization, fueled by the timber and mining industries. The state also became a major producer of hydroelectric power, and the Grand Coulee Dam, completed in 1941, was the largest concrete structure in the world at the time.
Geography
Washington is located in the Pacific Northwest region of the United States. It is bordered by Oregon to the south, Idaho to the east, and the Canadian province of British Columbia to the north. The state has a total area of 71,362 square miles, making it the 18th largest state in the country.
Washington is divided into three distinct geographic regions: the Cascade Mountains, the Columbia Plateau, and the Olympic Mountains. The Cascade Mountains run north-south through the western part of the state, and are home to several active volcanoes, including Mount Rainier, the highest peak in the state at 14,411 feet. The Columbia Plateau is a large area of flat land in the eastern part of the state, and is home to the Columbia River, the largest river in the Pacific Northwest. The Olympic Mountains are located in the northwest corner of the state, and are home to the Olympic National Park.
Economy
Washington has a diverse economy, with major industries in agriculture, forestry, fishing, technology, and manufacturing. The state is the leading producer of apples, hops, and pears in the United States, and is also a major producer of wheat, potatoes, and dairy products. The timber industry is also an important part of the state’s economy, and Washington is the leading producer of lumber in the country.
The technology industry is a major driver of the state’s economy, and Washington is home to several major tech companies, including Microsoft, Amazon, and Boeing. The state is also a major producer of hydroelectric power, and is the leading producer of hydroelectricity in the United States.
Demographics
As of 2019, the population of Washington was estimated to be 7.6 million, making it the 13th most populous state in the country. The state has a population density of 102 people per square mile, making it the 22nd most densely populated state.
The largest racial or ethnic group in Washington is white, making up 72.3% of the population. The next largest group is Hispanic or Latino, making up 12.3% of the population. Other racial or ethnic groups include Asian (7.2%), African American (4.2%), and Native American (1.6%).
The median household income in Washington is $71,835, and the median home value is $372,400. The state has a poverty rate of 11.2%, and the unemployment rate is 4.3%.
Common Questions
What is Per Capita Income in Marcus?
Per Capita income in Marcus is $18,975.
What is the Median Family Income in Marcus?
Median Family Income in Marcus is $50,500.
What is the Median Household income in Marcus?
Median Household Income in Marcus is $48,125.
What is Income or Wage Gap in Marcus?
Income or Wage Gap in Marcus is 50.5%.
Women in Marcus earn 49.5 cents for every dollar earned by a man.
What is Family Income Deficit in Marcus?
Family Income Deficit in Marcus is $13,730.
Families that are below poverty line in Marcus earn $13,730 less on average than the poverty threshold level.
What is Inequality or Gini Index in Marcus?
Inequality or Gini Index in Marcus is 0.30.
What is the Total Population of Marcus?
Total Population of Marcus is 182.
What is the Total Male Population of Marcus?
Total Male Population of Marcus is 92.
What is the Total Female Population of Marcus?
Total Female Population of Marcus is 90.
What is the Ratio of Males per 100 Females in Marcus?
There are 102.22 Males per 100 Females in Marcus.
What is the Ratio of Females per 100 Males in Marcus?
There are 97.83 Females per 100 Males in Marcus.
What is the Median Population Age in Marcus?
Median Population Age in Marcus is 48.5 Years.
What is the Average Family Size in Marcus
Average Family Size in Marcus is 2.4 People.
What is the Average Household Size in Marcus
Average Household Size in Marcus is 2.3 People.
How Large is the Labor Force in Marcus?
There are 47 People in the Labor Forcein in Marcus.
What is the Percentage of People in the Labor Force in Marcus?
30.3% of People are in the Labor Force in Marcus.