Zip Codes with the Highest Percentage of Population with a Degree in Engineering in Oak Harbor, WA
RELATED REPORTS & OPTIONS
Engineering
Oak Harbor
Compare Zip Codes
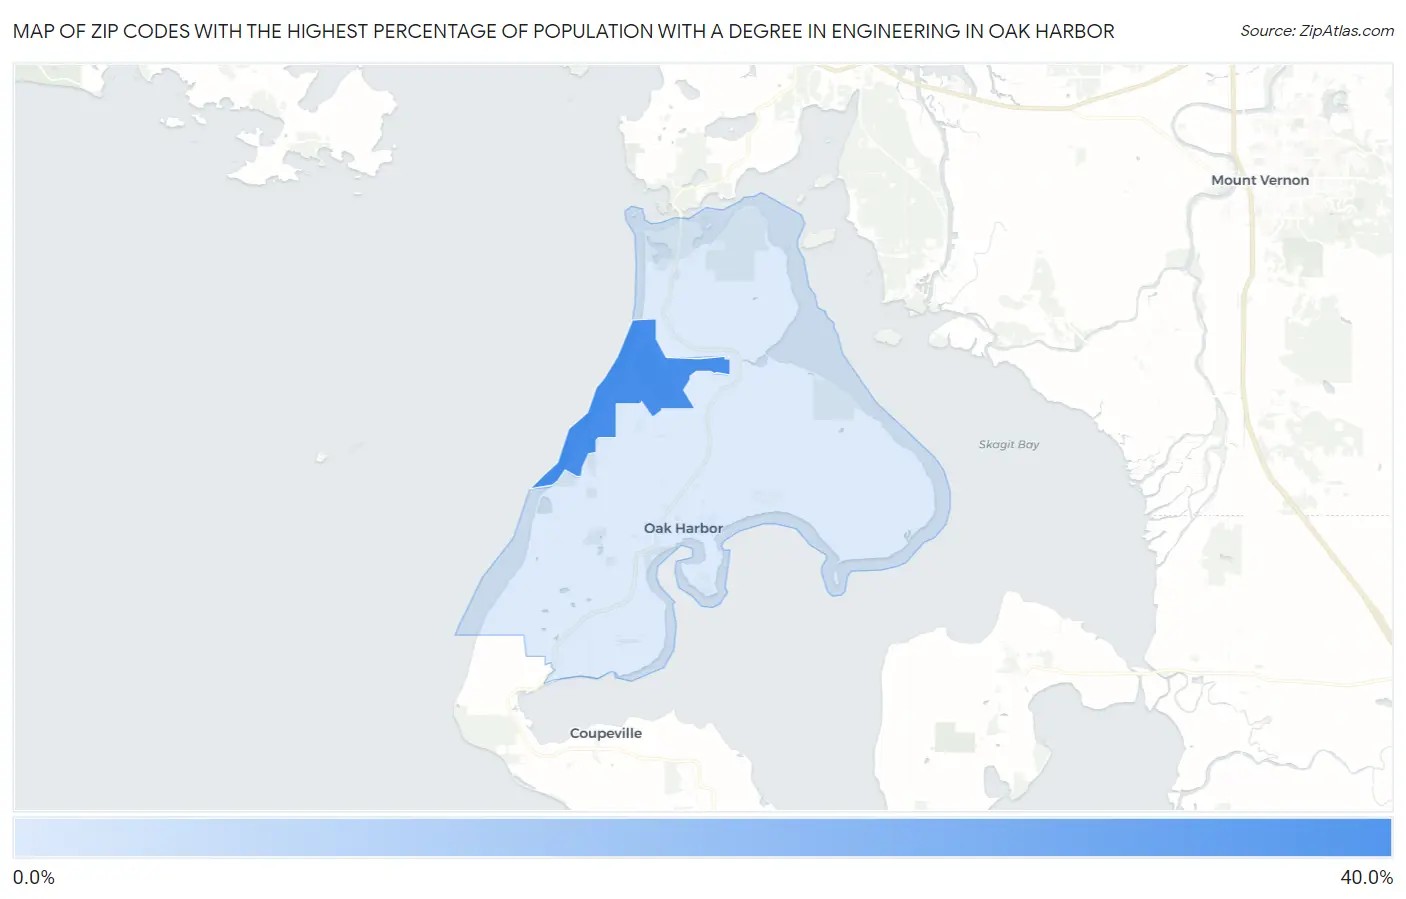
Map of Zip Codes with the Highest Percentage of Population with a Degree in Engineering in Oak Harbor
6.4%
38.8%
Zip Codes with the Highest Percentage of Population with a Degree in Engineering in Oak Harbor, WA
| Zip Code | % Graduates | vs State | vs National | |
| 1. | 98278 | 38.8% | 9.8%(+29.0)#7 | 7.6%(+31.2)#226 |
| 2. | 98277 | 6.4% | 9.8%(-3.42)#259 | 7.6%(-1.23)#10,190 |
1
Common Questions
What are the Top Zip Codes with the Highest Percentage of Population with a Degree in Engineering in Oak Harbor, WA?
Top Zip Codes with the Highest Percentage of Population with a Degree in Engineering in Oak Harbor, WA are:
What zip code has the Highest Percentage of Population with a Degree in Engineering in Oak Harbor, WA?
98278 has the Highest Percentage of Population with a Degree in Engineering in Oak Harbor, WA with 38.8%.
What is the Percentage of Population with a Degree in Engineering in Oak Harbor, WA?
Percentage of Population with a Degree in Engineering in Oak Harbor is 6.1%.
What is the Percentage of Population with a Degree in Engineering in Washington?
Percentage of Population with a Degree in Engineering in Washington is 9.8%.
What is the Percentage of Population with a Degree in Engineering in the United States?
Percentage of Population with a Degree in Engineering in the United States is 7.6%.