Cities with the Most Immigrants from Eastern Europe in Ohio
RELATED REPORTS & OPTIONS
Eastern Europe
Ohio
Compare Cities
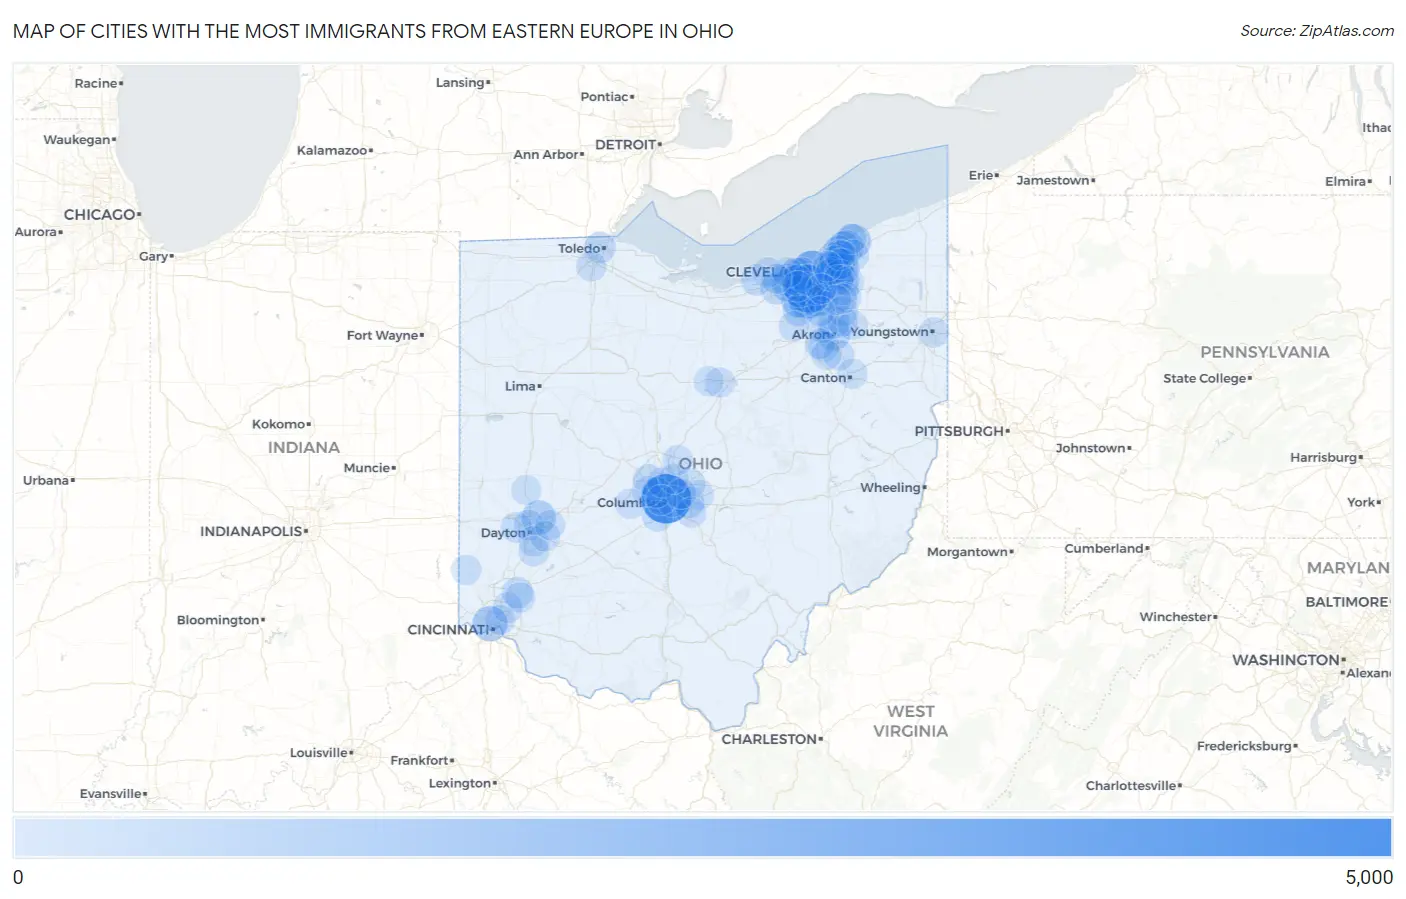
Map of Cities with the Most Immigrants from Eastern Europe in Ohio
0
5,000
Cities with the Most Immigrants from Eastern Europe in Ohio
| City | Eastern Europe | vs State | vs National | |
| 1. | Columbus | 4,167 | 52,367(7.96%)#1 | 2,208,794(0.19%)#37 |
| 2. | Parma | 3,687 | 52,367(7.04%)#2 | 2,208,794(0.17%)#49 |
| 3. | Cleveland | 2,410 | 52,367(4.60%)#3 | 2,208,794(0.11%)#88 |
| 4. | North Royalton | 1,551 | 52,367(2.96%)#4 | 2,208,794(0.07%)#177 |
| 5. | Mayfield Heights | 1,208 | 52,367(2.31%)#5 | 2,208,794(0.05%)#237 |
| 6. | Cincinnati | 1,101 | 52,367(2.10%)#6 | 2,208,794(0.05%)#265 |
| 7. | Strongsville | 1,044 | 52,367(1.99%)#7 | 2,208,794(0.05%)#284 |
| 8. | Mentor | 979 | 52,367(1.87%)#8 | 2,208,794(0.04%)#313 |
| 9. | Willoughby | 973 | 52,367(1.86%)#9 | 2,208,794(0.04%)#314 |
| 10. | Huber Heights | 912 | 52,367(1.74%)#10 | 2,208,794(0.04%)#339 |
| 11. | Rocky River | 889 | 52,367(1.70%)#11 | 2,208,794(0.04%)#349 |
| 12. | Parma Heights | 887 | 52,367(1.69%)#12 | 2,208,794(0.04%)#352 |
| 13. | Beachwood | 773 | 52,367(1.48%)#13 | 2,208,794(0.03%)#412 |
| 14. | Akron | 664 | 52,367(1.27%)#14 | 2,208,794(0.03%)#467 |
| 15. | North Olmsted | 660 | 52,367(1.26%)#15 | 2,208,794(0.03%)#473 |
| 16. | Westlake | 647 | 52,367(1.24%)#16 | 2,208,794(0.03%)#483 |
| 17. | Broadview Heights | 642 | 52,367(1.23%)#17 | 2,208,794(0.03%)#487 |
| 18. | Lakewood | 631 | 52,367(1.20%)#18 | 2,208,794(0.03%)#498 |
| 19. | Seven Hills | 602 | 52,367(1.15%)#19 | 2,208,794(0.03%)#517 |
| 20. | Solon | 581 | 52,367(1.11%)#20 | 2,208,794(0.03%)#540 |
| 21. | Eastlake | 526 | 52,367(1.00%)#21 | 2,208,794(0.02%)#591 |
| 22. | Middleburg Heights | 466 | 52,367(0.89%)#22 | 2,208,794(0.02%)#665 |
| 23. | Cuyahoga Falls | 450 | 52,367(0.86%)#23 | 2,208,794(0.02%)#685 |
| 24. | Brunswick | 424 | 52,367(0.81%)#24 | 2,208,794(0.02%)#722 |
| 25. | Euclid | 385 | 52,367(0.74%)#25 | 2,208,794(0.02%)#783 |
| 26. | Lyndhurst | 384 | 52,367(0.73%)#26 | 2,208,794(0.02%)#786 |
| 27. | Garfield Heights | 351 | 52,367(0.67%)#27 | 2,208,794(0.02%)#862 |
| 28. | Dublin | 347 | 52,367(0.66%)#28 | 2,208,794(0.02%)#866 |
| 29. | Toledo | 344 | 52,367(0.66%)#29 | 2,208,794(0.02%)#872 |
| 30. | South Euclid | 343 | 52,367(0.65%)#30 | 2,208,794(0.02%)#878 |
| 31. | Brooklyn | 326 | 52,367(0.62%)#31 | 2,208,794(0.01%)#929 |
| 32. | North Ridgeville | 325 | 52,367(0.62%)#32 | 2,208,794(0.01%)#932 |
| 33. | Cleveland Heights | 324 | 52,367(0.62%)#33 | 2,208,794(0.01%)#935 |
| 34. | Willowick | 323 | 52,367(0.62%)#34 | 2,208,794(0.01%)#941 |
| 35. | Richmond Heights | 320 | 52,367(0.61%)#35 | 2,208,794(0.01%)#947 |
| 36. | Brecksville | 308 | 52,367(0.59%)#36 | 2,208,794(0.01%)#993 |
| 37. | Lorain | 306 | 52,367(0.58%)#37 | 2,208,794(0.01%)#998 |
| 38. | Mason | 299 | 52,367(0.57%)#38 | 2,208,794(0.01%)#1,017 |
| 39. | Bexley | 293 | 52,367(0.56%)#39 | 2,208,794(0.01%)#1,033 |
| 40. | Reynoldsburg | 289 | 52,367(0.55%)#40 | 2,208,794(0.01%)#1,042 |
| 41. | Shaker Heights | 284 | 52,367(0.54%)#41 | 2,208,794(0.01%)#1,063 |
| 42. | Willoughby Hills | 269 | 52,367(0.51%)#42 | 2,208,794(0.01%)#1,117 |
| 43. | Barberton | 229 | 52,367(0.44%)#43 | 2,208,794(0.01%)#1,273 |
| 44. | Grove City | 228 | 52,367(0.44%)#44 | 2,208,794(0.01%)#1,279 |
| 45. | Fairview Park | 213 | 52,367(0.41%)#45 | 2,208,794(0.01%)#1,353 |
| 46. | Fairlawn | 213 | 52,367(0.41%)#46 | 2,208,794(0.01%)#1,357 |
| 47. | University Heights | 212 | 52,367(0.40%)#47 | 2,208,794(0.01%)#1,362 |
| 48. | Green | 194 | 52,367(0.37%)#48 | 2,208,794(0.01%)#1,456 |
| 49. | Hudson | 187 | 52,367(0.36%)#49 | 2,208,794(0.01%)#1,486 |
| 50. | Trotwood | 185 | 52,367(0.35%)#50 | 2,208,794(0.01%)#1,499 |
| 51. | Kirtland | 184 | 52,367(0.35%)#51 | 2,208,794(0.01%)#1,507 |
| 52. | Mayfield | 171 | 52,367(0.33%)#52 | 2,208,794(0.01%)#1,580 |
| 53. | Dayton | 164 | 52,367(0.31%)#53 | 2,208,794(0.01%)#1,627 |
| 54. | Pepper Pike | 161 | 52,367(0.31%)#54 | 2,208,794(0.01%)#1,656 |
| 55. | Upper Arlington | 157 | 52,367(0.30%)#55 | 2,208,794(0.01%)#1,688 |
| 56. | Kettering | 153 | 52,367(0.29%)#56 | 2,208,794(0.01%)#1,720 |
| 57. | Mentor On The Lake | 152 | 52,367(0.29%)#57 | 2,208,794(0.01%)#1,733 |
| 58. | Moreland Hills | 152 | 52,367(0.29%)#58 | 2,208,794(0.01%)#1,736 |
| 59. | Hilliard | 150 | 52,367(0.29%)#59 | 2,208,794(0.01%)#1,748 |
| 60. | Blue Ash | 148 | 52,367(0.28%)#60 | 2,208,794(0.01%)#1,773 |
| 61. | Sheffield Lake | 147 | 52,367(0.28%)#61 | 2,208,794(0.01%)#1,785 |
| 62. | Highland Heights | 145 | 52,367(0.28%)#62 | 2,208,794(0.01%)#1,804 |
| 63. | Bay Village | 139 | 52,367(0.27%)#63 | 2,208,794(0.01%)#1,870 |
| 64. | Wickliffe | 134 | 52,367(0.26%)#64 | 2,208,794(0.01%)#1,917 |
| 65. | New Albany | 128 | 52,367(0.24%)#65 | 2,208,794(0.01%)#1,962 |
| 66. | Stow | 122 | 52,367(0.23%)#66 | 2,208,794(0.01%)#2,020 |
| 67. | Norton | 122 | 52,367(0.23%)#67 | 2,208,794(0.01%)#2,025 |
| 68. | Brook Park | 120 | 52,367(0.23%)#68 | 2,208,794(0.01%)#2,045 |
| 69. | Chagrin Falls | 119 | 52,367(0.23%)#69 | 2,208,794(0.01%)#2,061 |
| 70. | Medina | 118 | 52,367(0.23%)#70 | 2,208,794(0.01%)#2,067 |
| 71. | Worthington | 118 | 52,367(0.23%)#71 | 2,208,794(0.01%)#2,068 |
| 72. | Centerville | 117 | 52,367(0.22%)#72 | 2,208,794(0.01%)#2,081 |
| 73. | Landen | 112 | 52,367(0.21%)#73 | 2,208,794(0.01%)#2,143 |
| 74. | Beavercreek | 111 | 52,367(0.21%)#74 | 2,208,794(0.01%)#2,150 |
| 75. | Youngstown | 109 | 52,367(0.21%)#75 | 2,208,794(0.00%)#2,179 |
| 76. | Orange | 108 | 52,367(0.21%)#76 | 2,208,794(0.00%)#2,210 |
| 77. | Perrysburg | 106 | 52,367(0.20%)#77 | 2,208,794(0.00%)#2,224 |
| 78. | Pataskala | 103 | 52,367(0.20%)#78 | 2,208,794(0.00%)#2,267 |
| 79. | Pickerington | 102 | 52,367(0.19%)#79 | 2,208,794(0.00%)#2,275 |
| 80. | Reminderville | 97 | 52,367(0.19%)#80 | 2,208,794(0.00%)#2,349 |
| 81. | West Jefferson | 95 | 52,367(0.18%)#81 | 2,208,794(0.00%)#2,383 |
| 82. | Gahanna | 94 | 52,367(0.18%)#82 | 2,208,794(0.00%)#2,384 |
| 83. | Norwood | 93 | 52,367(0.18%)#83 | 2,208,794(0.00%)#2,401 |
| 84. | Kent | 92 | 52,367(0.18%)#84 | 2,208,794(0.00%)#2,417 |
| 85. | Troy | 92 | 52,367(0.18%)#85 | 2,208,794(0.00%)#2,418 |
| 86. | Avon | 92 | 52,367(0.18%)#86 | 2,208,794(0.00%)#2,419 |
| 87. | East Cleveland | 91 | 52,367(0.17%)#87 | 2,208,794(0.00%)#2,434 |
| 88. | Westerville | 89 | 52,367(0.17%)#88 | 2,208,794(0.00%)#2,461 |
| 89. | Grandview Heights | 89 | 52,367(0.17%)#89 | 2,208,794(0.00%)#2,471 |
| 90. | Oxford | 87 | 52,367(0.17%)#90 | 2,208,794(0.00%)#2,496 |
| 91. | Twinsburg | 86 | 52,367(0.16%)#91 | 2,208,794(0.00%)#2,514 |
| 92. | New Franklin | 86 | 52,367(0.16%)#92 | 2,208,794(0.00%)#2,516 |
| 93. | Sunbury | 84 | 52,367(0.16%)#93 | 2,208,794(0.00%)#2,559 |
| 94. | Canton | 83 | 52,367(0.16%)#94 | 2,208,794(0.00%)#2,565 |
| 95. | Mansfield | 83 | 52,367(0.16%)#95 | 2,208,794(0.00%)#2,569 |
| 96. | Fairborn | 83 | 52,367(0.16%)#96 | 2,208,794(0.00%)#2,571 |
| 97. | Ontario | 79 | 52,367(0.15%)#97 | 2,208,794(0.00%)#2,667 |
| 98. | Macedonia | 77 | 52,367(0.15%)#98 | 2,208,794(0.00%)#2,698 |
| 99. | Independence | 77 | 52,367(0.15%)#99 | 2,208,794(0.00%)#2,705 |
| 100. | Richfield | 73 | 52,367(0.14%)#100 | 2,208,794(0.00%)#2,795 |
Common Questions
What are the Top 10 Cities with the Most Immigrants from Eastern Europe in Ohio?
Top 10 Cities with the Most Immigrants from Eastern Europe in Ohio are:
#1
4,167
#2
3,687
#3
2,410
#4
1,551
#5
1,208
#6
1,101
#7
1,044
#8
979
#9
973
#10
912
What city has the Most Immigrants from Eastern Europe in Ohio?
Columbus has the Most Immigrants from Eastern Europe in Ohio with 4,167.
What is the Total Immigrants from Eastern Europe in the State of Ohio?
Total Immigrants from Eastern Europe in Ohio is 52,367.
What is the Total Immigrants from Eastern Europe in the United States?
Total Immigrants from Eastern Europe in the United States is 2,208,794.