Cities with the Most Immigrants from Eastern Europe in Alabama
RELATED REPORTS & OPTIONS
Eastern Europe
Alabama
Compare Cities
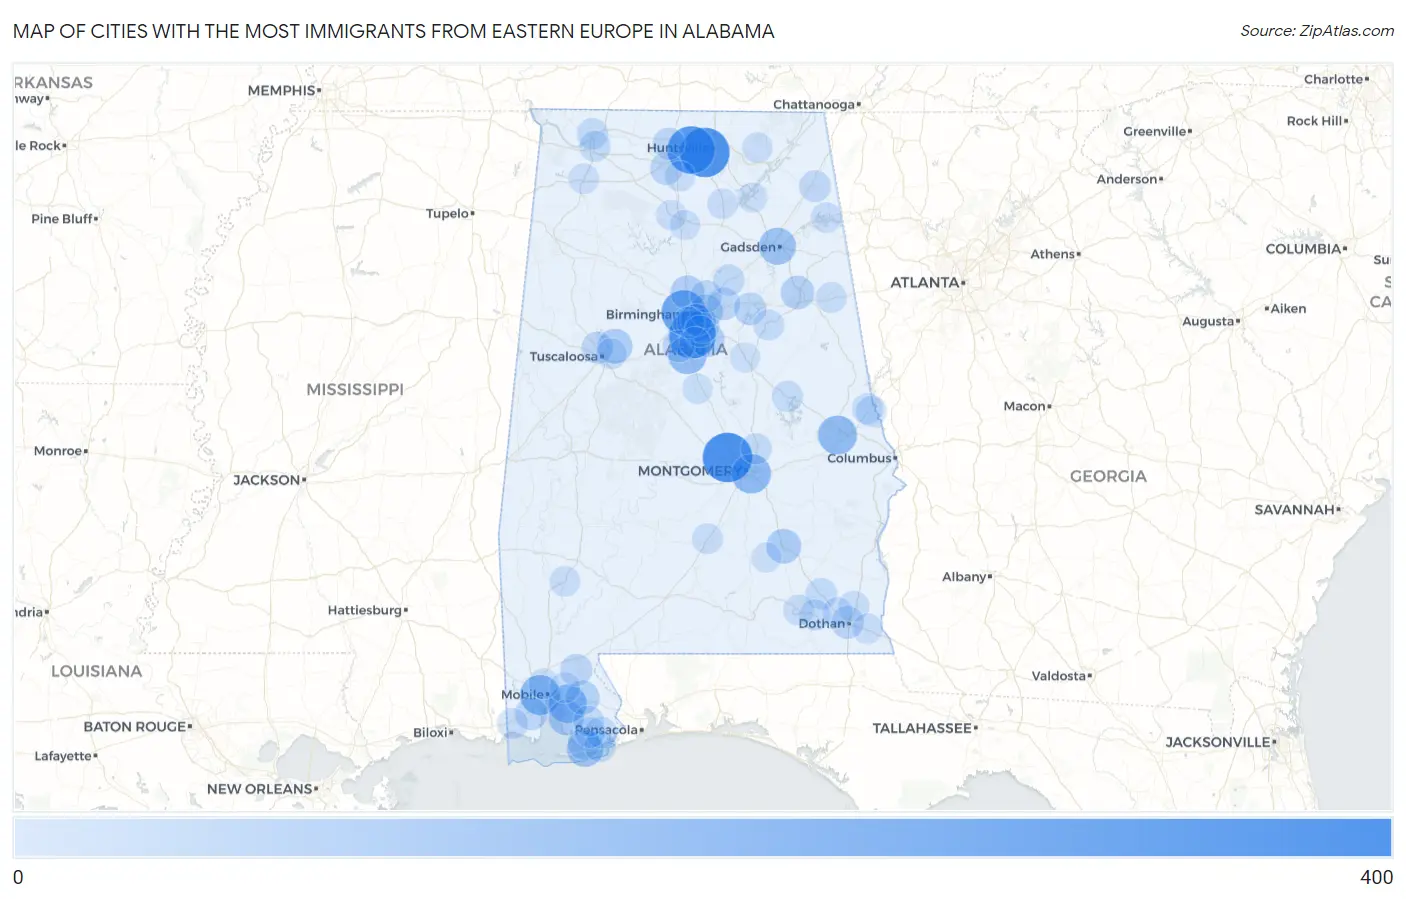
Map of Cities with the Most Immigrants from Eastern Europe in Alabama
0
400
Cities with the Most Immigrants from Eastern Europe in Alabama
| City | Eastern Europe | vs State | vs National | |
| 1. | Prattville | 324 | 5,336(6.07%)#1 | 2,208,794(0.01%)#936 |
| 2. | Huntsville | 319 | 5,336(5.98%)#2 | 2,208,794(0.01%)#948 |
| 3. | Madison | 290 | 5,336(5.43%)#3 | 2,208,794(0.01%)#1,038 |
| 4. | Hoover | 281 | 5,336(5.27%)#4 | 2,208,794(0.01%)#1,070 |
| 5. | Birmingham | 238 | 5,336(4.46%)#5 | 2,208,794(0.01%)#1,230 |
| 6. | Mobile | 161 | 5,336(3.02%)#6 | 2,208,794(0.01%)#1,649 |
| 7. | Montgomery | 152 | 5,336(2.85%)#7 | 2,208,794(0.01%)#1,726 |
| 8. | Auburn | 144 | 5,336(2.70%)#8 | 2,208,794(0.01%)#1,808 |
| 9. | Daphne | 138 | 5,336(2.59%)#9 | 2,208,794(0.01%)#1,880 |
| 10. | Alabaster | 135 | 5,336(2.53%)#10 | 2,208,794(0.01%)#1,906 |
| 11. | Vestavia Hills | 132 | 5,336(2.47%)#11 | 2,208,794(0.01%)#1,927 |
| 12. | Gadsden | 112 | 5,336(2.10%)#12 | 2,208,794(0.01%)#2,141 |
| 13. | Gulf Shores | 102 | 5,336(1.91%)#13 | 2,208,794(0.00%)#2,277 |
| 14. | Fairhope | 86 | 5,336(1.61%)#14 | 2,208,794(0.00%)#2,510 |
| 15. | Tuscaloosa | 76 | 5,336(1.42%)#15 | 2,208,794(0.00%)#2,716 |
| 16. | Troy | 75 | 5,336(1.41%)#16 | 2,208,794(0.00%)#2,747 |
| 17. | Chelsea | 67 | 5,336(1.26%)#17 | 2,208,794(0.00%)#2,904 |
| 18. | Gardendale | 63 | 5,336(1.18%)#18 | 2,208,794(0.00%)#2,989 |
| 19. | Loxley | 62 | 5,336(1.16%)#19 | 2,208,794(0.00%)#3,018 |
| 20. | Brook Highland | 56 | 5,336(1.05%)#20 | 2,208,794(0.00%)#3,173 |
| 21. | Anniston | 55 | 5,336(1.03%)#21 | 2,208,794(0.00%)#3,196 |
| 22. | Irondale | 53 | 5,336(0.99%)#22 | 2,208,794(0.00%)#3,256 |
| 23. | Theodore | 40 | 5,336(0.75%)#23 | 2,208,794(0.00%)#3,761 |
| 24. | Dothan | 39 | 5,336(0.73%)#24 | 2,208,794(0.00%)#3,778 |
| 25. | Moody | 39 | 5,336(0.73%)#25 | 2,208,794(0.00%)#3,792 |
| 26. | Decatur | 36 | 5,336(0.67%)#26 | 2,208,794(0.00%)#3,912 |
| 27. | Pell City | 36 | 5,336(0.67%)#27 | 2,208,794(0.00%)#3,922 |
| 28. | Bay Minette | 33 | 5,336(0.62%)#28 | 2,208,794(0.00%)#4,066 |
| 29. | Helena | 32 | 5,336(0.60%)#29 | 2,208,794(0.00%)#4,104 |
| 30. | Northport | 31 | 5,336(0.58%)#30 | 2,208,794(0.00%)#4,151 |
| 31. | Athens | 31 | 5,336(0.58%)#31 | 2,208,794(0.00%)#4,152 |
| 32. | Grayson Valley | 30 | 5,336(0.56%)#32 | 2,208,794(0.00%)#4,240 |
| 33. | Bon Secour | 28 | 5,336(0.52%)#33 | 2,208,794(0.00%)#4,361 |
| 34. | Fort Payne | 27 | 5,336(0.51%)#34 | 2,208,794(0.00%)#4,385 |
| 35. | Mountain Brook | 26 | 5,336(0.49%)#35 | 2,208,794(0.00%)#4,434 |
| 36. | Springville | 23 | 5,336(0.43%)#36 | 2,208,794(0.00%)#4,687 |
| 37. | Homewood | 22 | 5,336(0.41%)#37 | 2,208,794(0.00%)#4,723 |
| 38. | Meadowbrook | 22 | 5,336(0.41%)#38 | 2,208,794(0.00%)#4,738 |
| 39. | Elberta | 22 | 5,336(0.41%)#39 | 2,208,794(0.00%)#4,773 |
| 40. | Ozark | 21 | 5,336(0.39%)#40 | 2,208,794(0.00%)#4,807 |
| 41. | Florence | 19 | 5,336(0.36%)#41 | 2,208,794(0.00%)#4,960 |
| 42. | Orange Beach | 19 | 5,336(0.36%)#42 | 2,208,794(0.00%)#4,985 |
| 43. | Pelham | 18 | 5,336(0.34%)#43 | 2,208,794(0.00%)#5,061 |
| 44. | Daleville | 18 | 5,336(0.34%)#44 | 2,208,794(0.00%)#5,111 |
| 45. | Muscle Shoals | 16 | 5,336(0.30%)#45 | 2,208,794(0.00%)#5,294 |
| 46. | Wetumpka | 16 | 5,336(0.30%)#46 | 2,208,794(0.00%)#5,326 |
| 47. | Foley | 15 | 5,336(0.28%)#47 | 2,208,794(0.00%)#5,405 |
| 48. | Lanett | 15 | 5,336(0.28%)#48 | 2,208,794(0.00%)#5,434 |
| 49. | Talladega | 14 | 5,336(0.26%)#49 | 2,208,794(0.00%)#5,530 |
| 50. | Alexander City | 14 | 5,336(0.26%)#50 | 2,208,794(0.00%)#5,531 |
| 51. | Valley | 13 | 5,336(0.24%)#51 | 2,208,794(0.00%)#5,684 |
| 52. | Spanish Fort | 13 | 5,336(0.24%)#52 | 2,208,794(0.00%)#5,686 |
| 53. | Grand Bay | 13 | 5,336(0.24%)#53 | 2,208,794(0.00%)#5,727 |
| 54. | Enterprise | 12 | 5,336(0.22%)#54 | 2,208,794(0.00%)#5,794 |
| 55. | Heflin | 12 | 5,336(0.22%)#55 | 2,208,794(0.00%)#5,854 |
| 56. | Summerdale | 12 | 5,336(0.22%)#56 | 2,208,794(0.00%)#5,893 |
| 57. | Greenville | 11 | 5,336(0.21%)#57 | 2,208,794(0.00%)#5,965 |
| 58. | Headland | 11 | 5,336(0.21%)#58 | 2,208,794(0.00%)#5,983 |
| 59. | Holt | 9 | 5,336(0.17%)#59 | 2,208,794(0.00%)#6,327 |
| 60. | Russellville | 8 | 5,336(0.15%)#60 | 2,208,794(0.00%)#6,430 |
| 61. | Priceville | 8 | 5,336(0.15%)#61 | 2,208,794(0.00%)#6,469 |
| 62. | Cedar Bluff | 8 | 5,336(0.15%)#62 | 2,208,794(0.00%)#6,524 |
| 63. | West Point | 8 | 5,336(0.15%)#63 | 2,208,794(0.00%)#6,570 |
| 64. | Jackson | 7 | 5,336(0.13%)#64 | 2,208,794(0.00%)#6,640 |
| 65. | Ashford | 7 | 5,336(0.13%)#65 | 2,208,794(0.00%)#6,688 |
| 66. | Arab | 6 | 5,336(0.11%)#66 | 2,208,794(0.00%)#6,814 |
| 67. | Chickasaw | 6 | 5,336(0.11%)#67 | 2,208,794(0.00%)#6,820 |
| 68. | Midland City | 5 | 5,336(0.09%)#68 | 2,208,794(0.00%)#7,093 |
| 69. | Cullman | 3 | 5,336(0.06%)#69 | 2,208,794(0.00%)#7,404 |
| 70. | Jemison | 3 | 5,336(0.06%)#70 | 2,208,794(0.00%)#7,429 |
| 71. | Pleasant Groves | 3 | 5,336(0.06%)#71 | 2,208,794(0.00%)#7,588 |
| 72. | Oak Grove | 2 | 5,336(0.04%)#72 | 2,208,794(0.00%)#7,757 |
| 73. | Goshen | 2 | 5,336(0.04%)#73 | 2,208,794(0.00%)#7,844 |
| 74. | Guntersville | 1 | 5,336(0.02%)#74 | 2,208,794(0.00%)#7,937 |
Common Questions
What are the Top 10 Cities with the Most Immigrants from Eastern Europe in Alabama?
Top 10 Cities with the Most Immigrants from Eastern Europe in Alabama are:
#1
324
#2
319
#3
290
#4
281
#5
238
#6
161
#7
152
#8
144
#9
138
#10
135
What city has the Most Immigrants from Eastern Europe in Alabama?
Prattville has the Most Immigrants from Eastern Europe in Alabama with 324.
What is the Total Immigrants from Eastern Europe in the State of Alabama?
Total Immigrants from Eastern Europe in Alabama is 5,336.
What is the Total Immigrants from Eastern Europe in the United States?
Total Immigrants from Eastern Europe in the United States is 2,208,794.